


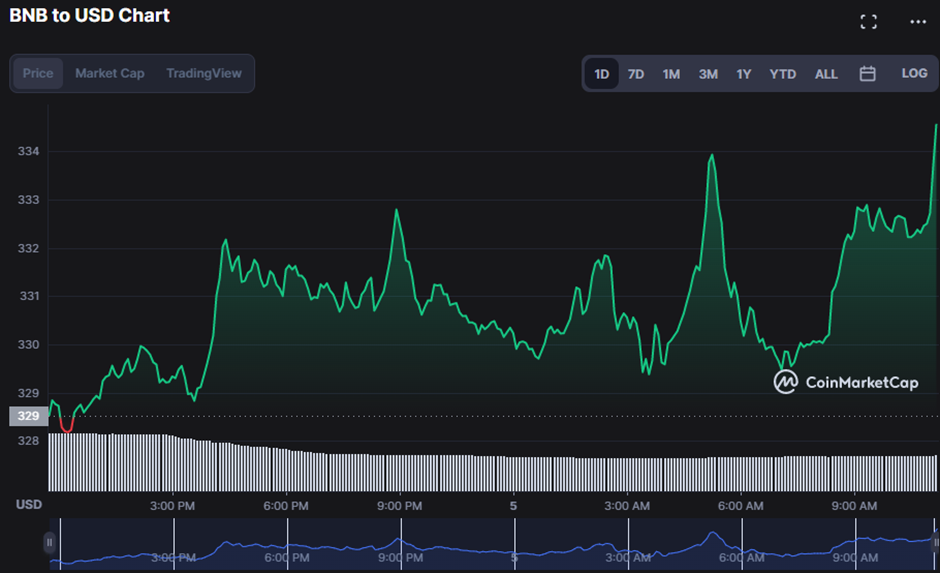
- Bullish trend in the previous 24 hours lifts BNB price to 30-day high.
- BNB prices fluctuate from $328.83 to $337.32 on the last day.
- Indicators forecast that the market’s positive trend is likely to continue.
The BNB market has been bullish for 24 hours after establishing support at around $328.13. The bulls successfully raised the price to a new 30-day high of $337.32 due to their bullish control. As of press time, this bullish dominance had persisted, valuing the BNB price at $335.86, a 2.15% uptick.
Traders’ hopes of a long bull run drove the market capitalization up by 2.15% to $53,031,608,087 during the upswing. The 24-hour trading volume, on the other hand, fell by 36.96% to $487,526,063, indicating that traders are still hesitant to fully commit to the BNB’s bullish market, resulting in subdued trading activity.
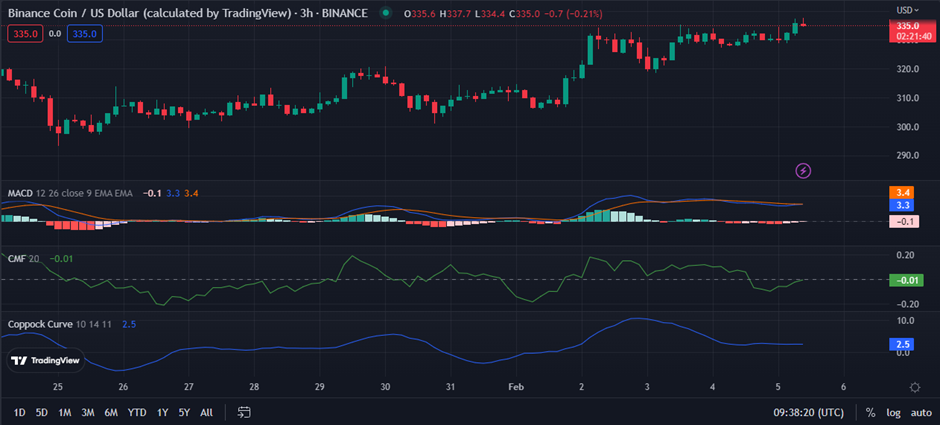
The MACD line has gone well above the signal line, suggesting that bullish sentiment is strong, and a reading of 3.5 indicates that the current trend is likely to continue for some time. This move predicts that the BNB price will increase to new highs, giving traders optimism for a bull run.
With a rating of 0.01, the Chaikin Money Flow (CMF) motion has lately flipped to the positive area. This suggests that funds are flowing into the asset, and investors may be trying to profit from the BNB growing price. Furthermore, this movement implies that optimistic sentiment has been developing around the BNB price, which might lead to further purchasing and a price jump soon.
The Coppock Curve, which has a reading of 2.7, also indicates that the BNB market has witnessed an inflow of investors in the last several hours and may see a price increase in the next few hours. This combination of CMF and Coppock Curve readings gives excellent insight into BNB price activity and shows that a bullish breakthrough is more likely.
If the Money Flow Index (MFI) is more than 50, buyers are commanding the BNB market, and the BNB price will likely continue to rise. On the BNB price chart, the Money Flow Index (MFI) value of 69.06 indicates that buying pressure is more significant than selling pressure, suggesting that the BNB price will continue to rise. This shift marks the bull’s power growing, which points to a likely higher trend in the BNB price.
The ROC line’s upward movement, with a value of 1.95 reflecting a developing bullish tendency in the BNB market, adds credence to the upward momentum. The MFI rating above 50 and the ROC line in the positive territory point to BNB’s potential for additional gains.
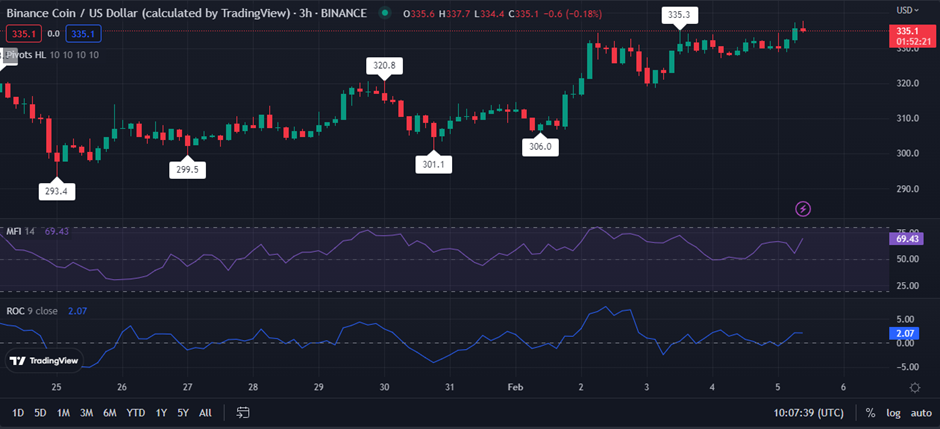
Maintaining resistance levels and pushing prices higher in the BNB market is essential for bulls seeking to extend their leading position.
Disclaimer: The views and opinions, as well as all the information shared in this price analysis, are published in good faith. Readers must do their own research and due diligence. Any action taken by the reader is strictly at their own risk. Coin Edition and its affiliates will not be held liable for any direct or indirect damage or loss.
Disclaimer: The information presented in this article is for informational and educational purposes only. The article does not constitute financial advice or advice of any kind. Coin Edition is not responsible for any losses incurred as a result of the utilization of content, products, or services mentioned. Readers are advised to exercise caution before taking any action related to the company.
 Price Prediction 2024-2030: Will BGB Price Hit $5 Soon?")

 Price Prediction 2024-2030: Will OMNI Price Hit $100 Soon?")


 At $0.065 Now Can Be Equal To Buying Solana At $10")

