


- Aave price analysis shows a declining market sentiment
- Support for AAVE is present at $56.5
- Aave is trading below the 20-day EMA and 50-day SMA at $58.0
Aave price analysis reveals a downtrend in the last 24 hours as the price of Aave dips from a daily high of $60.0 to $56.1 representing a 3.17% decrease over the past 24 hours. On closer observation, it can be seen that bearish sentiment prevails with continued downward movement despite a slight pullback at the market’s peak of $58.4. In addition, Aave is trading below both the 20-day EMA and 50-day SMA at $60.0 providing a bearish signal.
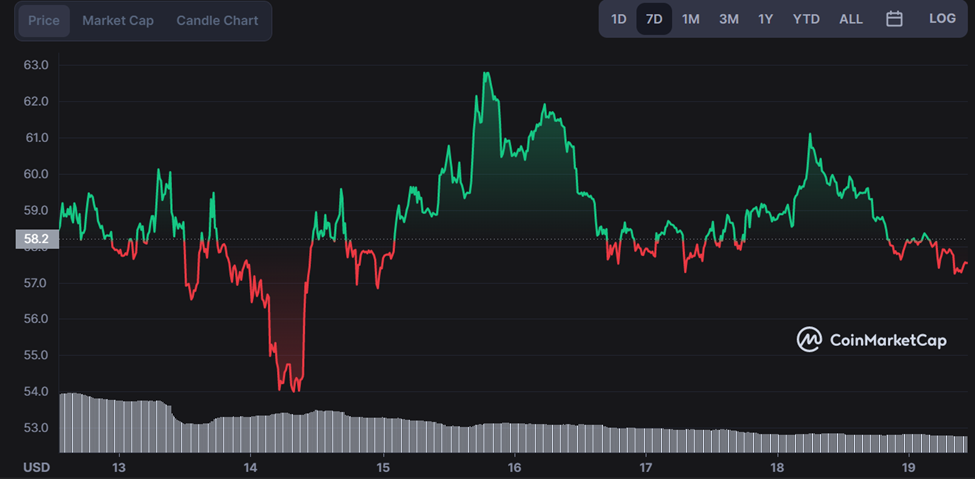
Key support lies at the $56.5 mark which will likely be tested in the near term with continued sideways movement before an attempt to break out or breakdown takes place. In addition, the Relative Strength Index is showing a bearish divergence and points towards further downside movement.
Aave has been trading in a rounding bottom pattern for the past few days, as observed on the Aave price chart. Key support is present at $56.5 and with continued sideways movement in the near term, there could be a test of this level before an attempt to breakout takes place. On the other hand, a breakdown below support could see Aave fall towards $52.0. Overall, Aave is in a bearish market sentiment at the moment.
Aave price analysis on a daily chart indicates AAVE/USD pair is trading in a falling wedge pattern, with a key support level present at $56.5 which is being tested in the near term. The fib retracement levels show that the 23.6% and 38.2% fib levels are providing support at $58.0 which can be used as a stop-loss level in case there is a fall below the $56.5 support level, with the next key support being present at $52.1 followed by $50.0.
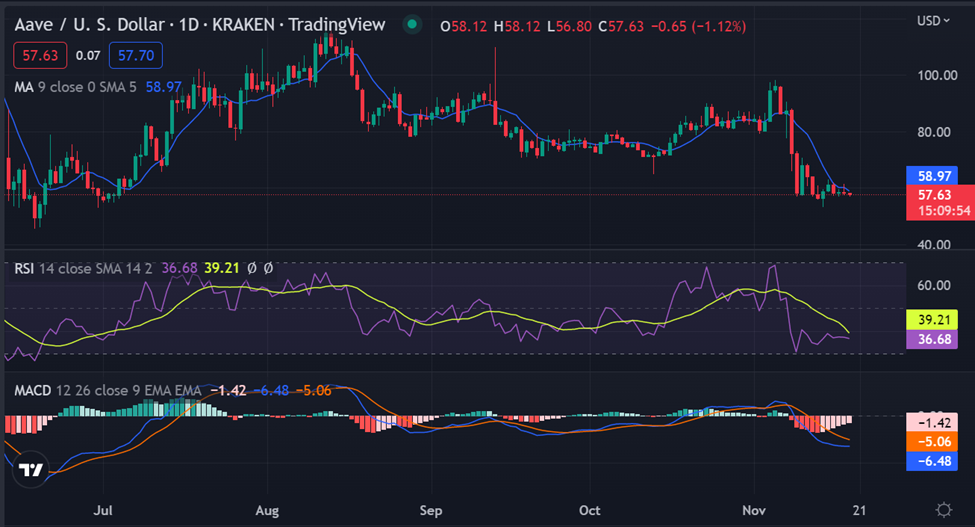
The Stochastic RSI oscillator shows a bearish cross is forming, provided there is no bullish divergence present. This indicates that further downside movement can be expected and the key support level at $56.5 could be broken in order to see Aave fall towards a further low of $52.0.
Aave price analysis on a 4-hour chart and hourly chart shows that Aave is in a downtrend, with key support levels at $56.5 and $58.0 respectively which are being tested in the near term. The relative strength index oscillator is also pointing toward further downside movement with a bearish divergence forming on the daily charts, signaling an increase in selling pressure from traders.
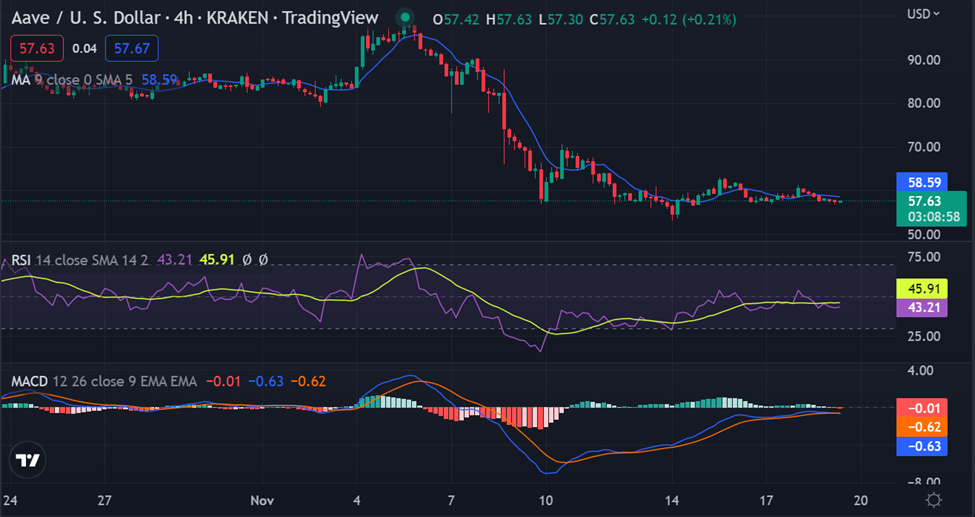
The market volatility is increasing and this could result in a breakout or breakdown from the current consolidation. The Bollinger bands are widening which could indicate a breakout or breakdown from the current range.
Overall, Aave price analysis points towards further downside movement in the near term, with key support levels at $56.5 and $58.0 likely to be tested before an attempt to break out or breakdown takes place. In addition, a bearish divergence is forming on the charts which could indicate a breakdown from the current consolidation.
Disclaimer: The information presented in this article is for informational and educational purposes only. The article does not constitute financial advice or advice of any kind. Coin Edition is not responsible for any losses incurred as a result of the utilization of content, products, or services mentioned. Readers are advised to exercise caution before taking any action related to the company.


