


- AGIX market shows a bullish trend with strong investor confidence.
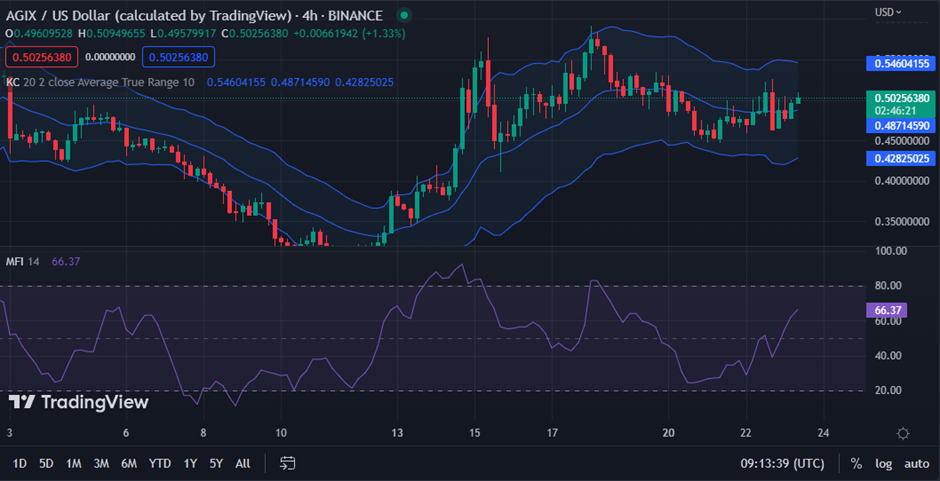
- Widening Keltner Channel suggests positive momentum and potential for price stability.
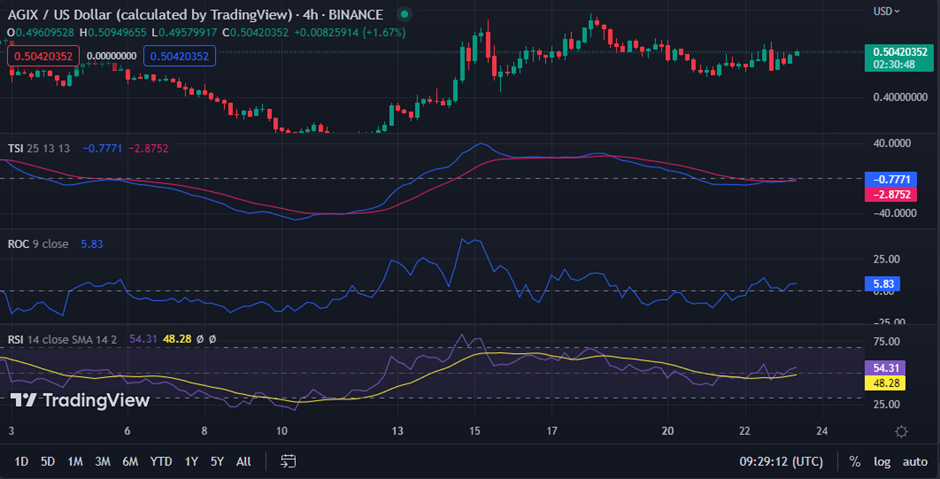
- MFI and TSI indicators signal a buying opportunity for traders.
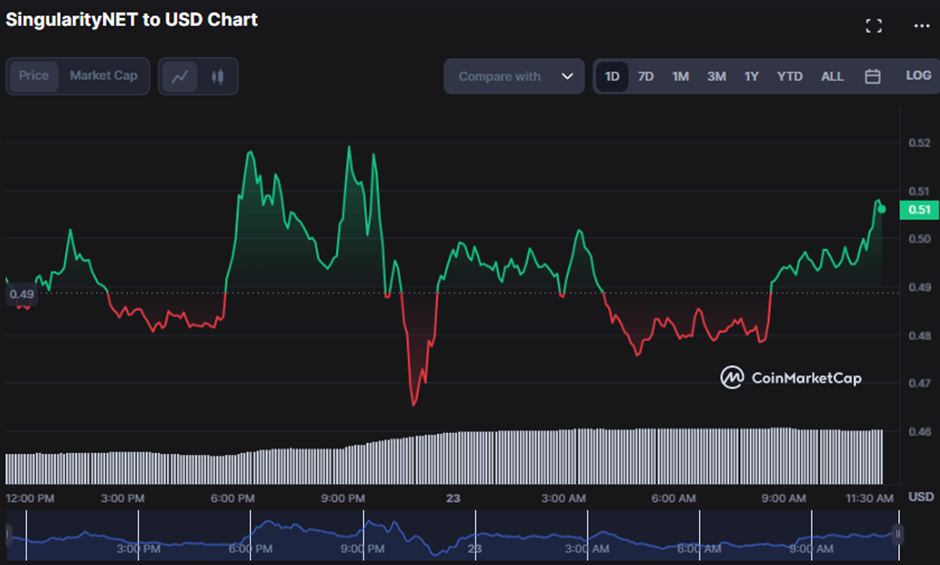
Bulls and bears have been dueling for control in the SingularityNET (AGIX) market over the past 24 hours, with prices oscillating between $0.5197 and $0.4643, respectively. Yet, as of press time, the bulls had triumphed, and AGIX was trading at $0.5074, a 3.15% increase.
If the bulls continue to dominate the AGIX market, the next resistance level, if $0.5197, is breached, may be $0.5263 and $0.5329. However, if the bears seize control, the support levels to monitor are $0.4972 and $0.4906.
Traders entered the market expecting a lengthy bull rise, increasing market capitalization and 24-hour trading volume by 2.83% and 79.70%, respectively, to $611,859,213 and $313,925,982. This spike suggests investors are confident about AGIX’s future and prepared to invest more money. There is a high level of activity and interest in AGIX, which might lead to enhanced market liquidity and price stability.
In the price chart for AGIX, a widening Keltner Channel suggests that the positive momentum in AGIX will continue for the foreseeable future. The top band of the channel shows a strong uptrend, while the bottom band offers a support level for possible pullbacks. The Keltner bands demonstrate this upward tendency with a touch at 0.54633016 in the top band and a touch at 0.42842845 in the lower band.
The formation of green candlesticks and a rising price trend towards the upper band support the continuation of the uptrend. This move indicates that buyers exert upward pressure on the price and may aim for the next resistance level near the top band.
The Money Flow Index (MFI) of 66.26 exceeds the 50 threshold, suggesting that money is moving into the asset. The positive divergence between the MFI and price indicates room for more gains to the upside.
While the True Strength Index (TSI) is above its signal line at -1.0490 and headed into positive territory, the bullishness in AGIX is expected to continue, signaling a good buying opportunity for traders.
Adding to the bullish picture, the Rate of Change (ROC) is favorable, with a value of 5.22, indicating that momentum is mounting in the stock. This move strengthens the possible purchasing opportunity for traders aiming to profit from AGIX’s upward trend.
The Relative Strength Index is above its signal line at 53.80, indicating that AGIX is now in a neutral zone and may encounter some volatility soon before possibly resuming its upward trend. This rise indicates that the bulls still have the opportunity to drive the price higher, but caution should be maintained since the RSI is not yet in the overbought zone, and a retreat is still possible.
AGIX is poised for a bullish run as investors show confidence in its future, with strong momentum and support levels in place.
Disclaimer: The views, opinions, and information shared in this price prediction are published in good faith. Readers must do their research and due diligence. Any action taken by the reader is strictly at their own risk. Coin Edition and its affiliates will not be liable for direct or indirect damage or loss.
Disclaimer: The information presented in this article is for informational and educational purposes only. The article does not constitute financial advice or advice of any kind. Coin Edition is not responsible for any losses incurred as a result of the utilization of content, products, or services mentioned. Readers are advised to exercise caution before taking any action related to the company.


