


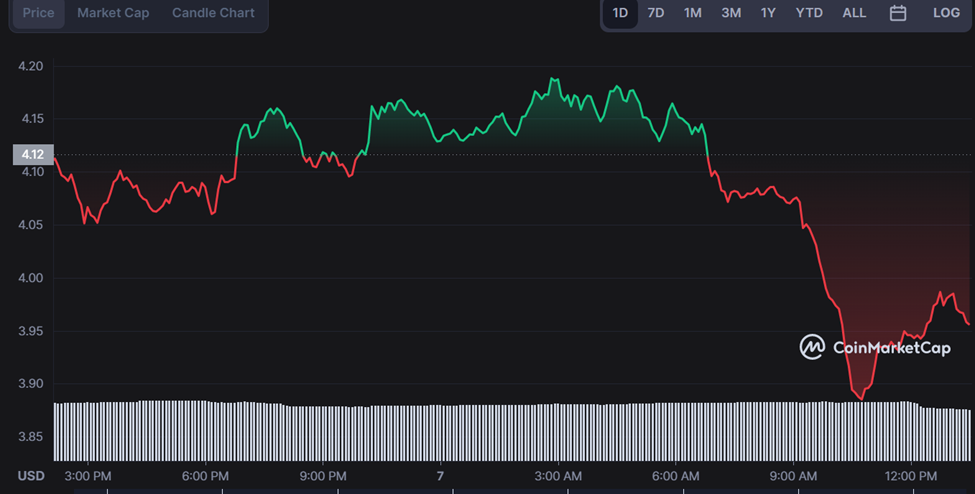
- Apecoin is trading in a falling trendline for the past 24 hours.
- APE could be setting up for a bullish reversal in the near term as it tests the neckline of a double-top pattern
- There is potential for a short-term rally to $4.50 if the double top holds.
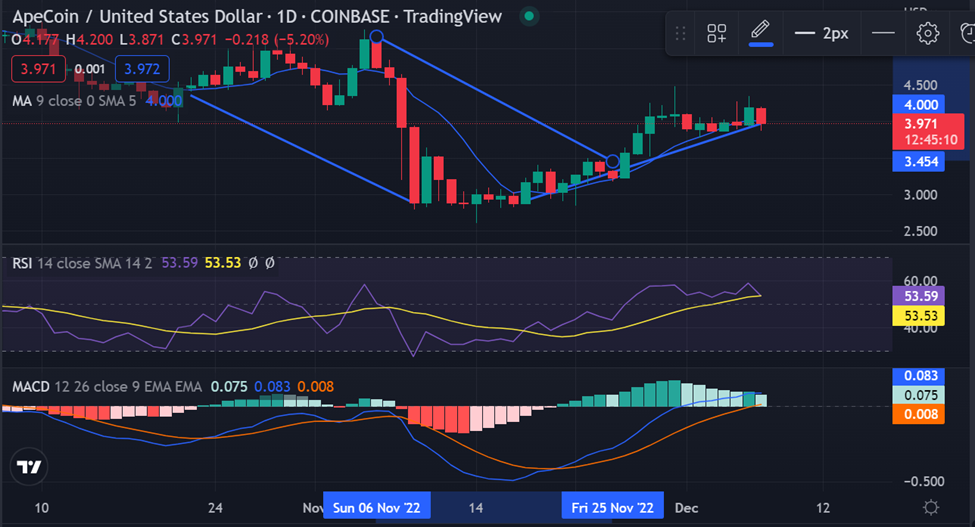
Apecoin (APE) price analysis indicates the altcoin is currently trading in a falling trendline, indicating that the overall trend is bearish. More specifically, Apecoin has formed a double top pattern near the weekly highs of $0.41882 and appears to be testing the neckline of this pattern at current levels of around $3.97.
If this support holds, we could see a short-term rebound to levels of around $4.50, signaling a possible reversal in the trend and a move higher for Apecoin. However, any break below this neckline could see further losses in the near term as traders take profits from the recent rally.
Apecoin price analysis indicates APE is trading at $3.97, with a daily trading volume of $170,292,047.07. The currency has formed a bearish reversal pattern on the daily chart as it tests the neckline of a double top. The Fibonacci retracement tool shows that the price has fallen sharply from the weekly high of $0.41882 to the current level of $3.97.
A bearish reversal pattern on the daily chart could suggest that further downside is likely in the near term. However, traders should keep an eye on the double-top support level, as a sustained break above this level could see a short-term rally to $4.50 and beyond.
Apecoin’s technical analysis reveals the crypto is currently in a bearish trend, with potential for a short-term rally to $4.50 if the neckline of the double top holds. The moving average lines show that the price is trading below both the short-term and long-term moving averages, indicating that downward momentum could be building. For instance, the MACD line has crossed below the signal line, suggesting that bearish momentum is gaining strength.
The 200-day moving average provides another key support level, with a sustained break below this level likely to signal long-term weakness for Apecoin. The SMA 200 is currently hovering around $2.50, suggesting that the price will have to fall significantly further before this resistance level is tested.
Apecoin price analysis concludes that the cryptocurrency is currently in a short-term downtrend with the potential to move higher if the double-top neckline holds. The key support levels to watch for include the Fibonacci retracement levels and the 200-day moving average, while major resistance levels can be found at $4.50 and $6.00.
Disclaimer: The information presented in this article is for informational and educational purposes only. The article does not constitute financial advice or advice of any kind. Coin Edition is not responsible for any losses incurred as a result of the utilization of content, products, or services mentioned. Readers are advised to exercise caution before taking any action related to the company.


