
 Price Plummets Further as FTX’s Solvency Woes")

- Recent Bitcoin price research suggests another gloomy run.
- This week’s tectonic disturbance is caused by FTX withdrawals.
- Bitcoin is facing resistance at $17,480.18 and support at $16,543.48.
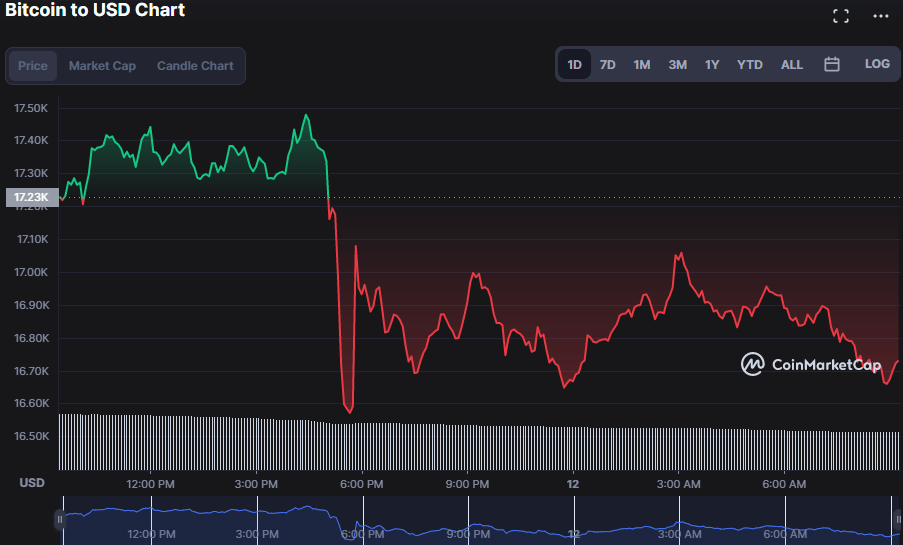
Bulls are fatigued after a price surge in the last 24 hours, as Bitcoin has lost 3.46% of its value after hitting resistance at $17,480.18 and is now trading at $16,756.87.
The FTT crisis, which has led in withdrawals from FTX, and a 3.47% loss in market capitalization to $321,433,254,143, as well as a 33.64% drop in 1-day trading volume to $50,195,272,490, are among the causes that may have contributed to this decline.
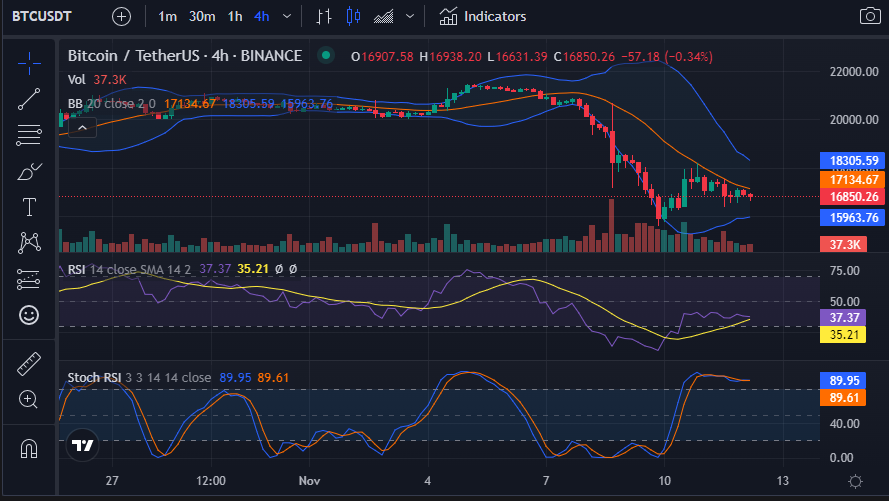
On the BTC price chart, shrinking Bollinger Bands indicate a prolongation of the bearish trend, with the upper band touching $18306.09 and the lower band touching $15954.06. The spot price trajectory toward the lower band indicates that bear grip will prevail.
Since the 4-hour price chart’s Relative Strength Index (RSI) is pointing south with a rating of 36.86 and the Bitcoin price is approaching the oversold level, the gloomy grip on it is projected to constrict even more.
In recent hours, the Stoch RSI has been moving in the overbought territory, with a reading of 89.77, indicating that the current trend is nearing its end however this does not necessarily guarantee that prices will rebound higher but acts as a caution to traders.
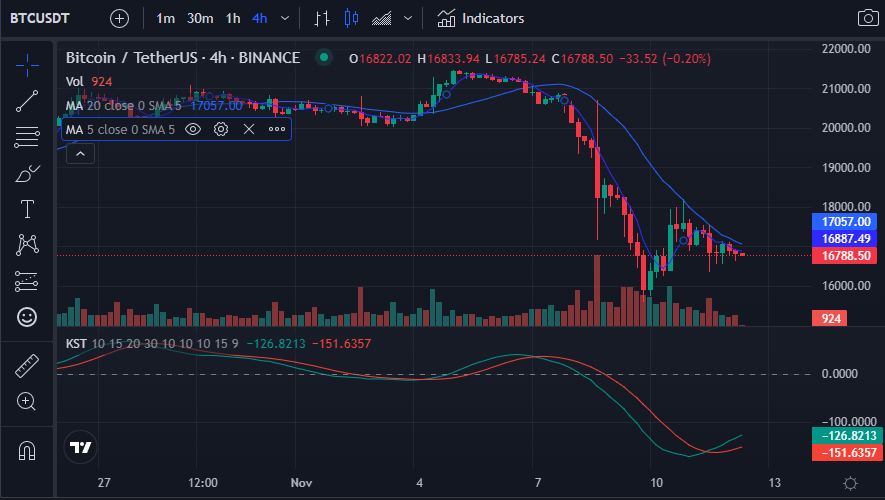
The value of the Know Sure Thing (KST) is -134.1813, but it is climbing. The fact that the KST line is in the negative region and rising indicates that the bearish momentum is fading.
As the long-term Moving Average rises above the short-term Moving Average, a bearish crossover ensues. On BTC charts, this is visible when the 20-day moving average crosses over the 5-day moving average, which has readings of 17058.24 and 16895.87, respectively.
The bears have grabbed dominance of the market and successfully dragged prices lower during the last 24 hours.
Disclaimer: The views and opinions, as well as all the information shared in this price prediction, are published in good faith. Readers must do their research and due diligence. Any action taken by the reader is strictly at their own risk. Coin Edition and its affiliates will not be held liable for any direct or indirect damage or loss.
Disclaimer: The information presented in this article is for informational and educational purposes only. The article does not constitute financial advice or advice of any kind. Coin Edition is not responsible for any losses incurred as a result of the utilization of content, products, or services mentioned. Readers are advised to exercise caution before taking any action related to the company.


, XRP, and Polygon (MATIC) Are Cryptos That Everyone Should Accumulate in Red Market, Claimed Analyst")


 has slumped in price, backtracking 3.46% to $16,756.87. If the bulls are unable to hold the resistance, the adverse trend is projected to grow.)