
 Market")

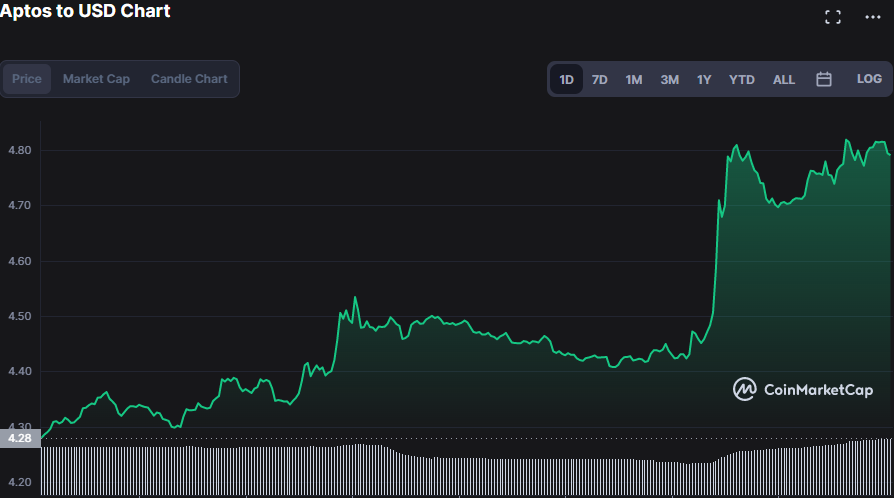
- Over the past day, the Aptos (APT) market has consistently increased.
- This upturn is supported by rising trade volume and market capitalisation.
- APT encountered resistance at $4.82 during the upswing and found support at $4.30.
The Aptos (APT) market has been increasing steadily over the last day, and its bulls have managed to raise the bar higher by 10.22%, valuing the stock at $4.75
Aptos establishement as the preferred platform for creating top-notch decentralized applications(dApps), is bolstering this upswing . The 12.10% increase in market capitalization to $616,007,402 and the 16.68% increase in 24 hour trading volume to $150,867,742 also contribute to this upturn.
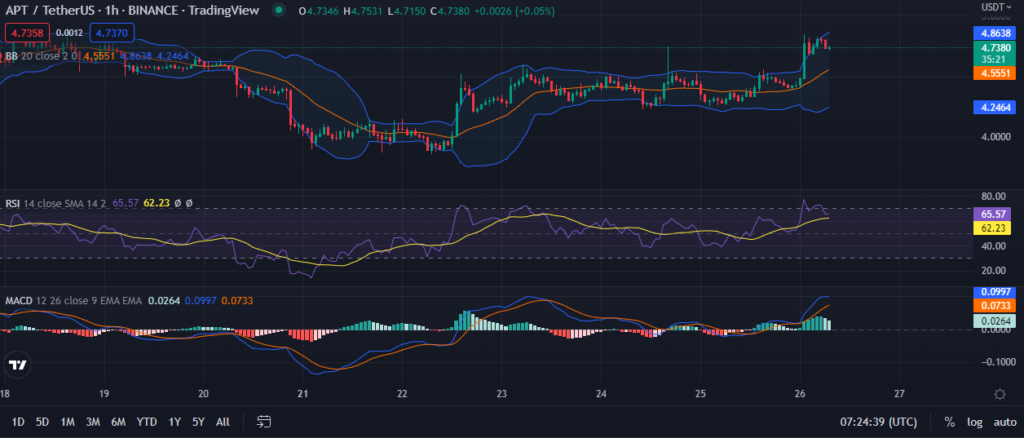
As market volatility rises, Bollinger bands enlarge, which is a bullish sign. This move is plainly seen on the APT 1-hour price chart, where the upper band contacts at 4.8618 and the lower band touches at 4.2471. This robust growth is being reinforced by the APT price swings towards the upper Bollinger band, which foresees continued bull dominance.
Given that the Relative Strength Index (RSI) is currently reading 66.13, which is neither in overbought nor oversold territory, prolonged bull dominance is set to continue. The MACD is advancing above the signal line with a reading of 0.0999, which is a bullish crossing that is contributing to this bull run. This upturn is also corroborated by the MACD blue line’s trajectory and the histogram’s position in the positive region.
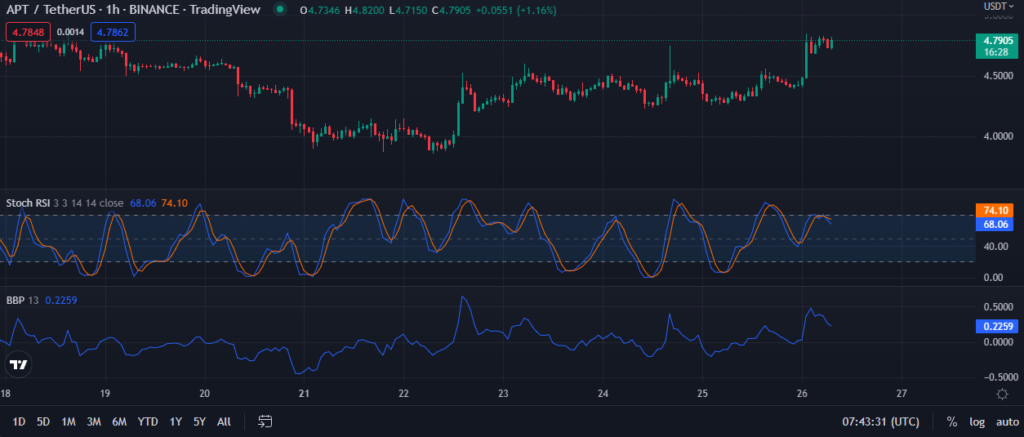
The stochastic RSI is at 64.84 on the 1-hour price chart, meaning that the buying and selling pressures in the APT market are equal at this level. This indication indicates that the present bullish control is likely to remain.
A bull run is predicted by a reading of the Bull Bear Power (BBP) above “0.” With a BBP reading of 0.1748 as seen on the APT price chart, this upturn is expected to continue, but the fact that it is pointing south towards negative territory urges traders to exercise caution.
Bulls must maintain the resistance level and drive prices higher to continue this steady growth.
Disclaimer: The views and opinions, as well as all the information shared in this price analysis, are published in good faith. Readers must do their own research and due diligence. Any action taken by the reader is strictly at their own risk, Coin Edition and its affiliates will not be held liable for any direct or indirect damage or loss.
Disclaimer: The information presented in this article is for informational and educational purposes only. The article does not constitute financial advice or advice of any kind. Coin Edition is not responsible for any losses incurred as a result of the utilization of content, products, or services mentioned. Readers are advised to exercise caution before taking any action related to the company.


 Lands on ProBit Global, Simplifying BRC-20 Token Trading")


 market. Will bulls reign be invalidated? Read more.)