


- In the previous 24 hours, the PUNDIX market has maintained a bullish hold.
- Technical signs indicate that a reversal is probable in the short future.
- Bulls must continue to fight in order to render bears’ efforts ineffective.
Over the last week, the bulls have been in control of Pundi X, a complete end-to-end blockchain solution that integrates several blockchain networks for smooth cryptocurrency transactions across borders. The bulls drove the prices with steady hikes.Despite the bears’ early 24 hour effort to gain market control, the PUNDIX price surged to an intra month high of $0.4298. This bullish trend persisted, with a 3.18% increase to $0.4116 at press time.
PUNDIX market capitalization and 24 hour trading volume both climbed by 2.94% to $106,071,383 and 151.56% to $18,857,652 respectively, in tandem with rising market interest. This movement indicates that investors are increasingly confident in PUNDIX’s success and that it is in high demand.
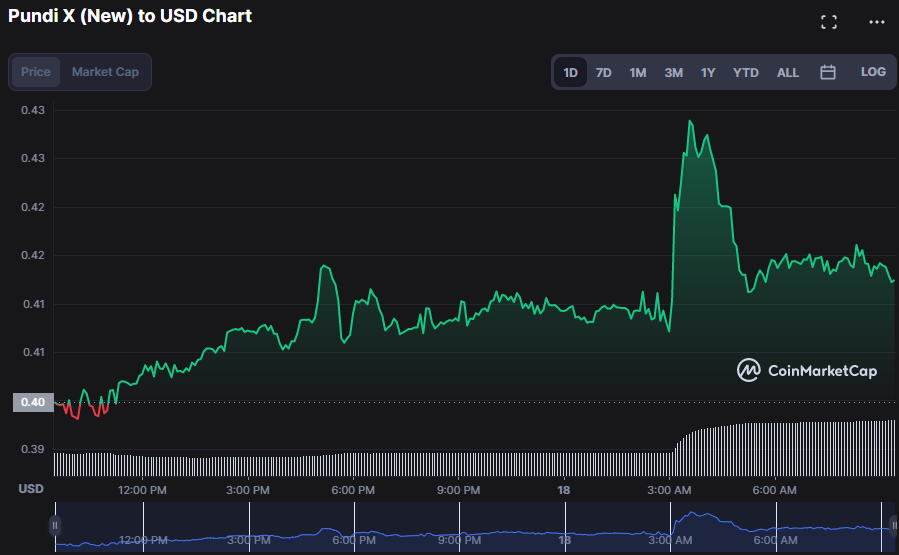
The bulls’ unrelenting effort to maintain control of the PUNDIX market has caused the price to bounce between $0.3981 and $0.4298, respectively. If positive pressure continues, investors may anticipate prices to break through resistance at $0.4298 and perhaps reach the next resistance level at $0.4783, resulting in a rise in capital investment. If the bull’s hold loosens, the market might see a selloff, with prices dropping as low as $0.3981. If this support level is breached, the market might enter a negative spiral, with prices falling as low as $0.3590.
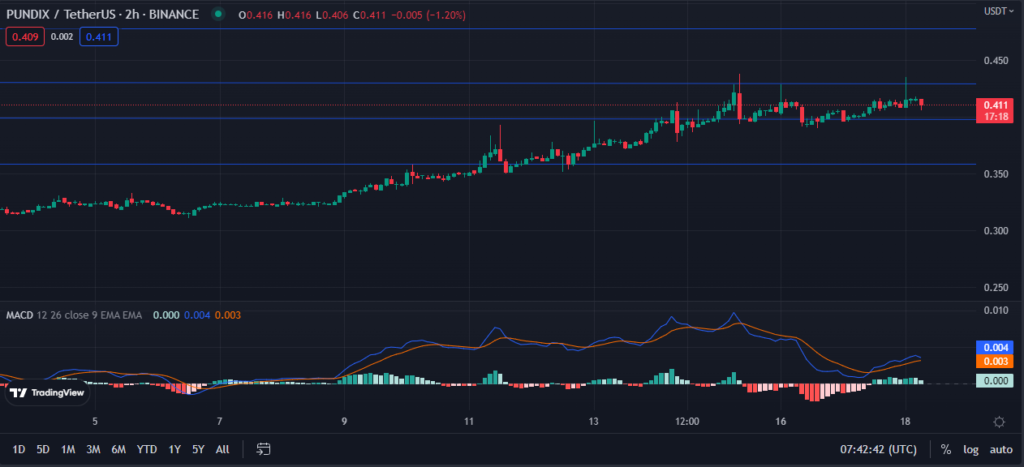
The MACD blue line trends in the positive region with a value of 0.004 above its signal line, indicating that PUNDIX market’s bullish dominance is not yet over. Adding to this bullish sentiment, the histogram remains in the positive sector, with a reading of 0.001 and rising, offering more evidence for the market’s optimistic mindset.
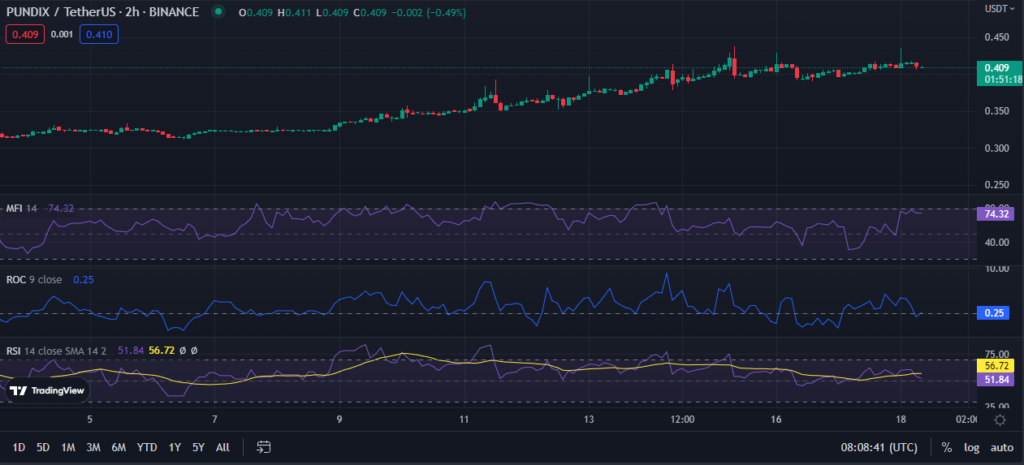
With a Money Flow Index (MFI) rating of 74.73 and heading south on the PUNDIX price chart, investors may be worried that the stock is approaching overbought territory and may see a selloff.
The Rate of Change (ROC) trend in the positive zone with a score of 0.25 indicates that the bullish trend is still intact, but the MFI rating might signal that a downturn is approaching. However, if bulls continue to fight and prices rise, the MFI rating may imply that bulls are buying into the rally, and momentum may be sustained.
The trend of the Relative Strength Index (RSI) below its signal line of 54.14 warns traders of a probable reversal. This movement indicates a probable trend reversal and may be a warning to investors to begin cutting their exposure to the stock as bearish momentum may be on the way.
Lastly, technical indications warn investors to be wary of probable trend reversals in the near term.
Disclaimer: The views and opinions, as well as all the information shared in this price analysis, are published in good faith. Readers must do their own research and due diligence. Any action taken by the reader is strictly at their own risk, Coin Edition and its affiliates will not be held liable for any direct or indirect damage or loss.
Disclaimer: The information presented in this article is for informational and educational purposes only. The article does not constitute financial advice or advice of any kind. Coin Edition is not responsible for any losses incurred as a result of the utilization of content, products, or services mentioned. Readers are advised to exercise caution before taking any action related to the company.


 (PUNDIX) bulls defy technical indicators projections as the monthly high of $0.4298 is reached in the previous 24 hours. Read more.)