


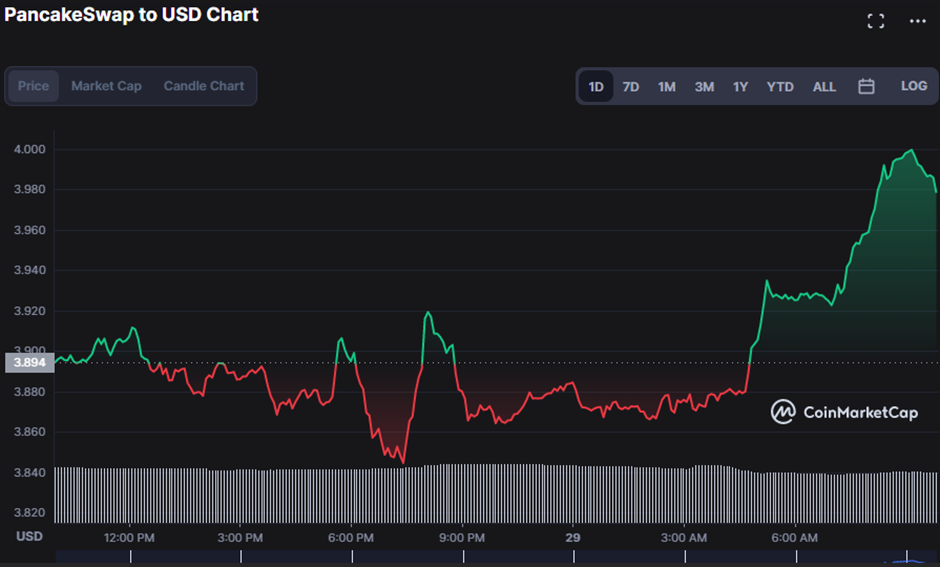
- CAKE’s prices fell under bearish control to an intraday low of $3.84.
- Technical indicators warn investors to keep an eye out for reversals
- Bulls must keep pressing higher to counter technical indicator forecasts
As PancakeSwap’s (CAKE) price fell to a low of $3.84, a bearish influence was felt strongly; however, bulls intervened and drove prices higher later in the day. As of press time, CAKE was trading at $4.01, up 2.69%.
The market capitalization increased by 4.70% to $626,609,388 to reinforce this rising trend. However, during the uptrend, the 24 hour trading volume fell by 8.63% to $22,952,812; this action suggests that it may be time to sell and take profits because volume is falling during an uptrend.
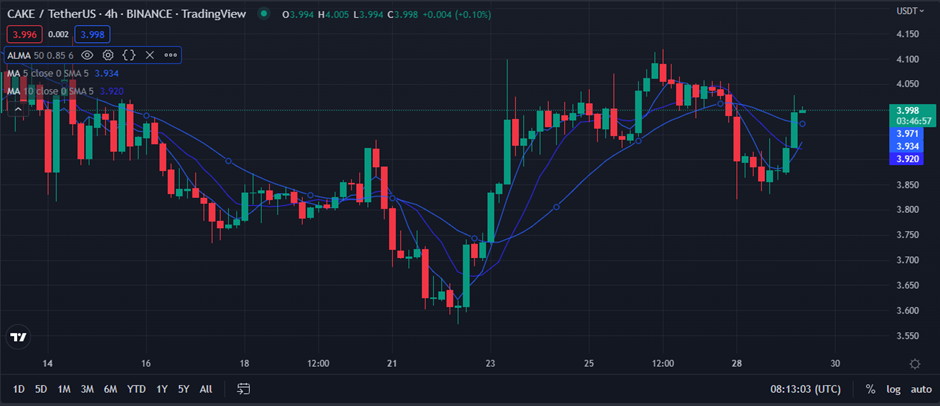
Price swings above the intersection of the two moving averages and the Arnaud Legoux Moving Average (ALMA) is a buy indication when looking for buy and sell signals using the ALMA and MAs. The 50-day ALMA and the 5-day and 10-day MAs hitting at 3.971, 3.935, and 3.921, respectively, on the CAKE 4-hour price chart make this apparent.
The movement of the shorter-term MA above the longer-term MA, as shown by the reading of the 5 and 10-day MAs, contributes to this bullish sentiment.
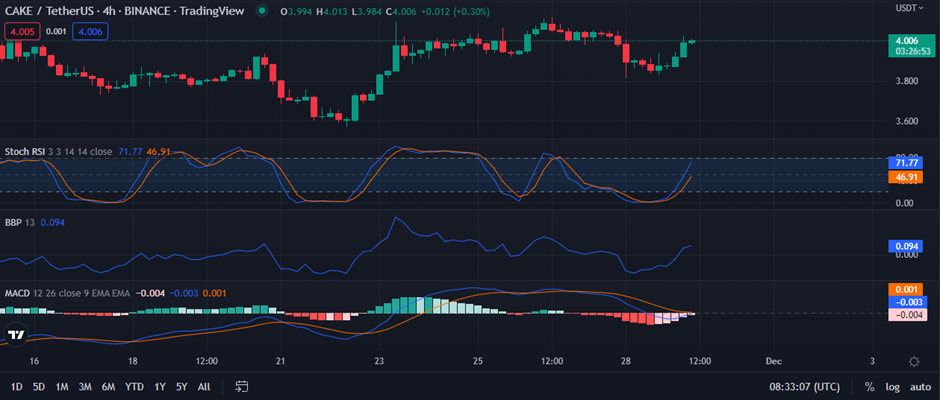
The stochastic RSI, which is currently reading 69.60, indicates that this bullish dominance has not yet reached its peak because it is neither overbought nor oversold. This behavior gives traders hope for a further bull run since it is trending in the direction of the overbought level “80.”
With a rating of 0.090 and a trend above the “0” line, the Bull Bear Power (BBP) predicts that the current bullish momentum will continue. Investors should use caution going forward, though, because of its close proximity to the zero line.
The MACD blue line’s trajectory, which is in the negative region and below the signal line with a reading of -0.003, also alerts traders to the possibility of a turnaround. The trend of the histogram being in the negative region further supports this gloomy hypothesis.
In order to maintain this strong growth, bulls must retain the resistance level and drive prices higher.
Disclaimer: The views and opinions, as well as all the information shared in this price analysis, are published in good faith. Readers must do their own research and due diligence. Any action taken by the reader is strictly at their own risk, Coin Edition and its affiliates will not be held liable for any direct or indirect damage or loss.
Disclaimer: The information presented in this article is for informational and educational purposes only. The article does not constitute financial advice or advice of any kind. Coin Edition is not responsible for any losses incurred as a result of the utilization of content, products, or services mentioned. Readers are advised to exercise caution before taking any action related to the company.


, XRP, and Polygon (MATIC) Are Cryptos That Everyone Should Accumulate in Red Market, Claimed Analyst")


 market as prices increased to $4.01, a rise of 2.69%.)