


- Social activity of LINK increased with the Chainlink Economics 2.0 protocol upgrade.
- The hype on social activity fails to reciprocate in LINK prices.
- 200-day MA and Bollinger upper bands menacingly close.
The social activity of Chainlink’s token, LINK, rapidly increased since the company announced the protocol upgrade, Chainlink Economics 2.0. The social activity of Link surged from 35,540 yesterday to 44,173 and is expected to keep rising.
Chainlink BUILD program, which is part of the Chainlink Economic 2.0 upgrade, aims to accelerate the growth of early-stage and established projects within the Chainlink ecosystem.
The project seeks to provide enhanced access to Chainlink services and technical support in exchange for commitments of network fees and other incentives to Chainlink service providers, such as stakers.
However, the hype shown on the social activity doesn’t seem to reflect the price of LINK.
According to CoinMarketCap, Chainlink is up 1.70% in the last 24 hours and is trading at $5.87. As shown in the graph below, LINK experienced some turbulence in price from November 14-16. Since November 16, the prices have been moving sideways until November 20.
However, as shown by white parallel lines, LINK has been registering new lows since Friday when it recorded a low of $6.068, and then it recorded a new low of $5.920 the very next day. Subsequently, it reached its lowest of $5.601 yesterday.
Notably, the bearish trend seems to have passed. The green dotted line in the graph shows that this could be the start of a bullish trend as LINK is recording new high lows.
Moreover, the Bollinger bands, too, are widening, indicating that there could be a trend reversal. Interestingly, the price of LINK overlaps the upper Bollinger bands, which shows a bearish view, as opposed to the green-dotted line indicated in the graph. More intriguing is the fact that the 200-day MA and the upper Bollinger bands are very close to each other. As such, the 200-day MA at $6.147 acts as the immediate resistance before Resistance 1.
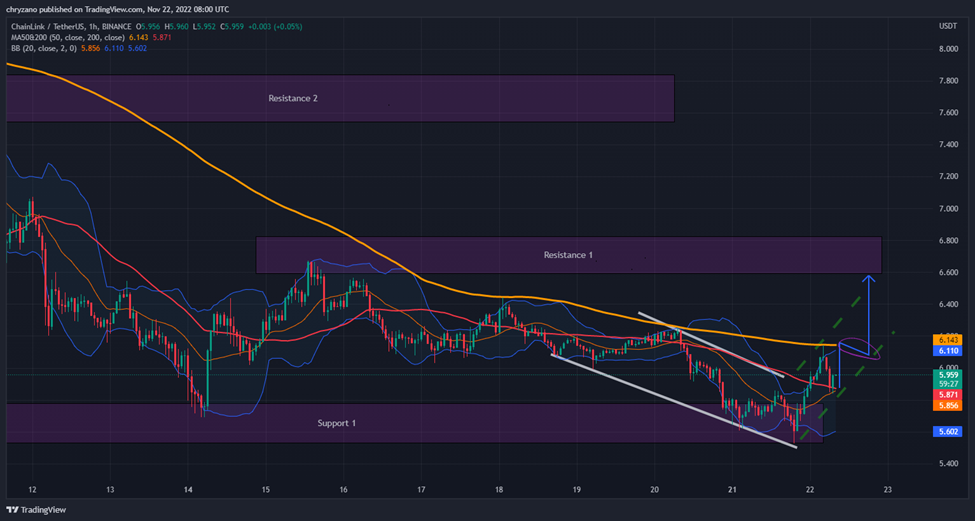
However, if the bulls push through the immediate resistance, it will aim at hitting Resistance 1, which is at $6.5. If the bears dominate, then LINK will land on Support 1, around $5.6.
Disclaimer: The views and opinions, as well as all the information shared in this price prediction, are published in good faith. Readers must do their research and due diligence. Any action taken by the reader is strictly at their own risk. Coin Edition and its affiliates will not be held liable for any direct or indirect damage or loss.
Disclaimer: The information presented in this article is for informational and educational purposes only. The article does not constitute financial advice or advice of any kind. Coin Edition is not responsible for any losses incurred as a result of the utilization of content, products, or services mentioned. Readers are advised to exercise caution before taking any action related to the company.


, XRP, and Polygon (MATIC) Are Cryptos That Everyone Should Accumulate in Red Market, Claimed Analyst")

