


- After several days, bulls reclaim control.
- The cost of CRT increases by 6.40% to $0.8818.
- Will the bullish trend last?
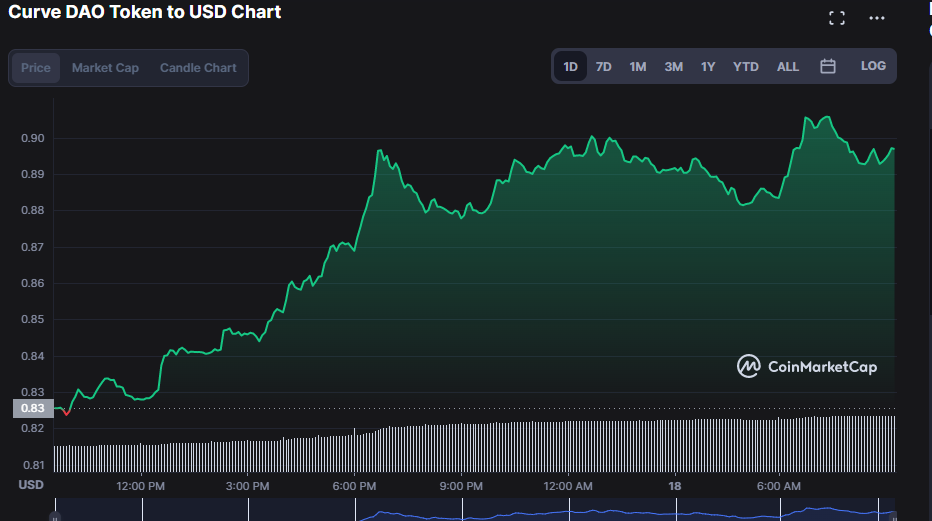
Curve DAO Token has experienced a remarkable rise in price over the last 24 hours after a fall and sell-off in the previous days. The bulls have consistently held sway over the market since October 17, 2022, and they currently have the upper hand.
Curve DAO Token (CRV) was trading at $0.8975 at the time of publication, a rise of 6.40% from its lows. The rising market capitalization and trading volume have influenced the price action. For the past 24 hours, CRV’s trading volume has climbed up 120.26% to $75,900,086 and the market capitalization has increased by 8.53% to $475,564,527.
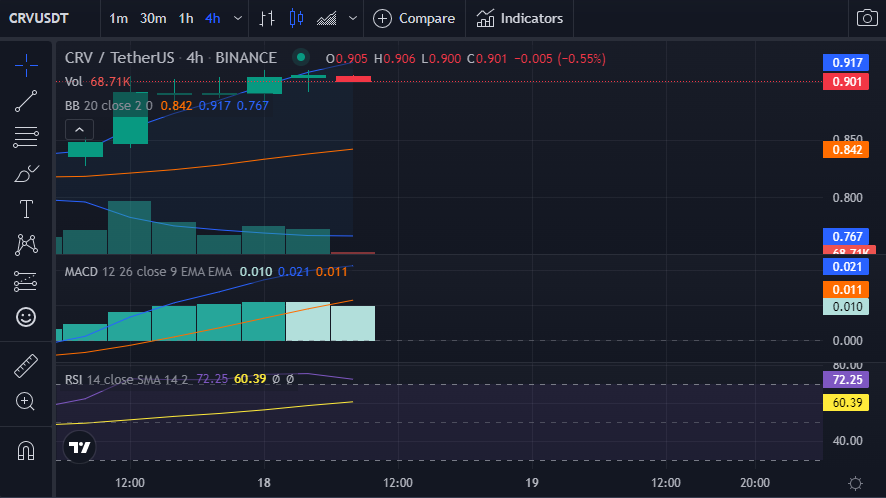
Technical indicators on the 4-hour and daily price charts show that the bulls have been in control of the market for the past 24 hours.
Bollinger Bands are bulging, indicating increased buying pressure as a result of rising market volatility. The bottom band is at 0.767, while the top band is at 0.917, and the market is moving in the direction of the higher band, indicating an uptrend.
As prices rise, a definite positive trendline may be seen on the price charts. With a line value of 71.68, the Relative Strength Index (RSI) is approaching the overbought area. However, approaching the overbought region does not necessarily indicate that prices will fall; rather, it simply alerts traders that the RSI is approaching the extremes of its most recent values.
The MACD line is in the positive region and has outperformed the signal line. It makes contact at 0.021 while the signal line makes contact at 0.011. Positive momentum in the CDT markets is indicated by the MACD line rising over the signal line. The MACD line is also moving north, indicating the possibility of the bullish uptrend continuing.
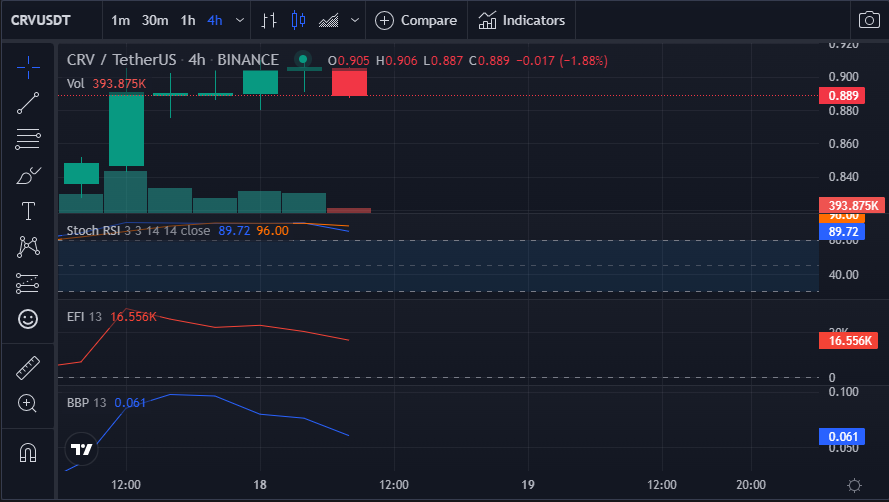
The Stoch RSI has a value of 96.06, which indicates that even though the market is bullish in the short term, prices may revert lower as it suggests the market may be ending its current trend. This reading is above the overbought level of 80 and should be interpreted with caution by traders.
Readings over 0 on the Elder Force Index (EFI) and Bull Bear Power (BBP) signify a positive momentum. Their respective readings are 16.465k and 0.061. But as can be seen from the 4-hour price charts, their lines are pointing south, suggesting that the prices may reverse downward.
If the bulls are to maintain price stability despite several indicators pointing to a near-term end to the current trend, they must maintain price stability.
Disclaimer: The views and opinions, as well as all the information shared in this price analysis, are published in good faith. Readers must do their own research and due diligence. Any action taken by the reader is strictly at their own risk, Coin Edition and its affiliates will not be held liable for any direct or indirect damage or loss.
Disclaimer: The information presented in this article is for informational and educational purposes only. The article does not constitute financial advice or advice of any kind. Coin Edition is not responsible for any losses incurred as a result of the utilization of content, products, or services mentioned. Readers are advised to exercise caution before taking any action related to the company.


