


- Ethereum Classic is down 2.25% in the last 24 hours and is trading at $19.88.
- The death cross increases the depth of ETC’s fall; from $27.22 – $17.72
- The 200-day MA predicts sideways movements, while the 50-day MA has a bullish overview.
Ethereum Classic (ETC) is down 2.25% in the last 24 hours, and as of press time, it is trading at $19.88, according to CoinMarketCap. Since the beginning of November, ETC has been experiencing a rollercoaster ride in terms of price fluctuations.
During November’s initial days, ETC fluctuated in a bearish rising wedge (pink outline). After reaching $27.22 on November 6, the prices took quite a drastic fall and landed at $17.72 in less than three days. As depicted in the chart, the death cross where the 50-day MA crosses the 200-day MA is also responsible for the depth of the fall.
However, following the fall, the price of ETC was able to gain some momentum. After reaching $22.97 on November 10, the price of ETC has been fluctuating in a bullish falling wedge (white outlined).
Notably, just after the bullish falling wedge, prices slightly increased from approximately $18 to $20. Since that little spike that happened on November 14, ETC has been moving sideways in the $19 – $21 range while gradually descending.
The price of ETC, which was $19.61 on November 20, fell to $17.16 in less than 24 hours. However, since the price of ETC touched the lower Bollinger bands, the market corrected the prices. From that point onward, ETC has been fluctuating in a bearish flag.
Meanwhile, the 200-day MA is parallel to the horizontal axis, denoting that the prices will move sideways. The 50-day MA has a bullish overview, as it is slightly tilting upwards.
Interestingly, the Bollinger bands are converging, which means that ETC is displaying low volatility. However, ETC, after touching the lower band today, seems to be rising as the markets seem to have corrected the oversold price.
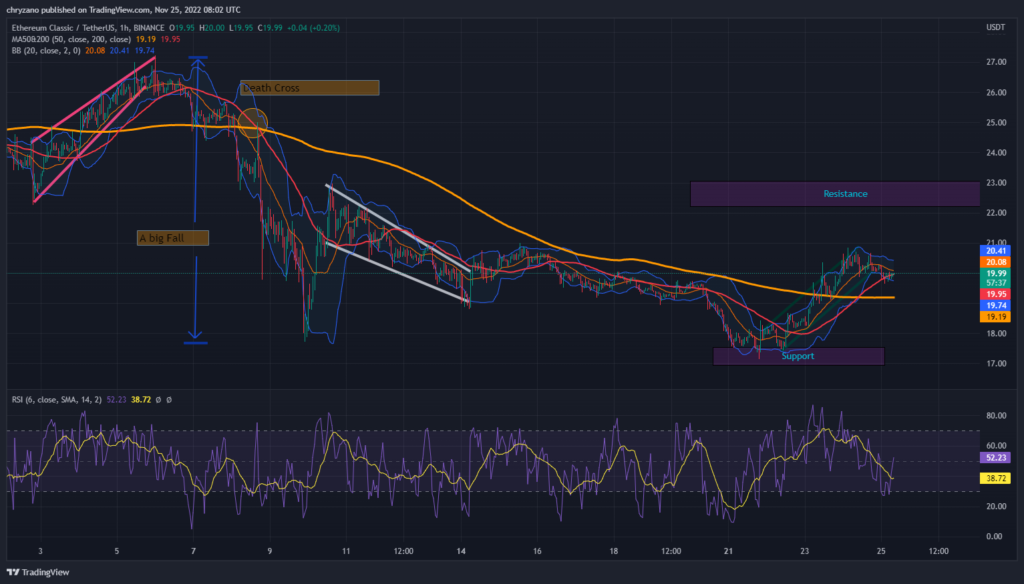
If the bears dominate the market, the price of ETC may land on the support level, which is positioned between $16.9 – $17.5. Contrastingly, if the bulls push hard enough, the prices of ETC could hit the resistance level based on $22 – $23.
Disclaimer: The views and opinions, as well as all the information shared in this price prediction, are published in good faith. Readers must do their research and due diligence. Any action taken by the reader is strictly at their own risk. Coin Edition and its affiliates will not be held liable for any direct or indirect damage or loss.
Disclaimer: The information presented in this article is for informational and educational purposes only. The article does not constitute financial advice or advice of any kind. Coin Edition is not responsible for any losses incurred as a result of the utilization of content, products, or services mentioned. Readers are advised to exercise caution before taking any action related to the company.


, XRP, and Polygon (MATIC) Are Cryptos That Everyone Should Accumulate in Red Market, Claimed Analyst")

