


- Bullish Oasis Network (ROSE) price prediction ranges from $0.0334 to $0.1200
- Analysis suggests that the ROSE price might reach above $0.1100.
- The ROSE bearish market price prediction for 2023 is $0.0334.
Oasis Network is the leading privacy-enabled layer-1 token built on the Ethereum blockchain. Its native token is denoted as ROSE.
Oasis Network investors are bullish on the token since it has had a return on investment (ROI) of over 87% in the past two years. The spill of the crypto bubble of 2021 led to an increase in the price of ROSE into early 2022, which saw it attain its present all-time high (ATH) of $0.5964 in January 2022. Irrespective of the recent crypto winter, which led to a dip in the price of most cryptocurrencies, ROSE investors are confident that the future of ROSE is bullish.
If you are interested in the future of Oasis Network (ROSE) and want to know the price analysis and prediction of ROSE for 2023, 2024, 2025, 2026, and up to 2030, keep reading this Coin Edition article.
Table of contents
- Network (ROSE) Market Overview
- What is Oasis Network (ROSE)?
- Analysts’ Views on Oasis Network
- Oasis Network (ROSE) Current Market Status
- Oasis Network (ROSE) Price Analysis 2023
- Oasis Network (ROSE) Price Prediction 2023-2030 Overview
- Oasis Network (ROSE) Price Prediction 2023
- Oasis Network (ROSE) Price Prediction 2024
- Oasis Network (ROSE) Price Prediction 2025
- Oasis Network (ROSE) Price Prediction 2026
- Oasis Network (ROSE) Price Prediction 2027
- Oasis Network (ROSE) Price Prediction 2028
- Oasis Network (ROSE) Price Prediction 2029
- Oasis Network (ROSE) Price Prediction 2030
- Oasis Network (ROSE) Price Prediction 2040
- Oasis Network (ROSE) Price Prediction 2050
- Conclusion
- FAQ
- More Crypto Price Predictions:
Network (ROSE) Market Overview
| 🪙 Name | Oasis Network |
| 💱 Symbol | ROSE |
| 🏅 Rank | #111 |
| 💲 Price | $0.0954220645548 |
| 📊 Price Change (1h) | -0.49 % |
| 📊 Price Change (24h) | 4.96 % |
| 📊 Price Change (7d) | -23.6 % |
| 💵 Market Cap | $640625560.763 |
| 💸 Circulating Supply | 6713599876 ROSE |
| 💰 Total Supply | 10000000000 ROSE |
Oasis Network (ROSE) is currently trading at $0.0954220645548 and sits at number #111 on CoinMarketCap in terms of market capitalization. There are 6713599876 ROSE coins currently in circulation, bringing the total market cap to $640625560.763.
Over the past 24 hours, Oasis Network has increased by 4.96%. Looking at the last week, the coin is down by 23.6%.
What is Oasis Network (ROSE)?
Oasis Network is a privacy-enabled scalable layer-1 project built on the Ethereum network. Its native token is called ROSE. Oasis Network is at the forefront of ensuring that web3 succeeds and that decentralized finance (DEFI) applications can use its features to ensure privacy and scalability.
Oasis network is present in the Ethereum blockchain, Solana blockchain, Avalanche blockchain, and its mainnet in November 2020. Oasis Labs was founded by Dawn Song, Bobby Jaros, Noah Johnson, and Raymond Cheng. Ellen Patterson is the founder of Oasis Network.
On the Oasis Network layer-1 blockchain, creators and developers can build private smart contracts and tokenize data. It also aims to provide automated market makers, private lending, and undercollateralized loans. The tokenized data is achieved when users stake their data to receive rewards from applications that wish to analyze or control them for their services.
The presence of parallel smart contract layers within the Oasis Network that uses the Oasis ParaTime ensures that its consensus and execution layers are separate. This helps provide features that make transactions fast and highly scalable.
Some top developers on the Oasis Network include Oasis Labs, safeRate, Castalise, Alethea, Luther, Chainlink, Binance, Keyless, BANKEX, Provable, and Portl. The node operators include Chorus, Polychain Labs, Bisontrails, Staked, Second State, and Staking Fund.
Analysts’ Views on Oasis Network
An investor and researcher who goes by the name “WAVE JUMPER” tweeted that Binance was accumulating Oasis Network tokens (ROSE). Furthermore, the investor pointed out that albeit Binance topping the eco-fund to $300m, it has been still buying ROSE. Hence, he stated that he still feels bullish about ROSE.
Another crypto netizen tweeted a question asking his followers why they weren’t accumulating ROSE when Binance kept accumulating. Moreover, there seems to be a lot of suspicion and drama surrounding the buying frenzy. As such, we could see the netizen asking Chanpeng Zhao “What have you got cooking for @OasisProtocol?”
Oasis Network (ROSE) Current Market Status
Oasis Network (ROSE) has a circulating supply of 5,725,718,533 ROSE coins while its maximum supply is 10,000,000,000 ROSE coins, according to CoinMarketCap. At the time of writing, ROSE is trading at $0.0519 representing 24 hours decrease of 10.60%. The trading volume of ROSE in the past 24 hours is $29,414,527 which represents a 94.56% increase.
Some top cryptocurrency exchanges for trading Oasis Network (ROSE) are Binance, KuCoin, Gate.io, Coinlist, and Bitfinex.
Now that you know Oasis Network and its current market status, we shall discuss the price analysis of Oasis Network (ROSE) for 2023.
Oasis Network (ROSE) Price Analysis 2023
Currently, ROSE is ranked in the 110th position on CoinMarketCap. Will developments and upgrades within the Oasis Network community lead to a rise in the price of Oasis Network (ROSE)? We shall see in this Coin Edition price analysis 2023 article.
Oasis Network (ROSE) Price Analysis – Bollinger Bands
The Bollinger bands are a type of price envelope developed by John Bollinger. It gives a range with an upper and lower limit for the price to fluctuate. The Bollinger bands work on the principle of standard deviation and period (time).
The upper band as shown in the chart is calculated by adding two times the standard deviation to the Simple Moving Average while the lower band is calculated by subtracting two times the standard deviation from the Simple Moving Average.

When this setup is used in a cryptocurrency chart, we could expect the price of the cryptocurrency to reside within the upper and lower bounds of the Bollinger bands 95% of the time.
The above thesis is derived from an Empirical law also known as the three-sigma rule or the 68-95-99.7 which states that almost all observed data for a normal distribution (normal scattering of data) will fall within three standard deviations.
As such, for a data set that follows a normal distribution, 68% of data will fall within 1 standard deviation of the mean, while 95% of data for the normal distribution will fall within 2 standard deviations of the mean and 99.7% of data will fall within 3 standard deviations of the mean.
Hence, as the Bollinger bands are calculated using two standard deviations, we could expect ROSE to stay within the bounds of the Bollinger bands 95% of the time. (i.e. whenever the cryptocurrency touches the upper band, the chances of it coming down are 95%.). This concept applies vice-versa as well.
Moreover, the sections highlighted by red rectangles show how the bands expand and contract. When the bands widen, we could expect more volatility, and when the bands contract, it denotes less volatility. As the bands are widening currently, we could see a drastic change in prices.
Currently, the upper Bollinger band is moving downward while the lower band stays parallel to the horizontal axis. Hence, the range of motion for ROSE seems to be reducing. As such there could be consolidation in the future for ROSE. Moreover, ROSE has touched the lower Bollinger Band, hence, this may present an excellent opportunity for traders to enter the market by buying the dip.
When considering the previous occasions that ROSE retraced after touching the lower band, we could see that ROSE retraces only after testing the lower band multiple times. However, this time, ROSE has touched the lower Bollinger band just once, hence, it would be better for traders to wait for ROSE to fall further, and wait for a green candlestick before entering the market to cash in on maxim profits.
Notably, the Bollinger Band behaves very closely with the Keltner channel. For instance, if you were to use both the Bollinger bands and Keltner channel indicators for a cryptocurrency, you would see that almost most of the time both indicators overlap.
However, the only difference between with Bollinger band and the Keltner channel is that the Bollinger bands use Standard Deviation while the Keltner channel uses Average True Range for calculating its bands which are the top and bottom limits.
Oasis Network (ROSE) Price Analysis – Relative Strength Index
The Relative Strength Index is an indicator that is used to find out whether the price of a security is overvalued or undervalued. As per its name, RSI indicators help determine how the security is doing at present, relative to its previous price.
Moreover, it has a signal line which is a Simple Moving Average (SMA) that acts as a yardstick or reference to the RSI line. Hence, whenever the RSI line is above the SMA it is considered bullish and if it’s below the SMA then it is bearish.
When considering the first green rectangle from the left of the chart below we can see that the RSI is above the signal. Hence, ROSE is bullish and as a result, it is making higher highs.
The second green rectangle shows that the RSI line (purple) is below the Signal line (yellow). As such, ROSE is bearish or losing value. Therefore it is reaching lower lows as shown in the chart.
Currently, the RSI of ROSE is at 35 and it is heading towards the oversold region. More importantly, when considering the area of trend reversals, ROSE had a trend reversal quite close to where it is as of present. Hence, we may see another market correcting ROSE prices whereby it might rise.
To properly adjudicate this scenario, it is better for the investors to wait for the market to make a move, before making any vital moves. Furthermore, using another indicator or a combination of indicators for ensuring the probability of the occurrence of a trend reversal would be a smart option to look to.
To deduce whether a cryptocurrency is bearish or bullish, the RSI compares the gains of the securities against the losses it made in the past. This ratio of gains against the losses is then deducted from the 100.
If the answer is equal to or less than 30, then we call that the price of the security is in the oversold region.
This means that many are selling the security in the market, and as such the security is undervalued. Moreover, as per the Supply-demand curve theory, the price is supposed to drop when there is an increase in supply.
If the answer is equal to or greater than 70 then the security is overbought as many are buying. Since many want to buy the security the demand increases which intuitively increases the prices.
Additionally, the RSI could be used to determine how strong a trend is and could be used to signal divergence. For instance, when a cryptocurrency is bullish or reaching higher highs, then the RSI line also should be making higher highs in unison.
For instance, if the RSI is making lower highs when the cryptocurrency is making higher highs, then we may say that although the token/coin is on a bullish trend it is losing value. As such, there could be a trend reversal in the future.
However, the RSI could also give false alarms for breakouts. Although we may expect, the prices to retrace if it goes to the oversold or overbought region, the prices also can stay in the oversold or overbought region for an extended period. As such, traders should be wary of it and let the market saturate before making vital decisions.
Oasis Network (ROSE) Price Analysis – Moving Average
The Exponential Moving averages are quite similar to the simple moving averages (SMA). However, the SMA equally distributes down all values whereas the Exponential Moving Average gives more weightage to the current prices. Since SMA undermines the weightage of the present price, the EMA is used in price movements.
The 200-day MA is considered to be the long-term moving average while the 50-day MA is considered the short-term moving average in trading. Based on how these two lines behave, the strength of the cryptocurrency or the trend can be determined on average.
In particular, when the short-term moving average (50-day MA) approaches the long-term moving average (200-day MA) from below and crosses it, we call it a Golden Cross.
Contrastingly, when the short-term moving average crosses the long-term moving average from above then, a death cross occurs.
Usually, when a Golden Cross occurs, the prices of the cryptocurrency will shoot up drastically, but when there’s a Death Cross, the prices will crash.
Whenever the price of cryptocurrency is above the 50-day or 200-day MA, or above both we may say that the token is bullish (red rectangle). Contrastingly, if the token is below the 50-day or 200-day, or below both, then we could call it bearish (Green triangle section).
Unlike a conventional Golden Cross that produces a sudden spike, ROSE started crashing after the Golden Cross. As such, ROSE which was trading above both Moving Averages crashed below both Averages abruptly.
Currently, ROSE after being denied to be support by the 50-day MA resorted help from the 200-day MA. However, the bears were too strong, hence, the 200-day MA could not hold the prices of ROSE from falling. With no support, ROSE is now below the 200-day MA. However, just below the 200-day MA at $0.045, there seems to be a strong support for ROSE.
As such, ROSE may rely on that support for assistance before surging again. Nonetheless, with that being said, ROSE might not even need to reach that to surge as this area that which it fluctuates now produced a large rise in price in the past. Hence, ROSE could reciprocate that behavior and surge from where it is now.
Since the preceding two scenarios present an excellent entry point, buyers may need to watch the market before taking vital decisions.
Oasis Network (ROSE) Price Analysis – Rate of Change
The Rate of Change Indicator is a momentum oscillator, that measures the change of the current price against the past price a few (n) periods ago, in percentage. As long as the price is rising ROC will be positive. But, the ROC indicator will reach the negative zone when the prices reduce. Increasing values in either direction, positive or negative, indicate increasing momentum and moving back toward zero indicates diminishing momentum.
Moreover, the equation for ROC is as follows: ROC = [(Today’s Closing Price – Closing Price n periods ago) / Closing Price n periods ago] x 100.
Unlike the RSI, ROC has no set overbought or oversold regions, it rather depends on a trader’s discretion. Traders often tend to find the areas in the positive and negative zones where the trend changes have happened in regularity. Based on this they could mark their bounds for overbought and oversold regions.
ROC could also be used as a divergence indicator that signals a possible upcoming trend change. Divergence occurs when the price of a stock or asset moves in one direction while its ROC moves in the opposite direction.
For example, if a stock’s price is rising over a period of time and registering higher highs while the ROC is progressively moving lower, or making lower highs, then the ROC is indicating bearish divergence from price, which signals a possible trend change to the downside. The chart shows an example of the above scenario. The same concept applies if the price is moving down and ROC is moving higher.
Additionally, the zero line crossover could be used to signal trend changes. However, depending on the number used for n (periods) in the indicator the signals may come in early or late.
ROSE’s extremely overbought regions are marked as Overbought Region 1 at 41.58, Overbought Region 2 at 77.49, and Overbought Region 3 at 118.72. ROSE’s trend reversed many times after it reached the Overbought Region 1. Similarly, the ROSE’s Oversold Regions are marked with Oversold Region 1 at -40.87.
Currently, the ROC indicates a value of -21.29 and is placed in between Oversold Region 1 and the zero line. Since ROC is still heading towards the oversold region, we could expect it to reach Oversold Region 1 at -40.80 before the trend reverses.
Oasis Network (ROSE) Price Prediction 2023-2030 Overview
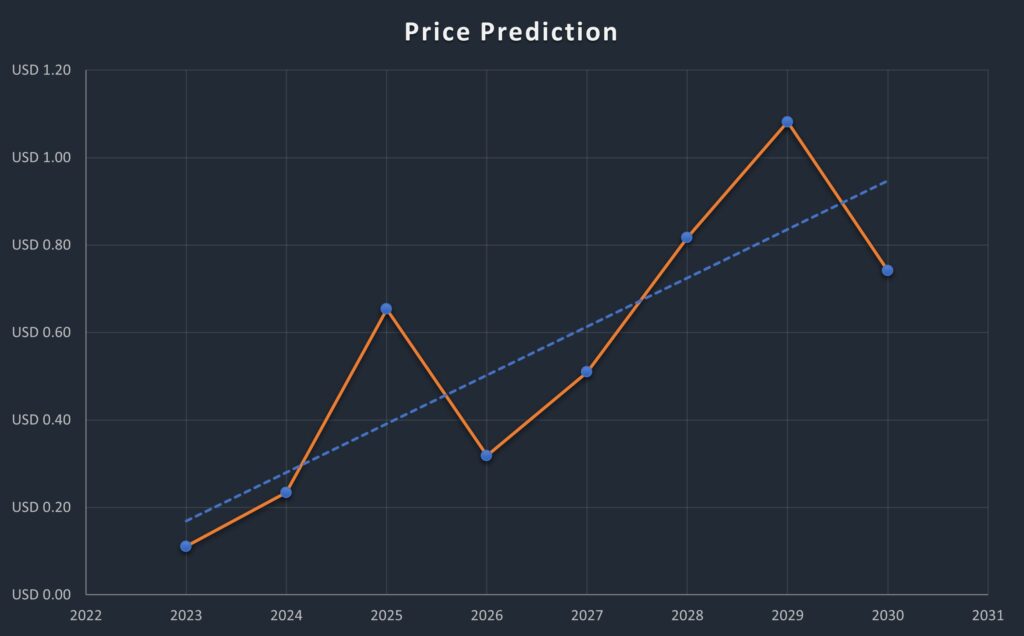
| Year | Minimum Price | Average Price | Maximum Price |
| 2023 | $0.1001 | $0.1105 | $0.1259 |
| 2024 | $0.1927 | $0.2339 | $0.2457 |
| 2025 | $0.5978 | $0.6531 | $0.6879 |
| 2026 | $0.3021 | $0.3181 | $0.3300 |
| 2027 | $0.4995 | $0.5097 | $0.5150 |
| 2028 | $0.7915 | $0.8172 | $0.8912 |
| 2029 | $0.9821 | $1.0817 | $1.1211 |
| 2030 | $0.6920 | $0.7418 | $0.7950 |
| 2040 | $1.958 | $2.0596 | $2.0912 |
| 2050 | $2.9150 | $3.1390 | $3.4120 |
Oasis Network (ROSE) Price Prediction 2023
When looking at the chart above we could see that ROSE formed the Adam and Eve pattern during March and April. Usually, after the formation of an Adam and Eve pattern, the price of ROSE is supposed to surge. More specifically, it should have tested the neckline (white dotted lines) and then surged. However, unlike a conventional Adam and Eve pattern, ROSE is falling and losing value.
Currently, ROSE is fluctuating in proximity which could catapult it to Resistance 2 at $0.1105. This thesis is based on its behavior in August 2022 as highlighted in the chart. However, ROSE will have some resistance at the neckline (white dotted line) and then at Resistance 1 before surging. Hence, these resistance levels may present an excellent entry point for buyers to cash in.
There is also another possibility where ROSE could hit Resistance 1 at $0.0857 and could be rejected, in this scenario, it may land in the price range where it stands as of present. As such Resistance 1 presents an opportunity for both buyers and sellers to profit from. Hence, traders should be on the lookout. Moreover, the upward trajectory could be confirmed with ROSE touching the lower Bollinger band. However, if the bears are strong, ROSE could land on Support 1 at $0.0339.
Oasis Network (ROSE) Price Prediction – Resistance and Support Levels
When looking at the chart above we can see that ROSE’s mirror image on the right was disrupted by the bear. When comparing the yellow highlighted rectangles on both sides we could see that the left side of ROSE tested Resistance 6 a couple of times while the right could not test resistance 6 even once.
Moreover, the blue rectangles on either side of the mirror also vary in pattern. The left side tested Resistance 5 once while the right side didn’t have the momentum to reach Resistance 5. Although both sides show a fall, the one on the left shows ROSE recovering while the one on the right shows ROSE falling apart.
The red rectangles show similar behavior on both sides for ROSE with the left side showing more bullishness while the right shows more consolidation. Finally, the grey rectangle shows a vast difference, which proves that the bears were in control. ROSE tested Resistance 3 on the left side while it could only test Resistance 1 on the right side.
Oasis Network (ROSE) Price Prediction 2024
There will be Bitcoin halving in 2024, and hence we should expect a positive trend in the market due to user sentiments and the quest by investors to accumulate more of the coin. Since the Bitcoin trend affects the direction of trade of other cryptocurrencies, we could expect ROSE to trade at a price not below $0.2339 by the end of 2024.
Oasis Network (ROSE) Price Prediction 2025
ROSE may still experience the after-effects of the Bitcoin halving and is expected to trade above its 2024 price. Many trade analysts speculate that BTC halving could create a huge impact on the crypto market. Moreover, similar to many altcoins, ROSE will continue to rise in 2025 forming new resistance levels. It is expected that ROSE would trade beyond the $0.6531 level.
Oasis Network (ROSE) Price Prediction 2026
It is expected that after a long period of bull run, the bears would come into power and start negatively impacting the cryptocurrencies. During this bearish sentiment, ROSE could tumble into its support regions. During this period of price correction, ROSE could lose momentum and be a little below its 2025 price. As such it could be trading at $0.3181 by 2026.
Oasis Network (ROSE) Price Prediction 2027
Naturally, traders expect a bullish market sentiment after the crypto industry was affected negatively by the bears’ claw. Moreover, the build-up to the next Bitcoin halving in 2028 could evoke excitement in traders. As such we could expect ROSE to trade at around $0.5097 by the end of 2027.
Oasis Network (ROSE) Price Prediction 2028
As the crypto community’s hope will be re-ignited looking forward to Bitcoin halving like many altcoins, ROSE will continue to form new higher highs and is expected to move in an upward trajectory. Hence, ROSE would be trading at $0.8172 after experiencing a massive surge by the end of 2028.
Oasis Network (ROSE) Price Prediction 2029
2029 is expected to be another bull run due to the aftermath of the BTC halving. However, traders speculate that the crypto market would gradually become stable by this year. In tandem with the stable market sentiment and the slight price surge expected after the aftermath, ROSE could be trading at $1.0817 by the end of 2029.
Oasis Network (ROSE) Price Prediction 2030
After witnessing a bullish run in the market, ROSE and many altcoins would show signs of consolidation and might trade sideways and move downwards for some time while experiencing minor spikes. Therefore, by the end of 2030, ROSE could be trading at $0.7418
Oasis Network (ROSE) Price Prediction 2040
The long-term forecast for ROSE indicates that this altcoin could reach a new all-time high(ATH). This would be one of the key moments as HODLERS may expect to sell some of their tokens at the ATH point.
If they start selling then ROSE could fall in value. It is expected that the average price of ROSE could reach $2.0596 by 2040.
Oasis Network (ROSE) Price Prediction 2050
The community believes that there will be widespread adoption of cryptocurrencies, which could maintain gradual bullish gains. By the end of 2050, if the bullish momentum is maintained, ROSE could hit $3.1390
Conclusion
If investors continue to show interest in ROSE and add these tokens to their portfolio, then, it could continue to rise up. ROSE bullish price prediction shows that it could reach the $0.1100 level.
FAQ
Oasis Network is privacy enabled scalable layer-1 project built on the Ethereum network. Oasis Network is at the forefront of ensuring that web3 succeeds and that decentralized finance (DEFI) applications can use its features to ensure privacy and scalability.
ROSE can be traded on many exchanges like Binance, KuCoin, Gate.io, Coinlist, and Bitfinex.
ROSE has a possibility of surpassing its present all-time high (ATH) price of $0.5964 in 2022.
ROSE is one of the few cryptocurrencies that has retained its bullish momentum in the past seven days. If this momentum is maintained, ROSE might reach $0.1100 soon after its breaks the Resistance 1 level.
ROSE has been one of the most suitable investments in the crypto space. Although it has been depreciating in value, we could expect it to rise exponentially when the bottom is reached. Hence, traders may be allured to invest in ROSE.
The present all-time low of ROSE is $0.03205 in 2020.
Ellen Patterson is the founder of Oasis Network.
The maximum supply of ROSE is 10,000,000,000 ROSE coins.
It was launched in 2020.
ROSE can be stored in a cold wallet, hot wallet, or exchange wallet.
ROSE price is expected to reach $0.11 by 2023.
ROSE is expected to reach $0.2339 by 2024.
ROSE is expected to reach $0.6531 by 2025.
ROSE is expected to reach $0.3181 by 2026.
ROSE is expected to reach $0.5097 by 2027.
ROSE is expected to reach $0.8172 by 2028.
ROSE is expected to reach $1.0817 by 2029.
ROSE is expected to reach $0.7418 by 2030.
ROSE is expected to reach $2.0596 by 2040.
ROSE is expected to reach $3.1390 by 2050.
Disclaimer: The views and opinions, as well as all the information shared in this price prediction, are published in good faith. Readers must do their research and due diligence. Any action taken by the reader is strictly at their own risk. Coin Edition and its affiliates will not be held liable for any direct or indirect damage or loss.
More Crypto Price Predictions:
- Golem (GLM) Price Prediction 2023-2030
- Helium (HNT) Price Prediction 2023-2030
- BinaryX (BNX) Price Prediction 2023-2030
- The Sandbox (SAND) Price Prediction 2023-2030
- Sweat Economy (SWEAT) Price Prediction 2023-2030
Disclaimer: The information presented in this article is for informational and educational purposes only. The article does not constitute financial advice or advice of any kind. Coin Edition is not responsible for any losses incurred as a result of the utilization of content, products, or services mentioned. Readers are advised to exercise caution before taking any action related to the company.


 price prediction. Oasis Network could be a good investment in 2023. Find out more about Oasis Network (ROSE) on CE.)