


- In the most recent hours, Cosmos’ value rose by 2.50% to $10.39.
- Technical indicators suggest that the ATOM market may see a bearish reversal if bulls do not continue to battle.
- During the upturn, ATOM prices find support at $10.00.
Since the bulls bucked the bear tide that had dragged ATOM prices to a low of $10.00, where it found support, Cosmos (ATOM) has been in an uptrend.
During the upturn, ATOM bulls managed to pull prices up by 2.50% to $10.39.
As a result of increased market activity, market capitalization and 24 hour trading volume both increased by 2.57% and 11.08%, respectively, to $2,979,015,103 and $115,296,326.

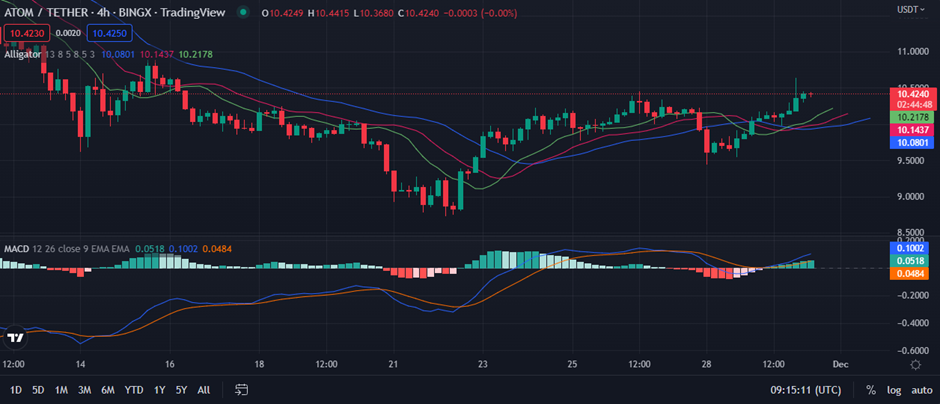
The three lines, according to the Williams alligator, are showing a positive trend as they are flowing upstream with an open mouth. The current trend in the Cosmos market will continue unless bears invalidate it because the green line is above the red line and the red line is above the blue line.
The red (teeth), blue (jaw), and green (lips) lines cross each other at 10.1437, 10.0801, and 10.2178, respectively. Price movement above the alligator’s mouth, a sign that bullish superiority will continue, supports this bull run.
This uptrend is supported by the MACD blue line’s ascent above the signal line, which has a reading of 0.1007 (positive). The positive trend of the histogram and MACD line, which support this rise, gives investors hope for a protracted bull run.
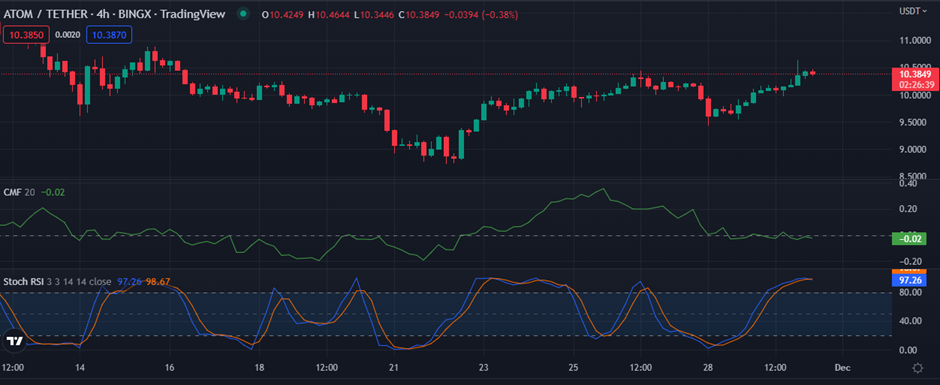
Investors are, however, troubled by the Chaikin Money Flow (CMF) motion, which is moving in the negative area with a reading of -0.02. This action by the CMF suggests that as bull power declines, bear power is growing.
Investors’ worries that the current bull run might not last, were further allayed by the stochastic RSI moving into the overbought zone with a value of 100.0. However, this does not necessarily indicate that a price reversal is about to take place, rather, it merely serves as a warning to traders to exercise caution in the near term.
If the bullish trend in the market is to continue, bulls must battle to keep the resistance level and prices afloat.
Disclaimer: The views and opinions, as well as all the information shared in this price analysis, are published in good faith. Readers must do their own research and due diligence. Any action taken by the reader is strictly at their own risk, Coin Edition and its affiliates will not be held liable for any direct or indirect damage or loss
Disclaimer: The information presented in this article is for informational and educational purposes only. The article does not constitute financial advice or advice of any kind. Coin Edition is not responsible for any losses incurred as a result of the utilization of content, products, or services mentioned. Readers are advised to exercise caution before taking any action related to the company.


Tokens Amid Price Rally")


