
 Price Drops by +7% as Bearish Sentiment Weighs")

- According to recent research, the SushiSwap market is dwindling.
- Bears capture the SUSHI market as bulls fail to overcome $1.37 resistance.
- Indicators point to a further drop in prices in the near future
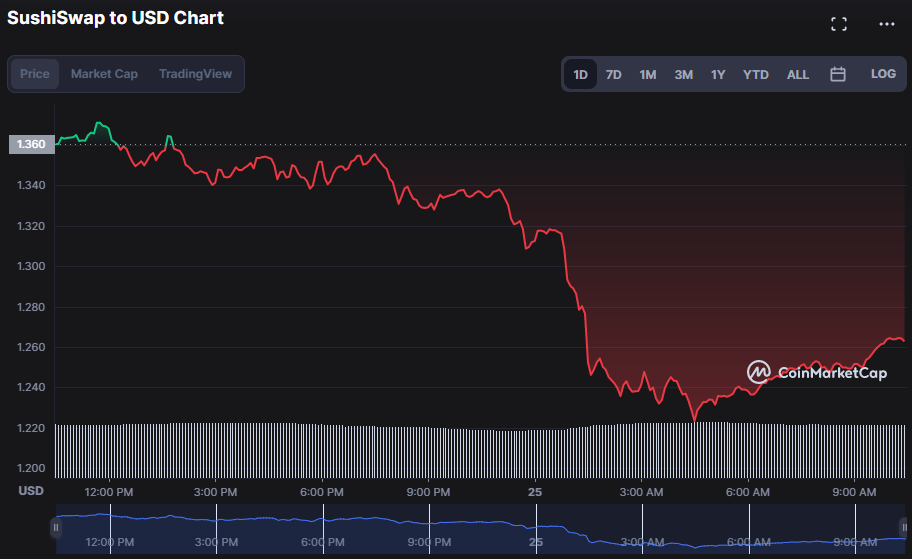
Bullish momentum in SushiSwap (SUSHI) faded at the start of the day after encountering resistance at $1.37. As a consequence of the bull’s reluctance to recover the market, bears hijacked the SUSHI market and successfully pulled price to an intra-day low of $1.22. As of press time, the market’s bearish sentiment had driven the price down to $1.26, a 7.42% drop.
During the downturn, the market capitalization plummeted by 7.28% to $281,244,653, indicating that a pessimistic mood was prevalent in the market; however, since the 24-hour trading has increased by 0.44% to $58,523,229, indicating that the market is recovering confidence and starting to become bullish. This shift in mood might be symbolic of a larger trend, and if the market continues to grow its 24-hour trading volume, it could be on track for a robust comeback.
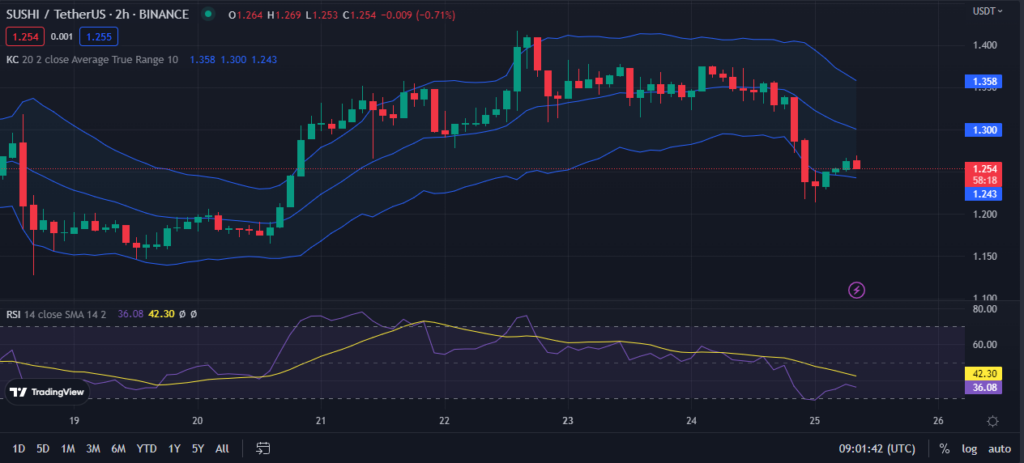
The Keltner Channel bands’ southern trend, with the top band at 1.358 and the bottom band at 1.244, suggests bear dominion is far from ended. Despite the increased 24-hour trade volume being promising, its surge may be due to investor speculation rather than market mood improvement. Hence since the Keltner Channel bands’ downward move implies that pessimistic sentiment is still prevalent, market recovery is uncertain.
This pessimistic feeling is bolstered by the fact that the RSI has fallen below its signal line with a reading of 36.61, suggesting that the bearish trend may be extended as the RSI approaches the oversold area. The bearish trend in the SUSHI market is anticipated to continue unless bulls intervene.
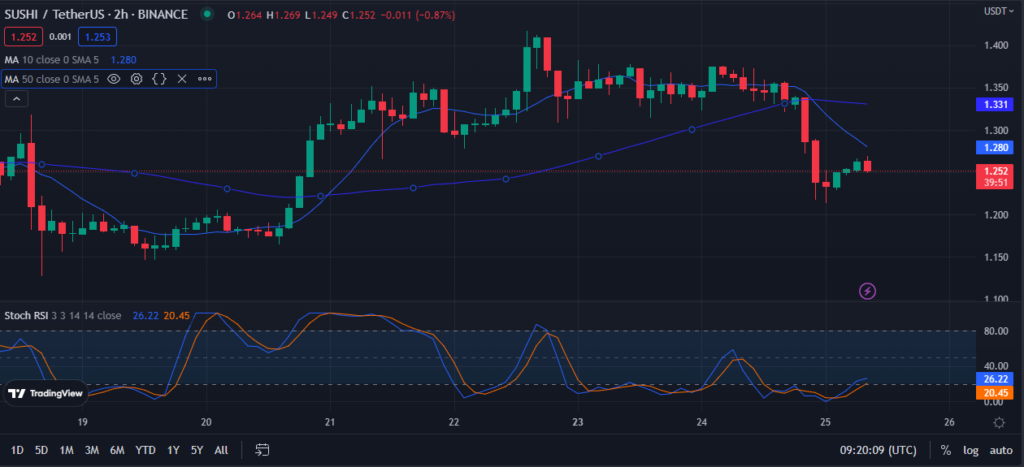
On the SUSHI price chart, the 10-day MA has crossed below the 50-day MA, indicating a bearish crossover. This movement is confirmed by 2-hour price chart readings of 1.331 and 1.280. This fluctuation indicates that selling pressure is outweighing purchasing demand, lending weight to the bear rule in the SUSHI market.
A score of 25.58 on the stochastic RSI indicates that the SushiSwap (SUSHI) market is oversold, reflecting the pessimistic mood in the market. However, the fact that it is heading upwards indicates that bulls are reviving, and that negative sentiment may be vanquished if they exert pressure.
If the negative momentum in SushiSwap is to be broken, bullish power must overcome the $1.37 resistance and raise prices higher.
Disclaimer: The views and opinions, as well as all the information shared in this price analysis, are published in good faith. Readers must do their own research and due diligence. Any action taken by the reader is strictly at their own risk. Coin Edition and its affiliates will not be held liable for any direct or indirect damage or loss
Disclaimer: The information presented in this article is for informational and educational purposes only. The article does not constitute financial advice or advice of any kind. Coin Edition is not responsible for any losses incurred as a result of the utilization of content, products, or services mentioned. Readers are advised to exercise caution before taking any action related to the company.


 Rockets 391% in 24 Hours, Scapesmania (MANIA) Also on the Rise")


