


- TRON’s bullish momentum continues with potential resistance at $0.06850 and $0.07000.
- Golden cross signal and RSI over 50 suggest a positive trend and buying pressure.
- Traders should be cautious of possible correction as stochastic RSI is overbought.
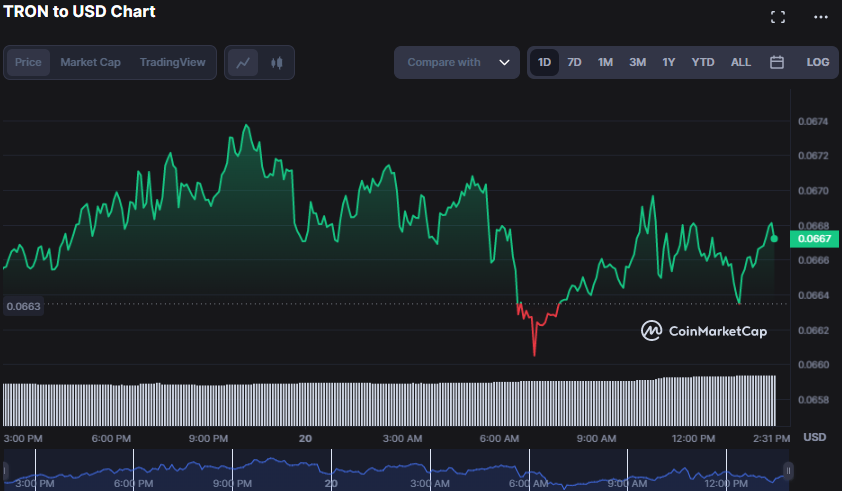
The TRON (TRX) market has seen a bullish reign in the previous 24 hours, with bulls able to rocket the price to a 24-hour high of $0.06738. The bears’ effort to gain market dominance was short-lived as the market found support around the intraday low of $0.06603. TRON was valued at $0.06677 at press time, a 0.53% gain from the intra-day low.
If bulls maintain market control, the $0.06738 resistance level may be broken, and the next resistance levels may be at $0.06850 and $0.07000. If bears gain control, the price may go below the intraday low of $0.06639 and test support levels of $0.06500 and $0.06350.
During the upturn, market capitalization, and 24-hour trading volume increased by 0.43% and 20.13%, respectively, to $6,091,663,130 and $268,527,456, respectively. This increase implies that investors are regaining confidence in the market and are willing to invest and sell at bigger volumes, providing an optimistic outlook for the market’s future.
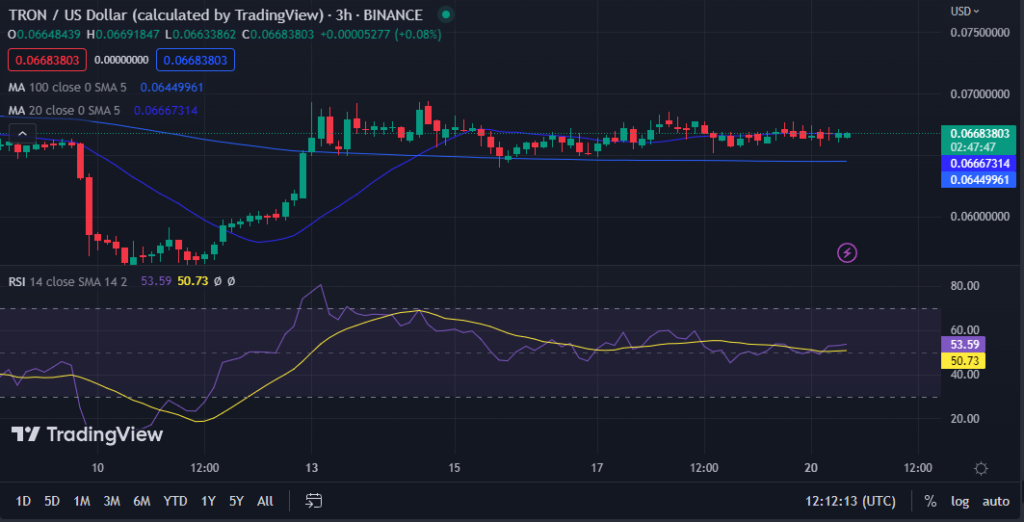
The shorter-term MA has crossed above the longer-term MA on the 3-hour price chart, indicating that TRON’s short-term momentum is stronger than its long-term momentum, indicating a likely positive trend soon. The 20-day MA is at 0.06669770, while the 100-day MA is at 0.06449150, reflecting the bullish perspective.
This move, a golden cross, in which the 20-day moving average crosses above the 100-day moving average, is a strong buying signal for traders and investors.
The Relative Strength Index (RSI) movement above its signal line, with a value of 52.57, supports this bullish perspective. This RSI level implies that TRX’s current bullishness may continue since the RSI is a momentum oscillator that analyzes the speed and change of price movements. A reading over 50 shows that buying pressure is more significant than selling pressure, which might lead to additional TRX price rises.
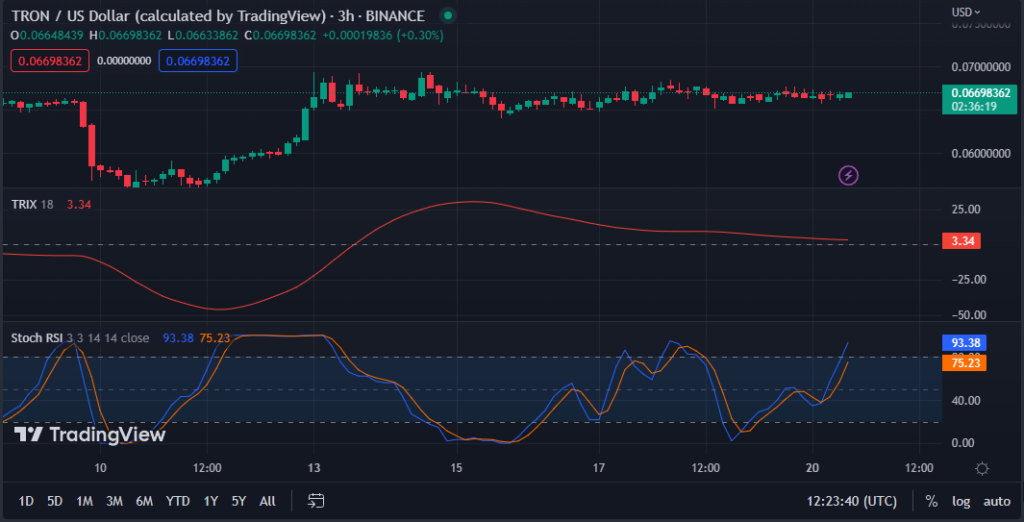
The positive momentum in the TRX market is showing no signs of slowing down, with a stochastic RSI value of 93.09 and continuing higher.
Nevertheless, the movement in the overbought area indicates that a correction is possible, and traders should proceed with care and consider taking gains before a potential retreat.
With a reading of 3.28, the TRIX is close to the “0” line, indicating that bullish momentum is still strong, but traders should keep an eye out for any signals of a trend reversal or a weakening of buying pressure.
Suppose the TRIX indicator goes below the “0” line, it may suggest a change in momentum toward bearishness, and traders should consider changing their holdings or employing risk management methods to safeguard their winnings.
TRON’s bullish reign continues as investors regain confidence, with a potential breakthrough of resistance levels, but traders should be cautious of a possible correction.
Disclaimer: The views, opinions, and information shared in this price prediction are published in good faith. Readers must do their research and due diligence. Any action taken by the reader is strictly at their own risk. Coin Edition and its affiliates will not be liable for direct or indirect damage or loss
Disclaimer: The information presented in this article is for informational and educational purposes only. The article does not constitute financial advice or advice of any kind. Coin Edition is not responsible for any losses incurred as a result of the utilization of content, products, or services mentioned. Readers are advised to exercise caution before taking any action related to the company.


Tokens Amid Price Rally")


 market sees a bullish reign with a potential resistance breakout, indicating positive momentum for investors. Read more on CE.)