


- XRP price analysis shows an uptrend
- XRP prices have sought support at $0.375
- Ripple had been moving within a range for some time before breaking down below the lower end of that range.
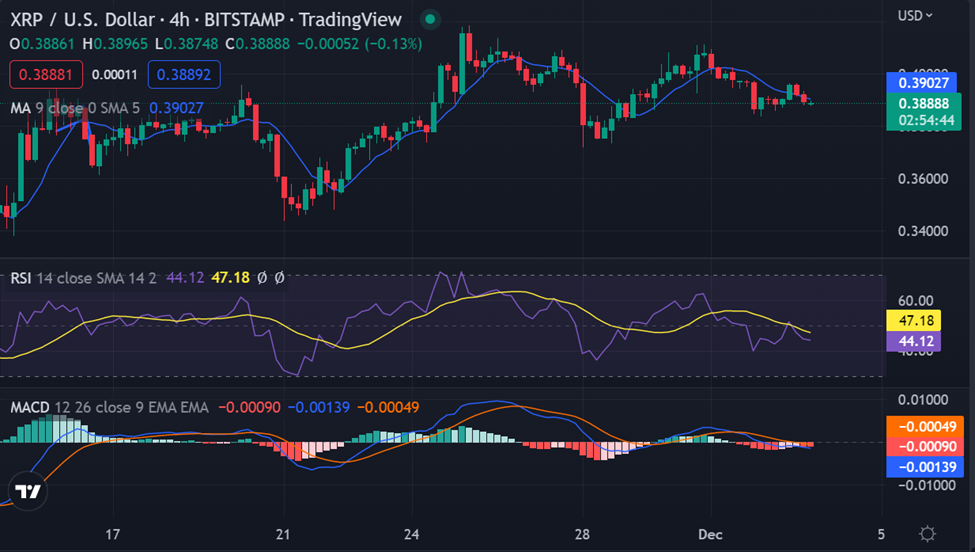
XRP price action indicates a sideways trading trend, with the recent decline in XRP prices, it is likely that the trend will continue to move lower. However, for this to happen, XRP must break below the $0.3400 support level and develop a bearish momentum pattern on its 4H time frame. In the event that such a price movement does occur and XRP breaks below $0.3400, then its likely that the price will move down to test the next support below at $0.3250 and possibly lower to as low as $0.2900 in a few weeks’ time.
However, if XRP prices manage to break above the 50-day SMA (Simple Moving Average), then we could expect a possible recovery to around $0.4300. But, this is less likely to happen and XRP/USD will instead move lower in the near term.
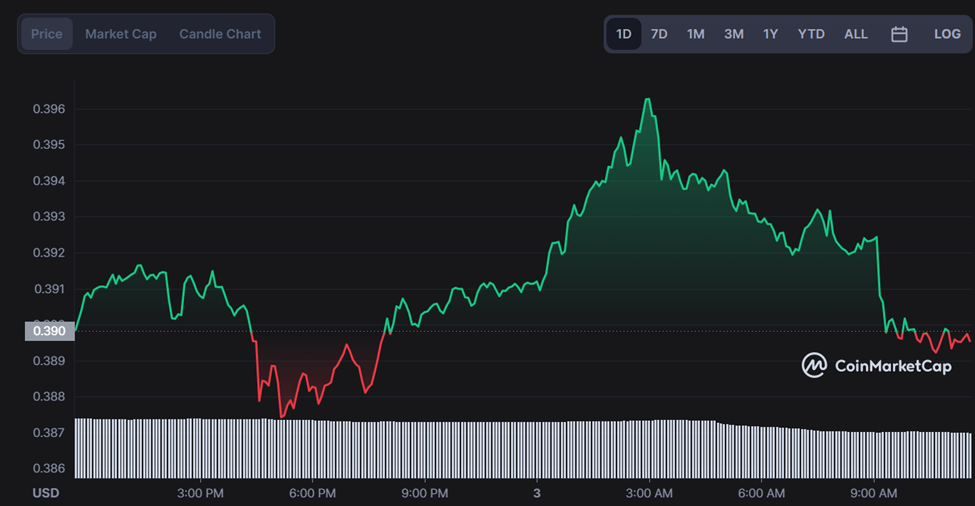
Ripple price analysis on a daily chart shows that Ripple opened the daily trading session in a massive bullish trend, with XRP prices sitting above the 50-day SMA. XRP/USD have broken above the $0.4400 resistance, but it soon started to pull back and retraced to as low as $0.3966 before finding support at $0.4000 and rebounding higher sharply in a massive bullish wave. XRP/USD prices had tested the $0.4400 resistance, which subsequently resulted in XRP/USD pulling back a little higher. Despite this pullback, Ripple was still managing to maintain the bullish momentum and its overall uptrend, but only for a short period of time as Ripple broke below its key support at $0.3900 and also below the 100-day simple moving average (SMA).
XRP/USD is currently declining, as it looks set to extend its decline lower. If Ripple continues falling in value, then XRP may test the $0.3400 support level and possibly move down to $0.3250 in the coming days. However, if XRP/USD manages to move back above the $0.4000 support level, it could attract more buyers moving forward and see its price action extend gains.
Ripple’s price has declined further below key support levels, but a fresh bullish wave may still develop in the near term. If this occurs, then Ripple would be likely to test the $0.4400 resistance level and possibly move up to $0.4800 in a few weeks’ time, but this is only possible if Ripple can break back above the 50-day SMA on its 4H time frame.
Disclaimer: The views and opinions, as well as all the information shared in this price analysis, are published in good faith. Readers must do their own research and due diligence. Any action taken by the reader is strictly at their own risk. Coin Edition and its affiliates will not be held liable for any direct or indirect damage or loss.
Disclaimer: The information presented in this article is for informational and educational purposes only. The article does not constitute financial advice or advice of any kind. Coin Edition is not responsible for any losses incurred as a result of the utilization of content, products, or services mentioned. Readers are advised to exercise caution before taking any action related to the company.


.)