
 Price Prediction 2025, 2026, 2027-2030")

Following a deep correction in early 2025, Arbitrum (ARB) is attempting to base out near $0.35 after bouncing from the $0.27–$0.30 accumulation range. With bullish divergences forming and technical resistance gradually weakening, ARB may be setting up for a medium-term breakout, with upside potential scaling through 2030.
ARB Price Trajectory (2025-2030)
Arbitrum (ARB) Price Prediction 2025
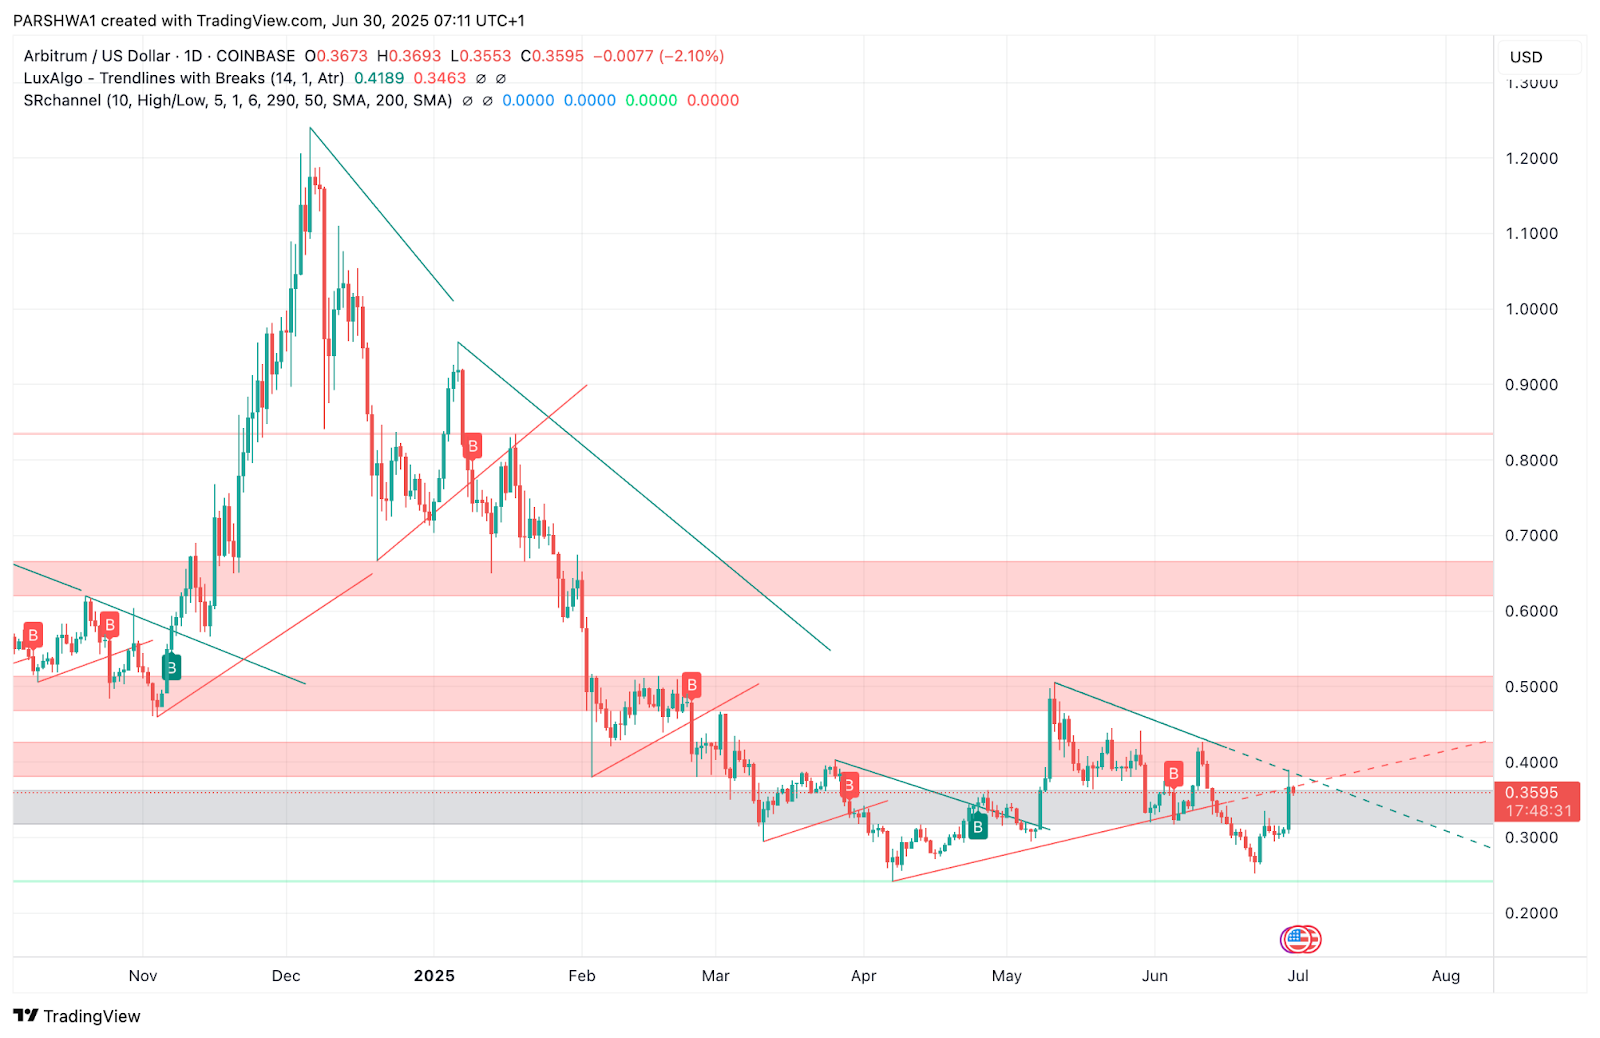
The ARB price today is trading around $0.359 after rebounding from a weak low near $0.275. On the daily chart, price has broken out from a small descending wedge but still faces overhead resistance near $0.40. The broader downtrend from the $1.20 high has been losing steam, with sell-side volume compressing and demand returning to key zones.
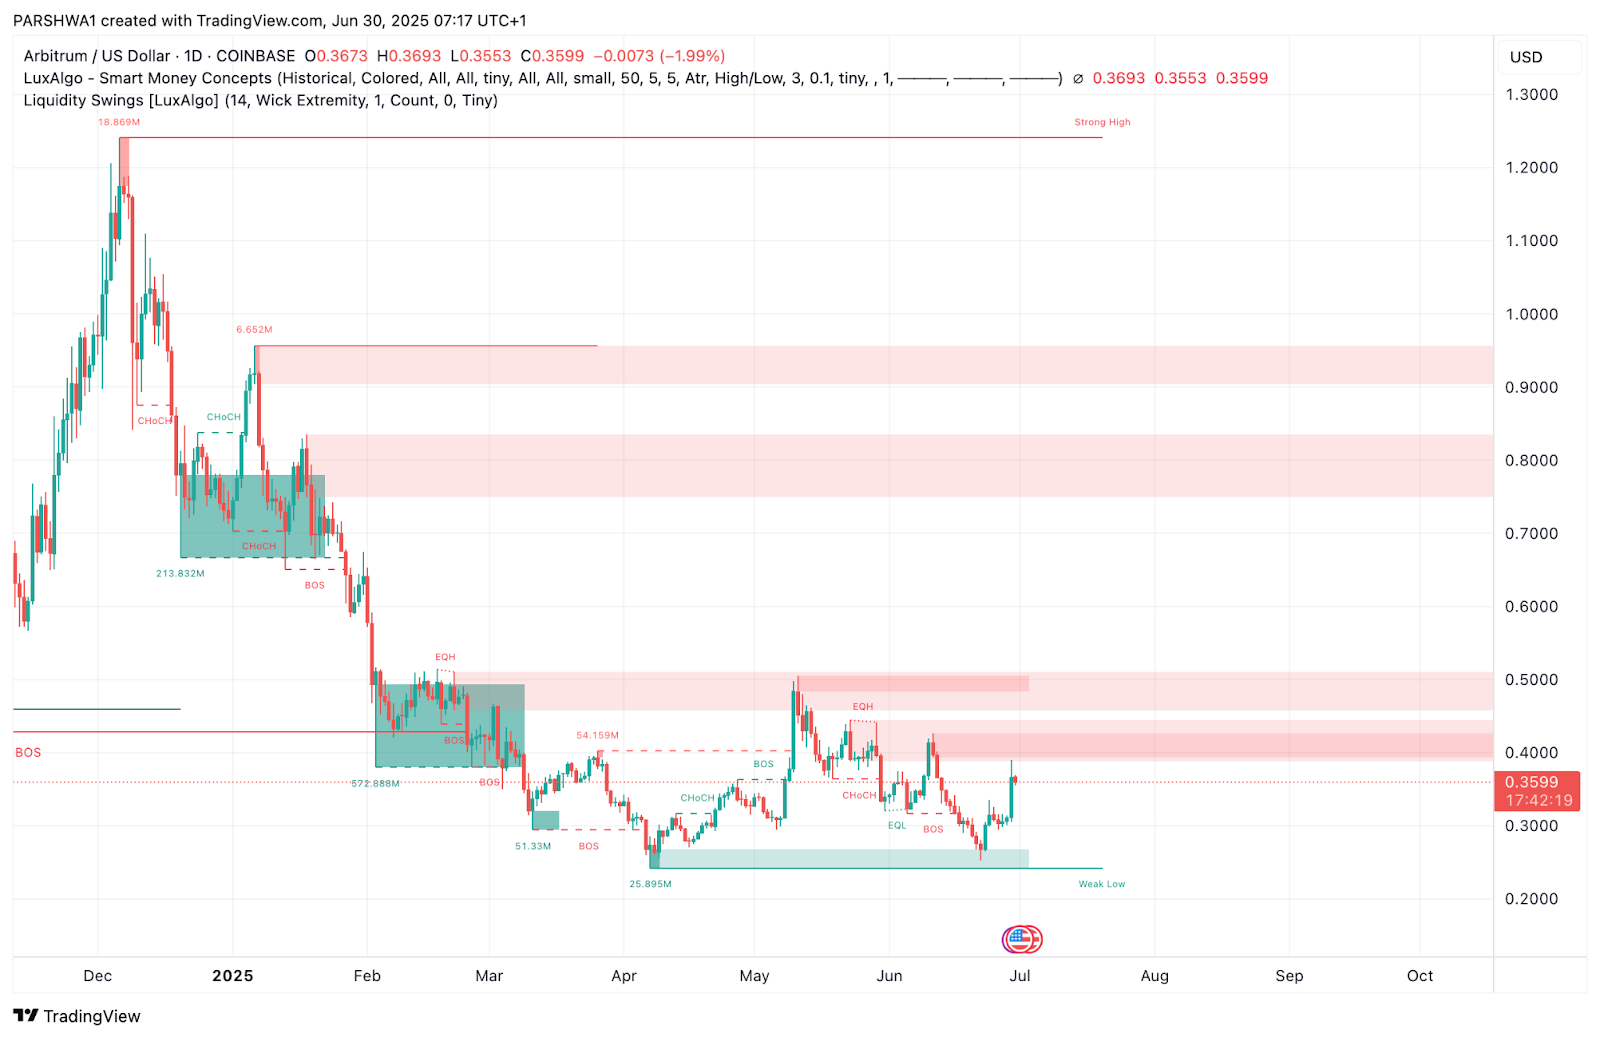
The $0.50–$0.54 range remains a key supply region, confirmed by Smart Money Concepts with multiple BOS (break of structure) and EQH (equal highs) formations. A sustained move above $0.418 could flip the bias bullish and open the door to $0.60 retests. However, bears are likely to defend the $0.45–$0.50 range heavily in the near term.
Price Indicators, Signals, Graphs and Charts (1y)
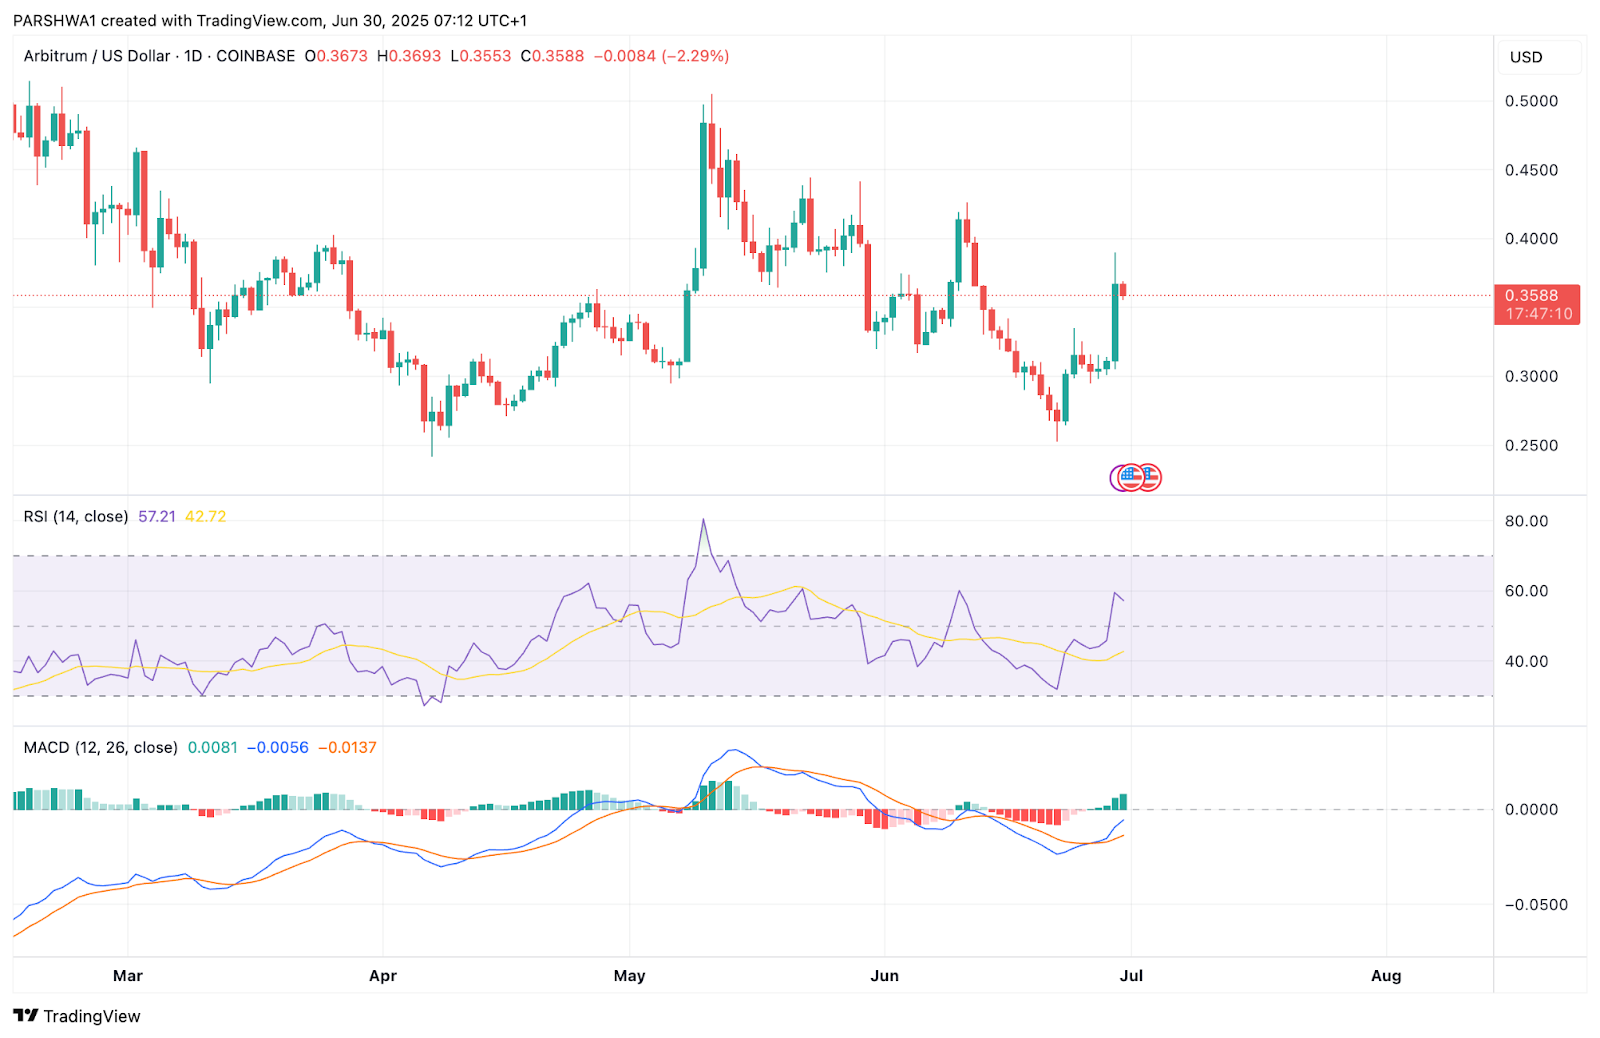
RSI on the daily chart has moved up to 57.2, suggesting growing bullish momentum as the market emerges from oversold territory. MACD lines have recently flipped bullish, with the histogram crossing above zero, pointing to a trend reversal in progress.
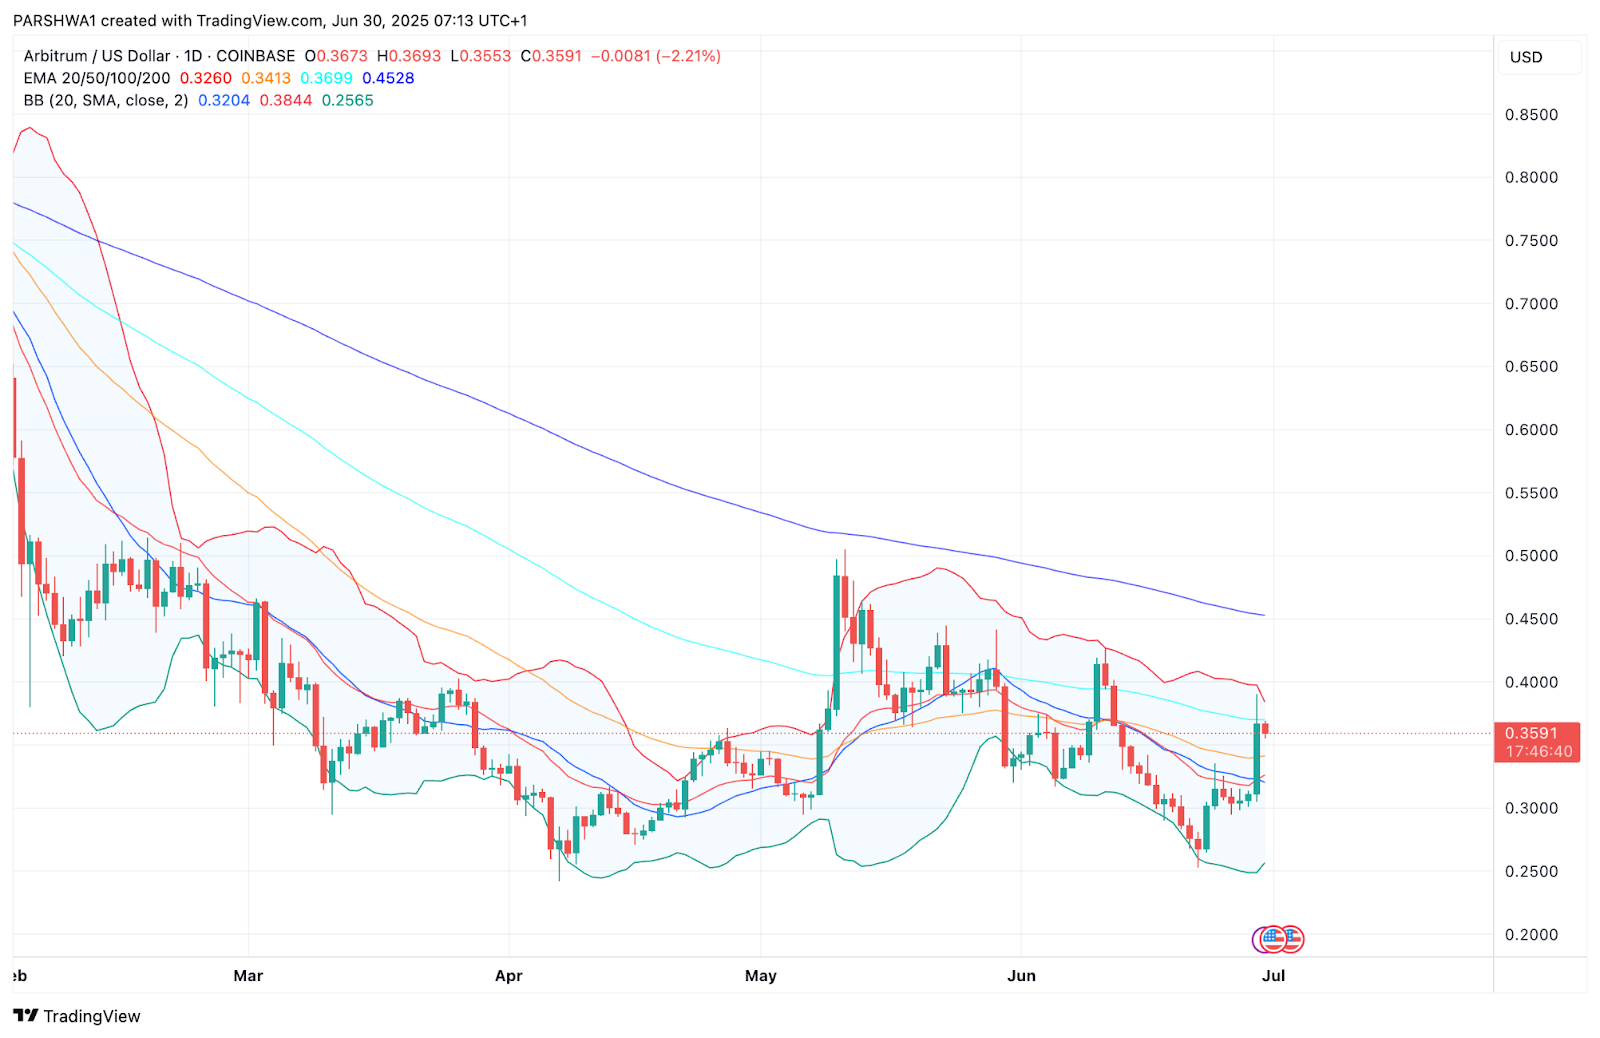
ARB is currently trading above the 20 EMA ($0.3260) and 50 EMA ($0.3413), while the 100 EMA at $0.3699 is being tested. The 200 EMA near $0.4528 serves as the longer-term resistance cap. Bollinger Bands are expanding, and price is pushing against the upper band, indicating a possible breakout attempt.
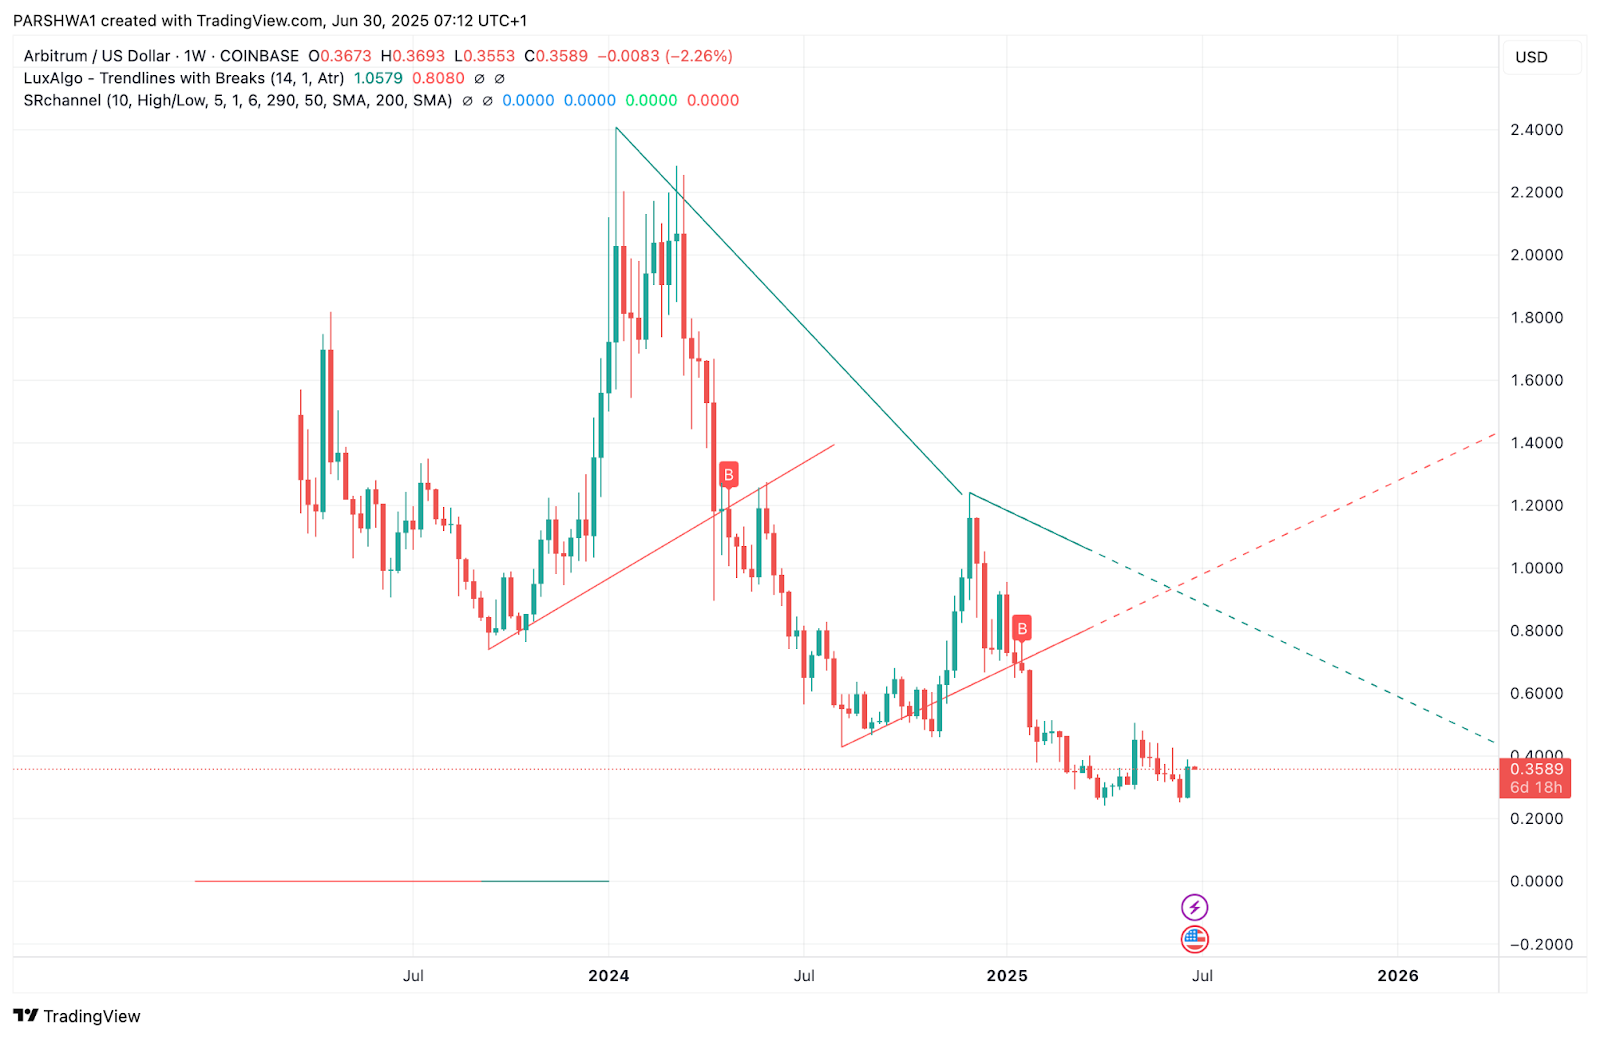
Trendline breaks are visible on both the daily and weekly timeframes. A macro falling wedge on the weekly chart signals potential for a bullish recovery if ARB reclaims $0.50 and sustains above the key BOS zone at $0.418.
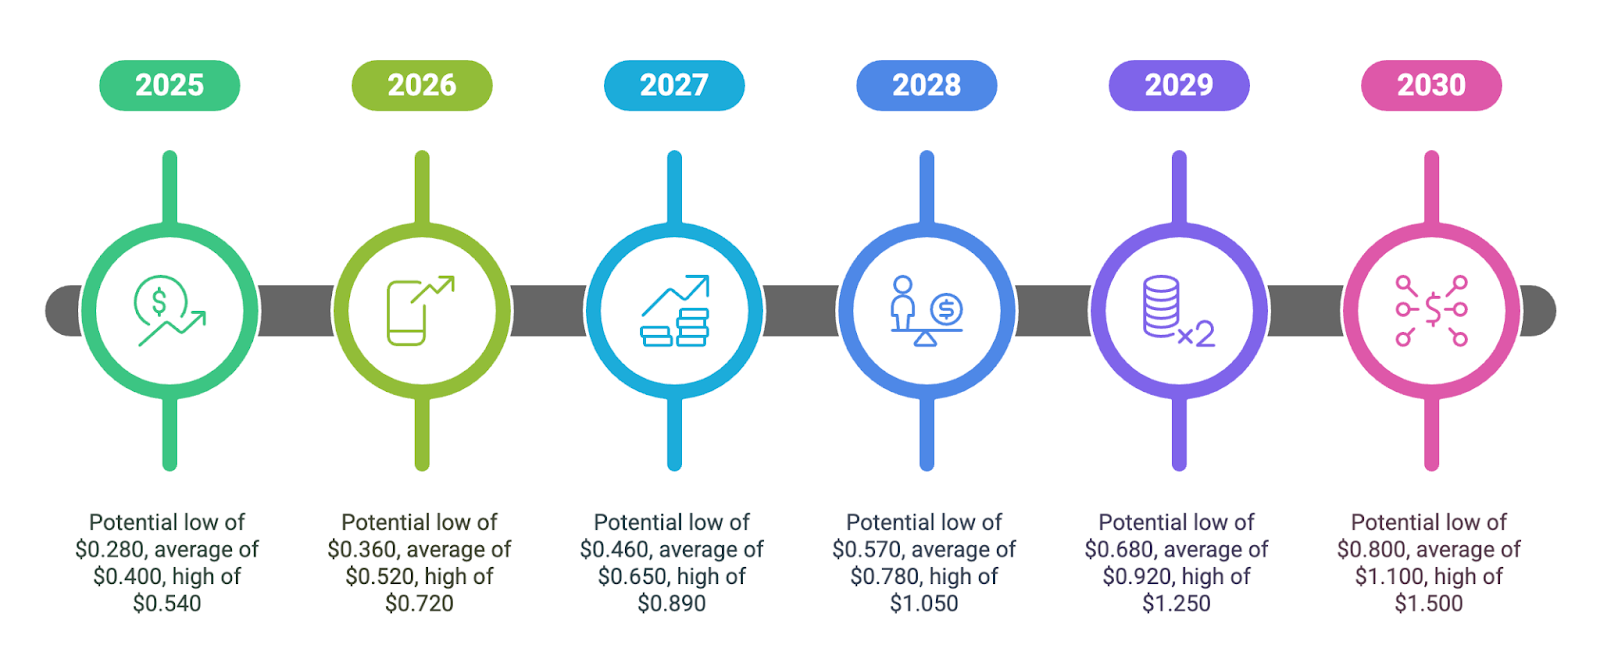
Arbitrum (ARB) Price Targets 2025–2030
| Year | Potential Low ($) | Potential Average ($) | Potential High ($) |
| 2025 | 0.280 | 0.400 | 0.540 |
| 2026 | 0.360 | 0.520 | 0.720 |
| 2027 | 0.460 | 0.650 | 0.890 |
| 2028 | 0.570 | 0.780 | 1.050 |
| 2029 | 0.680 | 0.920 | 1.250 |
| 2030 | 0.800 | 1.100 | 1.500 |
Arbitrum (ARB) Price Prediction 2026
By 2026, ARB could solidify its position above $0.50 if Layer-2 adoption accelerates. A bullish continuation beyond $0.60 may target $0.72, driven by increased usage, DApp volume, and reduced Ethereum congestion. Pullbacks toward $0.36 could still occur amid macro market risk or token unlocks.
Arbitrum (ARB) Price Prediction 2027
In 2027, Arbitrum may challenge the $0.90 mark if the ecosystem grows in parallel with Ethereum scaling improvements. Should price stabilize above $0.52, a breakout past prior structural resistance near $0.72 could signal trend acceleration toward $0.89. Strong support could form near $0.46.
Arbitrum (ARB) Price Prediction 2028
By 2028, Arbitrum may benefit from institutional traction and greater on-chain utility. With broader crypto recovery expected in late-cycle trends, ARB could retest $1.05. Average levels may hover around $0.78, supported by expanding TVL and steady user growth. Higher lows above $0.57 would be key.
Arbitrum (ARB) Price Prediction 2029
In 2029, Arbitrum could approach price discovery again if it becomes a leading L2 hub. Bullish cycles may propel the asset to highs near $1.25. However, the price must hold above $0.68 to preserve long-term structure, especially in the event of Ethereum upgrades or rollup integrations.
Arbitrum (ARB) Price Prediction 2030
Looking to 2030, Arbitrum’s value could reflect Layer-2 network dominance, potentially reaching $1.50 or more. If usage metrics, validator decentralization, and interoperability improve, ARB may trade steadily above $1.10. Price volatility could remain high, but overall trajectory favors upside beyond $0.80.
Conclusion
Arbitrum’s technical structure for 2025 shows tentative recovery signs as trendlines break and RSI strengthens. Price action near $0.40–$0.50 will be pivotal in confirming long-term reversal. If ARB reclaims key demand and continues to attract ecosystem development, the token may steadily rise through 2030 with structural support forming near $0.30 and $0.50. Investors should monitor EMA clusters and smart money shifts for confirmation of momentum.
Disclaimer: The information presented in this article is for informational and educational purposes only. The article does not constitute financial advice or advice of any kind. Coin Edition is not responsible for any losses incurred as a result of the utilization of content, products, or services mentioned. Readers are advised to exercise caution before taking any action related to the company.

 Price Prediction 2025, 2026, 2027-2030")
 Price Prediction for July 5")
 Price Prediction for July 5")
 Price Prediction for July 5")
