
 Price Prediction 2025, 2026, 2027, 2028–2030")

ARPA Chain is showing signs of structural change following a strong move off support near $0.017. After weeks of consolidation, the price spiked toward $0.025 on July 2 before retracing slightly. This sharp upside shift has drawn attention to key indicator reversals and breakout patterns that could define ARPA’s multi-year path. As demand for privacy-preserving computation grows, ARPA may be preparing for a slow but steady market recovery.
ARPA (ARPA) Price Prediction 2025
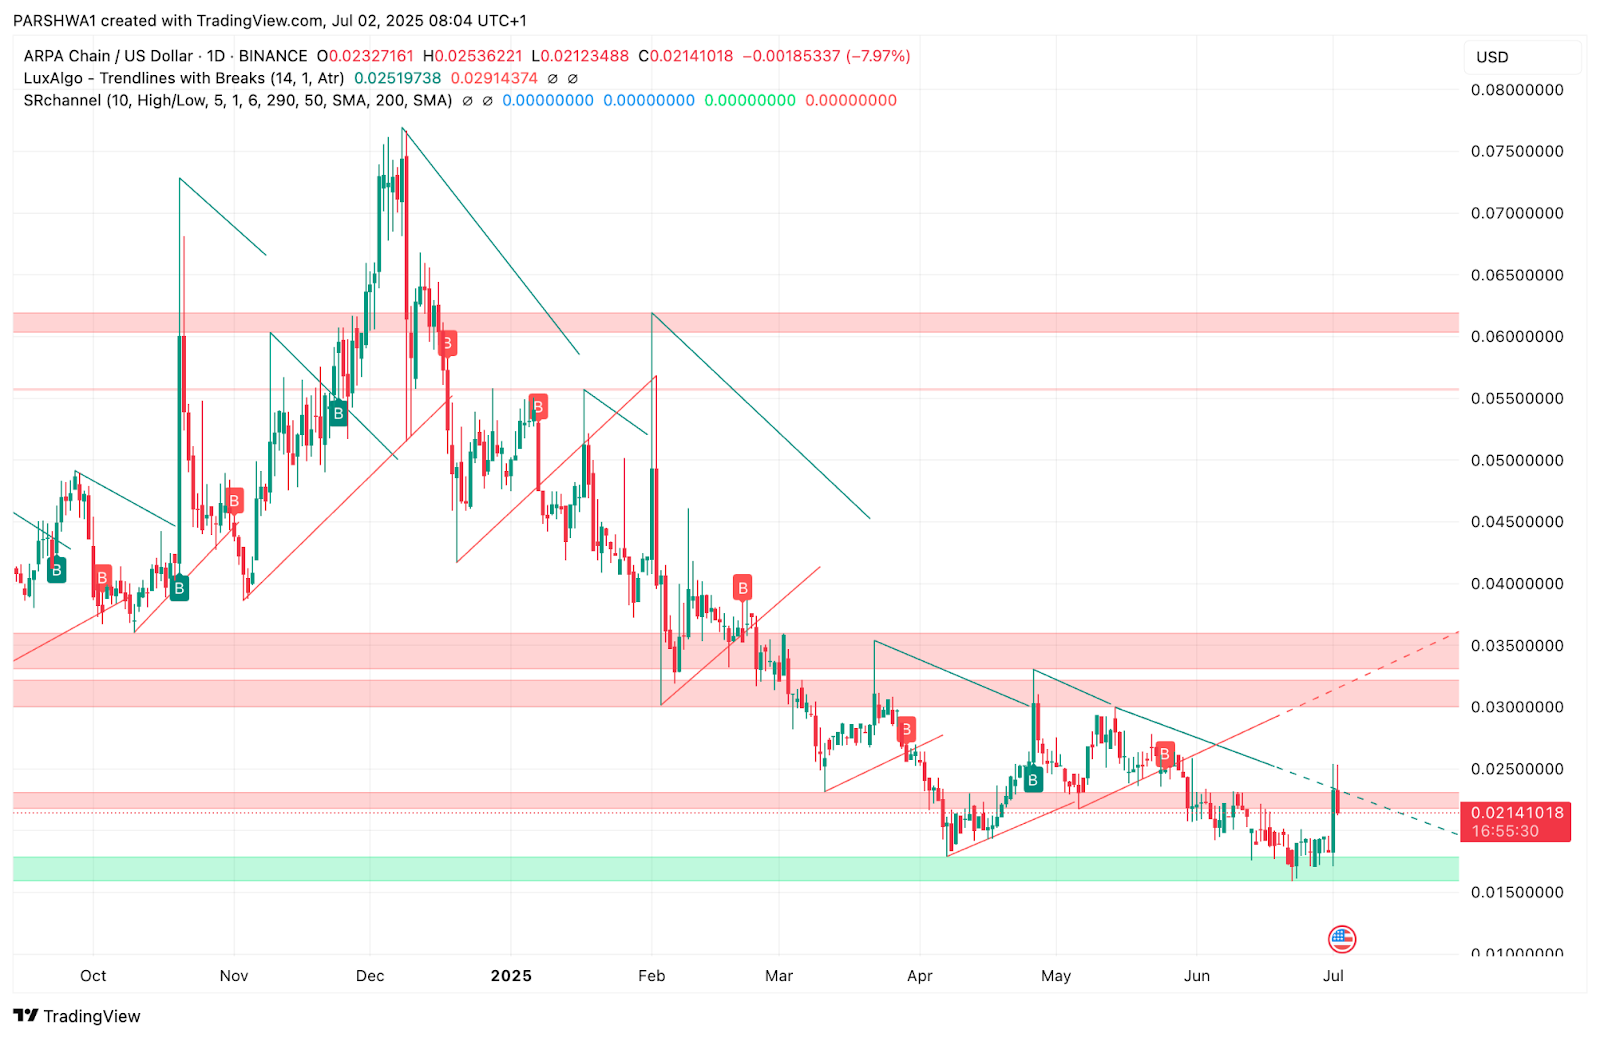
The ARPA price today is around $0.021, having cooled off after briefly surging toward $0.025. The rally was triggered by a clean break of structure (BOS) and reclaim of the $0.020–$0.022 demand zone, following a sweep of liquidity beneath the $0.017 low. This bullish shift aligns with a potential trend reversal pattern forming across higher timeframes.
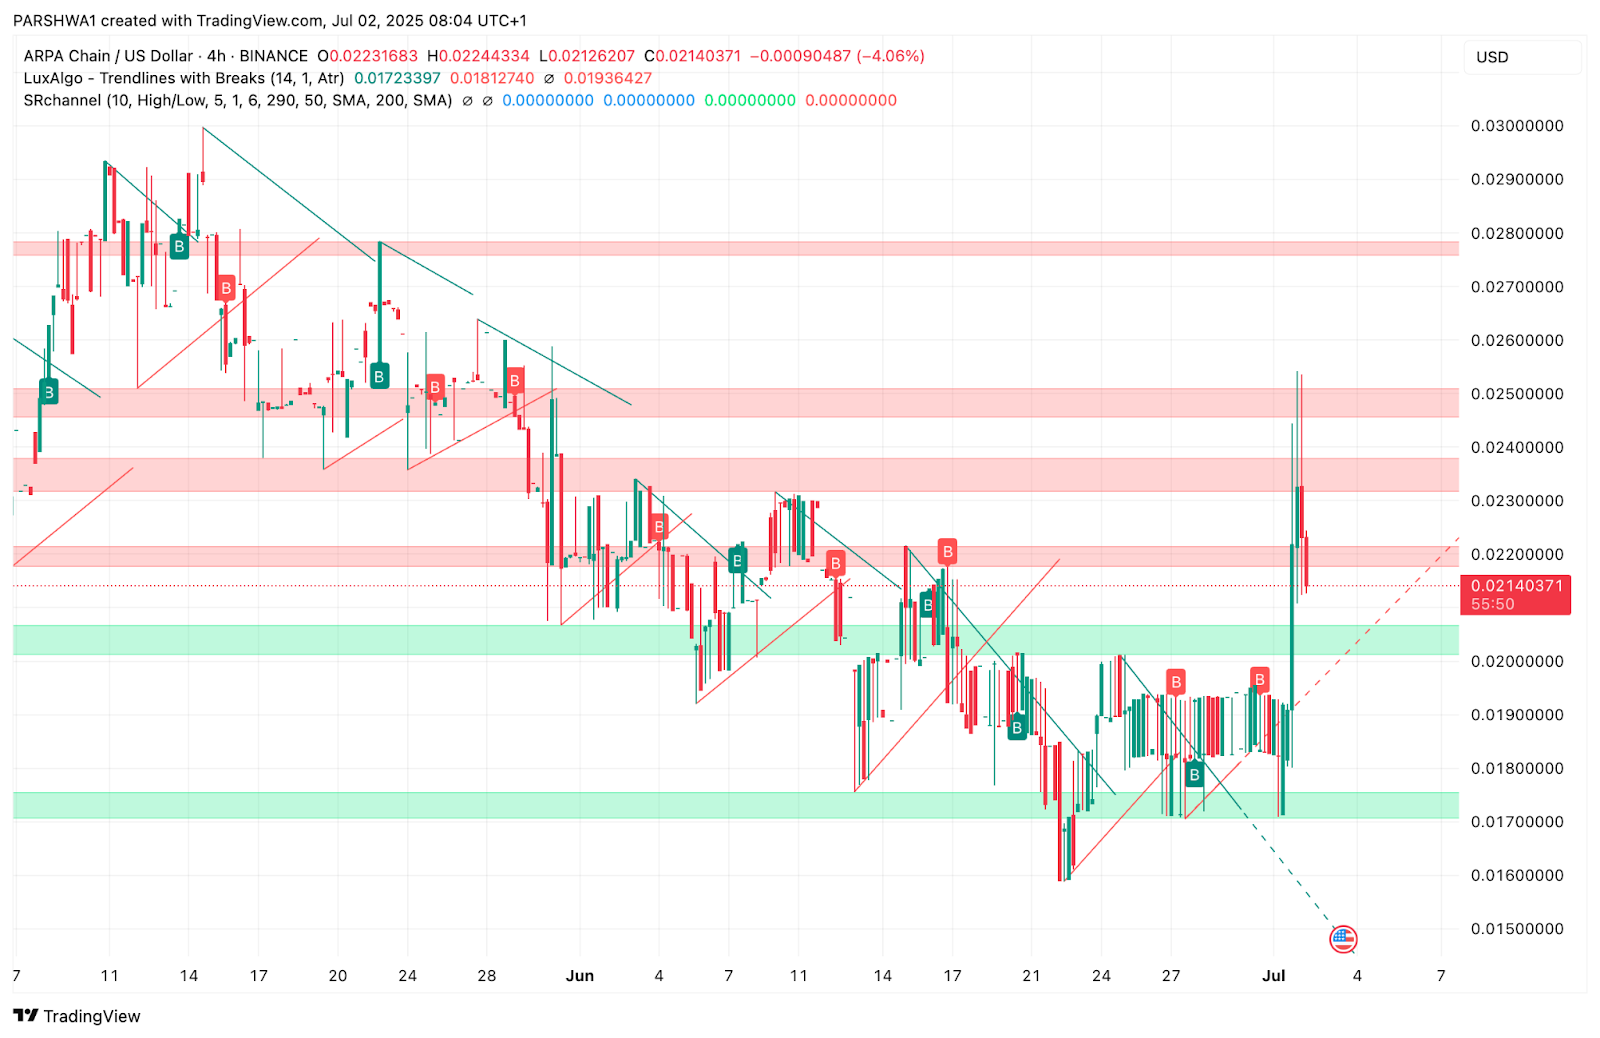
Price action on the 4-hour chart shows ARPA breaking multiple descending trendlines, and tapping into a lower block of previously unfilled supply. Although rejection near $0.025 has paused the advance, bulls now have clear support zones to defend. If $0.020 holds as a base, ARPA may attempt another leg up toward $0.028–$0.030 by year-end.
ARPA Price Indicators, Signals and Charts (1Y)

ARPA is showing early signs of accumulation based on multiple daily chart indicators. The supertrend, which has remained bearish since Q1 2025, is now beginning to flatten out. If price closes decisively above the $0.024 zone, it may trigger the first trend reversal signal in several months. At the same time, the Parabolic SAR has flipped below the candles for the first time since early May, reflecting a notable shift in short-term market momentum after over 45 days of pressure.
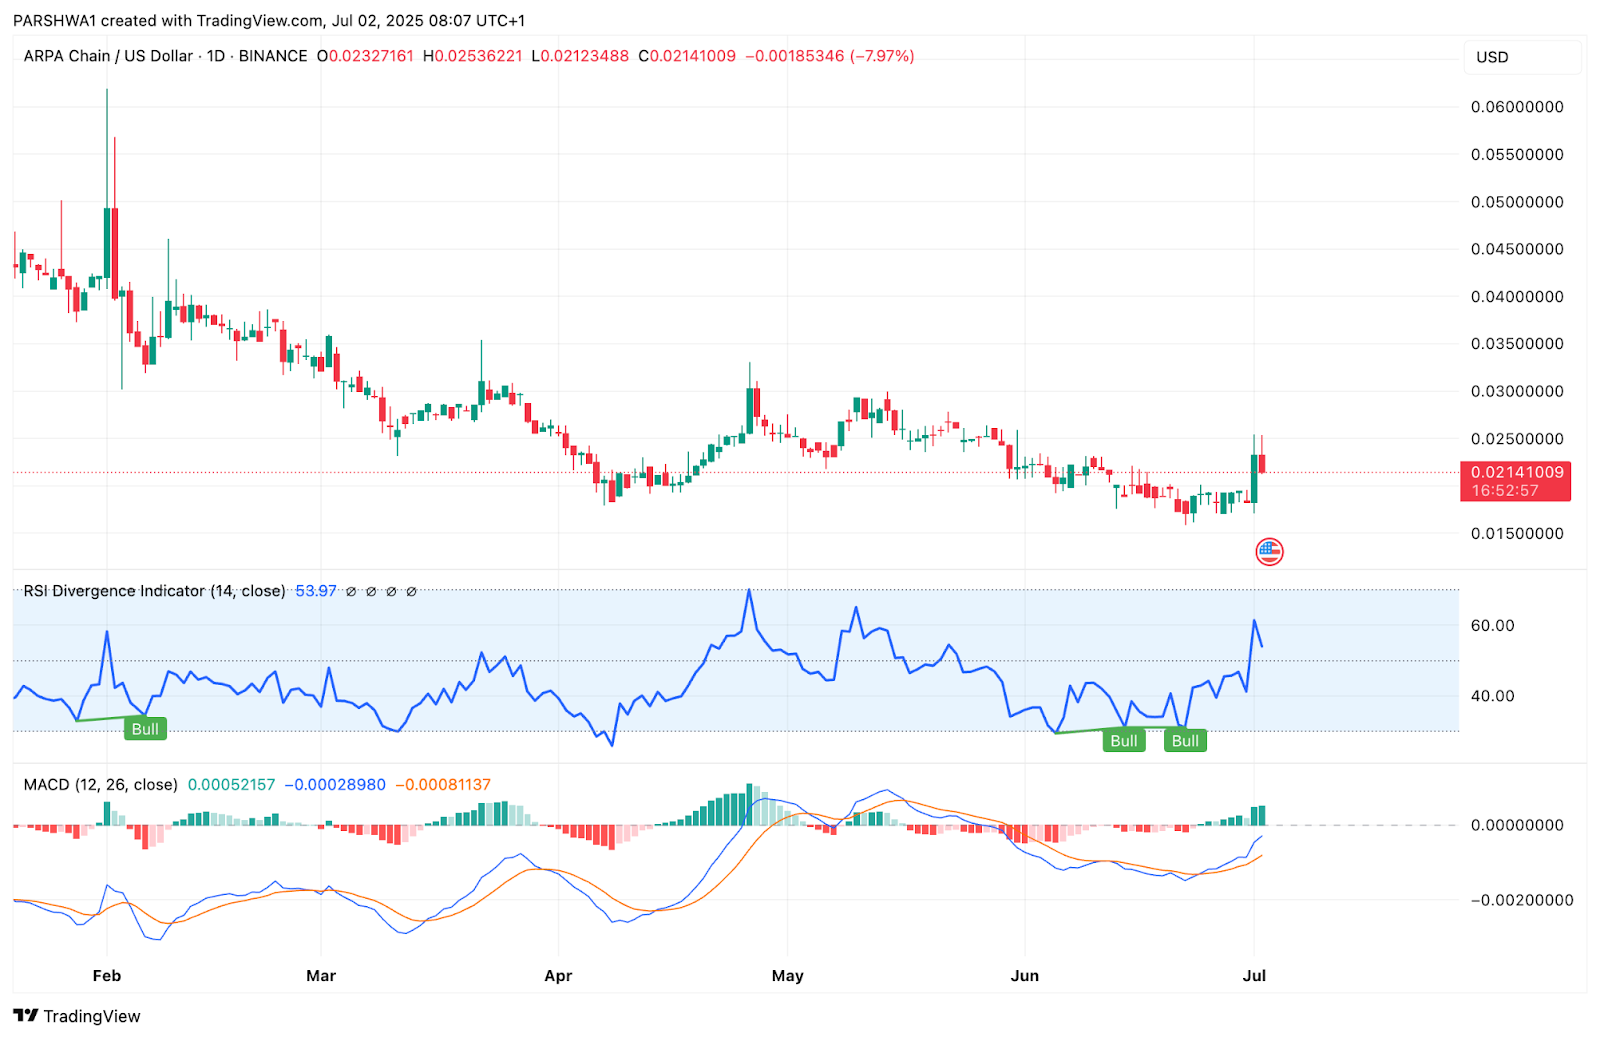
Momentum indicators are also aligning with the breakout. The MACD on the daily chart has produced a fresh bullish crossover, with the signal line turning upward and the histogram flipping green — a pattern typically observed at the early stages of recovery phases. Meanwhile, the RSI has crossed above the 53 mark, moving out of neutral territory and into bullish alignment, suggesting that strength is returning to the underlying trend.
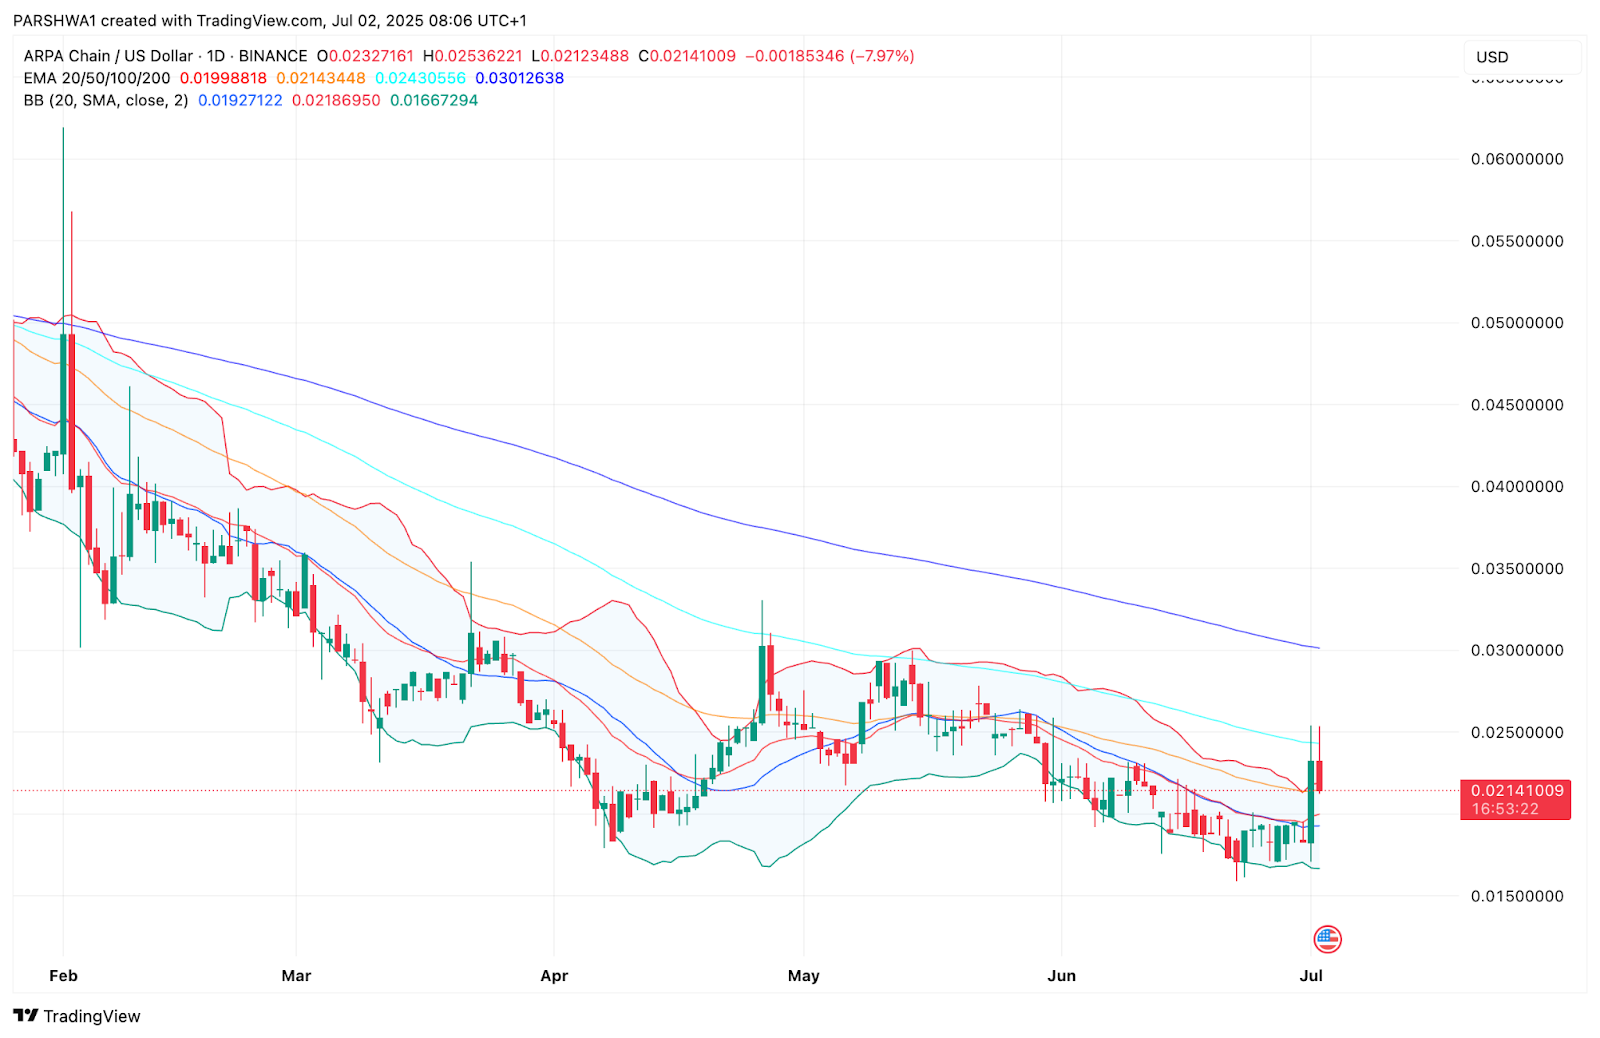
Volatility dynamics also point to a change in structure. The Bollinger Bands, which had tightened throughout June, are now beginning to expand, often a precursor to directional movement. The daily candle on July 1 closed above the midline of the band for the first time in weeks, supporting the idea that volatility is breaking upward.
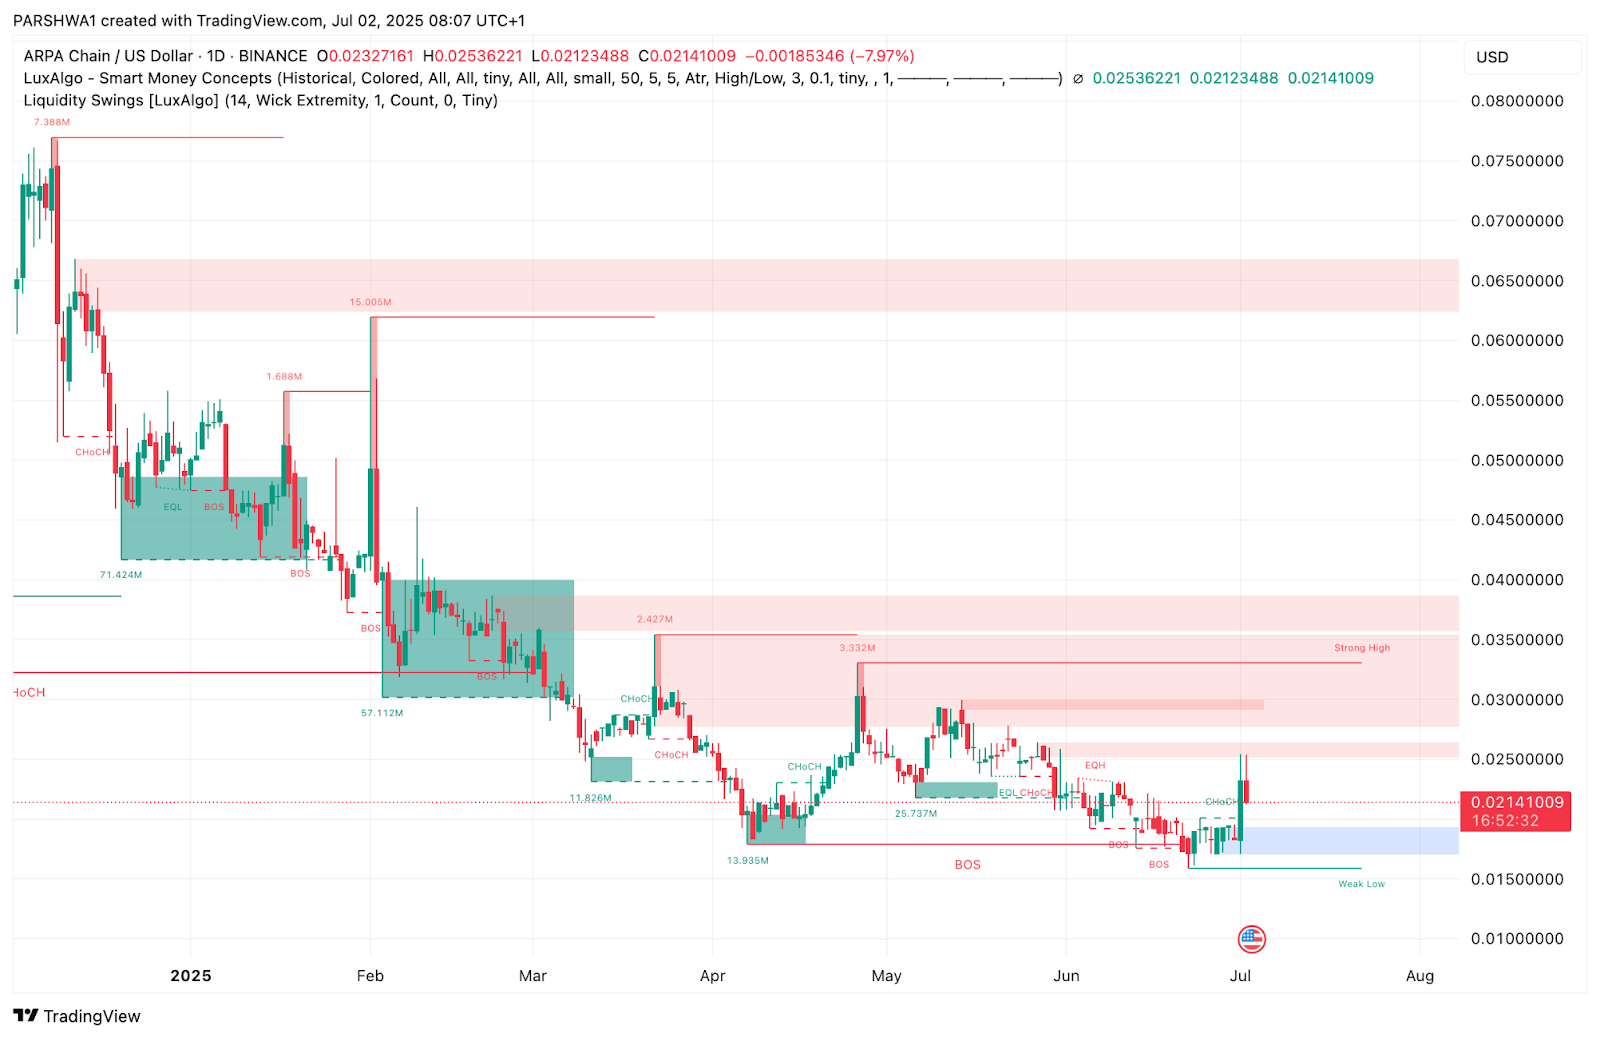
From a structural and liquidity standpoint, the Smart Money Concepts (SMC) chart confirms a major shift. A clean CHoCH (Change of Character) was followed by a BOS (Break of Structure), breaking above lower timeframe resistance and reclaiming the $0.019–$0.021 imbalance zone. Price is now approaching the overhead supply zone between $0.024 and $0.028. This confluence of breakout patterns and indicator shifts presents a constructive outlook for ARPA heading further into the second half of 2025.
ARPA (ARPA) Price Targets 2025–2030
| Year | Potential Low ($) | Potential Average ($) | Potential High ($) |
| 2025 | 0.017 | 0.023 | 0.030 |
| 2026 | 0.020 | 0.030 | 0.042 |
| 2027 | 0.024 | 0.036 | 0.050 |
| 2028 | 0.028 | 0.045 | 0.060 |
| 2029 | 0.035 | 0.054 | 0.072 |
| 2030 | 0.042 | 0.062 | 0.085 |
ARPA (ARPA) Price Prediction 2026
In 2026, if ARPA builds on its privacy-preserving multiparty computation use case, price may gain broader investor confidence. A flip of the 100 EMA on the daily near $0.0243 would confirm trend expansion. If the supertrend holds bullish and SAR stays below price, the $0.042 level becomes a realistic upside target. Long-term support could settle between $0.020 and $0.022.
ARPA (ARPA) Price Prediction 2027
By 2027, ARPA may benefit from deepened adoption in secure data-sharing across enterprise networks. With price structure likely forming higher lows above $0.030, sustained EMA alignment and MACD momentum may fuel a rise toward $0.050. RSI stability above 55–60 would likely support this uptrend.
ARPA (ARPA) Price Prediction 2028
2028 could mark a period of broader mainstream interest in blockchain privacy tools. If the Bollinger Bands continue to expand with high-volume follow-through, ARPA may trade comfortably within the $0.045–$0.060 range. MACD continuation and trend-following signals like SAR and supertrend will guide institutional positioning.
ARPA (ARPA) Price Prediction 2029
In 2029, price may attempt a mid-cycle peak toward $0.072 as the token reaches structural maturity. If Smart Money Concepts charts continue to show BOS patterns with rising volume, ARPA could outperform the altcoin market average. Key higher timeframe support may be found near $0.035–$0.038.
ARPA (ARPA) Price Prediction 2030
By 2030, a fully matured ARPA network with real-world enterprise integrations could see price discovery zones near $0.085. Should the market remain risk-on and privacy protocols receive institutional recognition, a higher average of $0.062 is achievable, with short-term spikes breaching $0.08.
Conclusion
ARPA Chain has entered a pivotal phase, with indicators flashing early reversal signals across daily and 4H timeframes. With Parabolic SAR, supertrend, MACD, and RSI now turning positive, the technical foundation for long-term growth is strengthening. The reclaim of $0.020 support and structural BOS marks the beginning of a new trend cycle. If ARPA maintains key levels and clears $0.025 decisively, the path toward $0.030 and beyond may open steadily through 2025–2030.
Disclaimer: The information presented in this article is for informational and educational purposes only. The article does not constitute financial advice or advice of any kind. Coin Edition is not responsible for any losses incurred as a result of the utilization of content, products, or services mentioned. Readers are advised to exercise caution before taking any action related to the company.
 Price Prediction 2025, 2026, 2027, 2028-2030")
 Price Prediction for July 3")

 Price Prediction for July 3")
 Price Prediction for July 3")
