


- Bitcoin reclaims $100K, facing strong resistance at $102K – $108K, with key support at $91K – $89K.
- Momentum indicators remain mixed, with RSI near 44 and MACD showing signs of slowing bearish pressure.
- A breakout above $109K could confirm a bullish continuation, while losing $100K may lead to a retracement toward $93K – $89K.
Bitcoin (BTC) has surged past the $100,000 mark, hitting a key psychological level in the period of ongoing volatility. The cryptocurrency recently traded between $96,000 and $97,000, facing multiple rejections at resistance levels. While sentiment remains cautiously optimistic, BTC must sustain this momentum to confirm a bullish breakout.
Technical Analysis: Bitcoin Tests $100K Resistance, Support at $91K
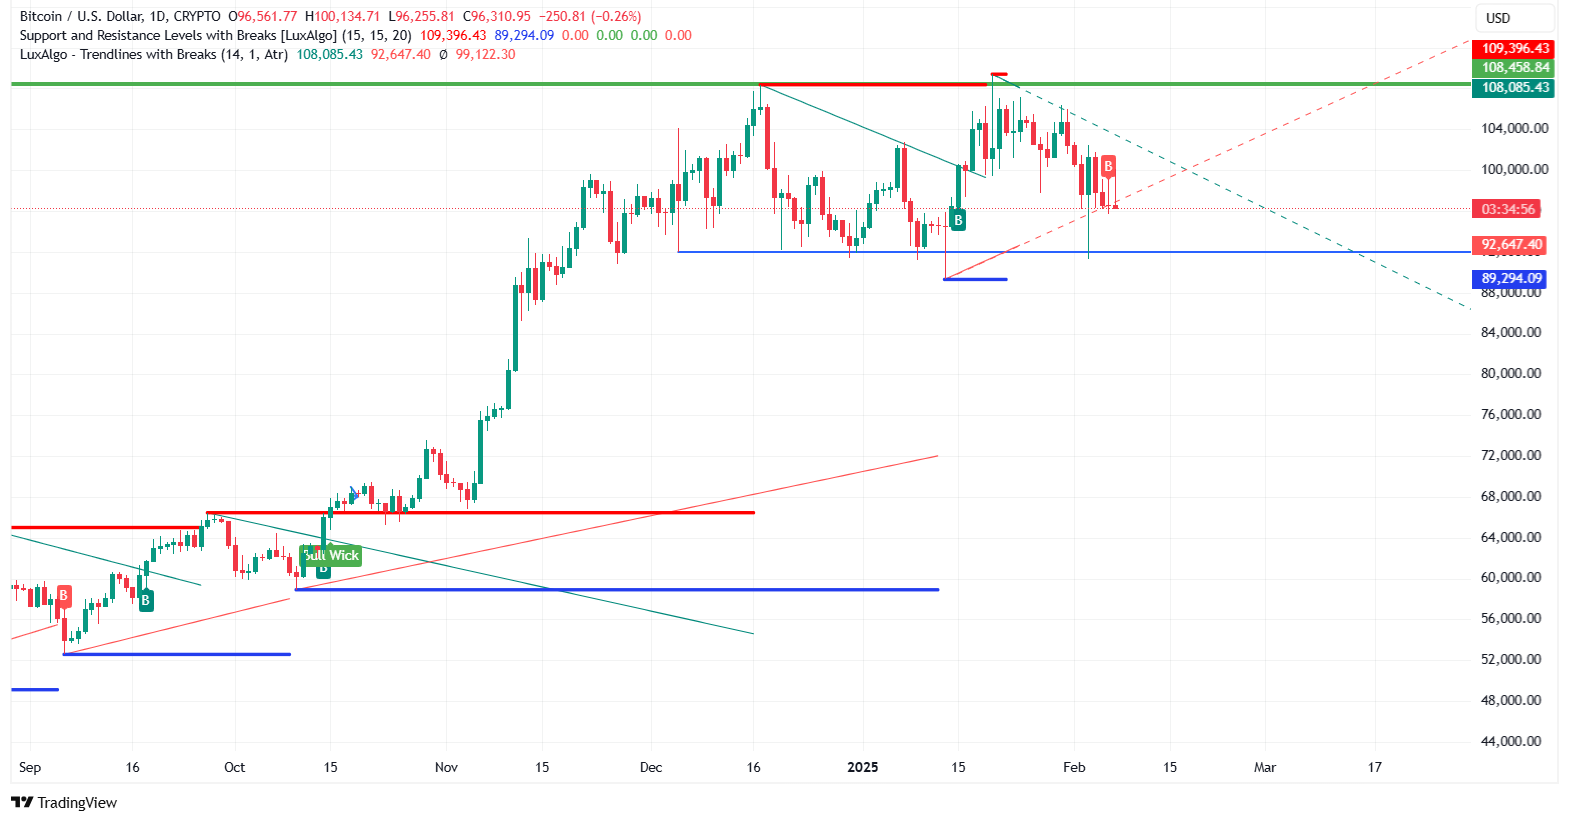
Bitcoin’s price action shows resistance between $100,000 and $102,000, with a stronger barrier forming near $108,000 – $109,000.
Immediate support is between $91,000 and $92,000, an area where buyers have historically entered the market. A broader accumulation zone exists at $85,000 – $89,000, making it a crucial level for bulls to defend.
Moving Averages and Momentum Indicators
Moving averages indicate a cautious outlook. BTC is trading below the 20 EMA ($97,659), 50 EMA ($99,058), 100 EMA ($100,109), and 200 EMA ($99,901), signaling short-term weakness.
A recovery above the 50 and 100 EMA levels would strengthen the case for further upside, while failure to get back above them may keep price action under pressure.
Momentum indicators offer mixed signals. The Relative Strength Index (RSI) is at 43.21 – 44.26, showing weak momentum but avoiding oversold territory. A move above 50 would confirm increased buying pressure, while a drop below 40 could accelerate selling.
The MACD remains bearish, yet the histogram suggests selling pressure is easing, hinting at a possible shift in momentum.
Related: Germany’s Upcoming Election Could Impact Bitcoin and Crypto
Bitcoin’s Critical Juncture: Will It Sustain Above $100K?
Bitcoin remains at a critical juncture. If it sustains above $100,000, a move toward $102,000 – $108,000 could follow, with further upside possible beyond $109,000. However, failure to hold this level could see BTC falling back toward $93,000 – $89,000 in the coming weeks.
Related: Utah House Passes Landmark Bill Allowing State to Invest in Bitcoin
The trendline analysis confirms a descending triangle pattern, often signaling bearish continuation unless a breakout occurs. Fibonacci retracement levels show $93,153 as a key support, with a deeper correction possible toward $89,000 if downward pressure continues.
On the other hand, a breakout past $109,000 would confirm a shift toward renewed bullish momentum.
Disclaimer: The information presented in this article is for informational and educational purposes only. The article does not constitute financial advice or advice of any kind. Coin Edition is not responsible for any losses incurred as a result of the utilization of content, products, or services mentioned. Readers are advised to exercise caution before taking any action related to the company.

 Shows Buy Signal, Targets Key Resistance")


