
 (S) Price Prediction 2025-2030: Future Outlook & Growth Potential")

- Sonic (S) is projected to trade between $0.50 and $0.615 in 2025, with strong support at $0.5075 and resistance near $0.55–$0.57.
- A breakout above $0.64 in 2026 could signal sustained bullish momentum, pushing the price toward new highs.
- By 2030, Sonic is expected to reach a maximum of $0.791, with potential for further price discovery beyond $0.80.
Sonic, formerly known as Fantom (FTM), is a high-performance layer-1 blockchain designed to offer faster transaction speeds, lower fees, and enhanced scalability. The transition from Fantom to Sonic marked a strategic move to optimize the network for decentralized applications (DApps), DeFi protocols, and cross-chain interoperability. Sonic aims to address blockchain inefficiencies by improving transaction throughput while maintaining security and decentralization.
Originally developed as Fantom, the platform gained recognition for its advanced consensus mechanism and compatibility with Ethereum. However, to stay ahead in the evolving blockchain landscape, Fantom underwent a rebranding and technological upgrade, resulting in Sonic. This transition introduced new infrastructure enhancements while preserving compatibility with existing applications. Sonic operates with its native S token, which is used for transactions, staking, governance, and validator incentives. The upgrade from FTM to S token was facilitated through a seamless migration process, ensuring continuity for existing users.
With a focus on speed, efficiency, and developer-friendly tools, Sonic positions itself as a key player in the blockchain space. Its advancements cater to a growing demand for scalable solutions in DeFi, NFT ecosystems, and enterprise applications.
Table of contents
- Sonic (prev. FTM) (S) Price Prediction 2025-2030 Overview
- Key Features and Utility
- Bollinger Bands Analysis for Sonic (prev. FTM) (S)
- MACD Analysis for Sonic (prev. FTM) (S)
- Relative Strength Index (RSI) Analysis for Sonic (prev. FTM) (S)
- Support and resistance levels for Sonic (prev. FTM) (S)
- Sonic (prev. FTM) (S) 2025 Price Prediction Analysis
- Sonic (prev. FTM) (S) Price Prediction for 2026
- Sonic (prev. FTM) (S) Price Prediction for 2027
- Sonic (prev. FTM) (S) Price Prediction for 2028
- Sonic (prev. FTM) (S) Price Prediction for 2029
- Sonic (prev. FTM) (S) Price Prediction for 2030
- FAQs
Sonic (prev. FTM) (S) Price Prediction 2025-2030 Overview
| Year | Minimum Price (USD) | Average Price (USD) | Maximum Price (USD) |
| 2025 | 0.5 | 0.562 | 0.615 |
| 2026 | 0.603 | 0.6235 | 0.6405 |
| 2027 | 0.64 | 0.659 | 0.662 |
| 2028 | 0.6785 | 0.6995 | 0.703 |
| 2029 | 0.72 | 0.742 | 0.7455 |
| 2030 | 0.765 | 0.788 | 0.791 |
Key Features and Utility
- High-Speed Transactions: Sonic can process over 10,000 transactions per second (TPS) with near-instant finality, reducing congestion and improving user experience.
- Ethereum Compatibility: The platform supports Ethereum-based smart contracts, allowing developers to deploy existing DApps without modifications.
- Advanced Consensus Mechanism: Sonic utilizes an improved version of the aBFT (Asynchronous Byzantine Fault Tolerance) consensus, ensuring security while maintaining high-speed processing.
- SonicVM and SonicDB: The newly introduced SonicVM enhances smart contract execution, while SonicDB optimizes storage, reducing latency and improving overall efficiency.
- Sonic Gateway: A built-in interoperability bridge that enables seamless asset transfers between Sonic and other blockchains, including Ethereum.
- Community-Driven Governance: Sonic incorporates a decentralized governance model, allowing token holders to vote on key protocol decisions.
- Zero Transaction Tax: Unlike some blockchain networks that impose buy/sell taxes, Sonic allows frictionless trading with no additional transaction fees.
- Developer Support: The platform provides grants and incentives to projects building on Sonic, encouraging ecosystem growth and innovation.
Bollinger Bands Analysis for Sonic (prev. FTM) (S)

The Bollinger Bands analysis for Sonic (S) on the 2-hour chart reveals increased volatility following a strong upward move. The price is currently near the upper Bollinger Band at $0.57949, indicating that Sonic has reached an overextended level, which could lead to a temporary pullback or consolidation. The middle band (20-period SMA) sits at $0.49760, serving as a dynamic support level that may attract buyers if the price retraces. The lower band is positioned at $0.41571, acting as a major support zone where price rebounds have historically occurred.
The recent price surge pushed Sonic above the middle band, confirming bullish momentum, but the widening bands suggest potential volatility ahead. If the price remains above the middle band and finds support near $0.49760, it could indicate continued bullish strength, potentially retesting the upper band. However, if the price drops below the middle band, it may indicate weakening momentum, leading to a deeper retracement toward $0.41571.
Traders should watch for a break above the upper band with increased volume, as it could indicate a continuation of the uptrend. Conversely, failure to hold above $0.54085 may lead to a corrective phase.
MACD Analysis for Sonic (prev. FTM) (S)
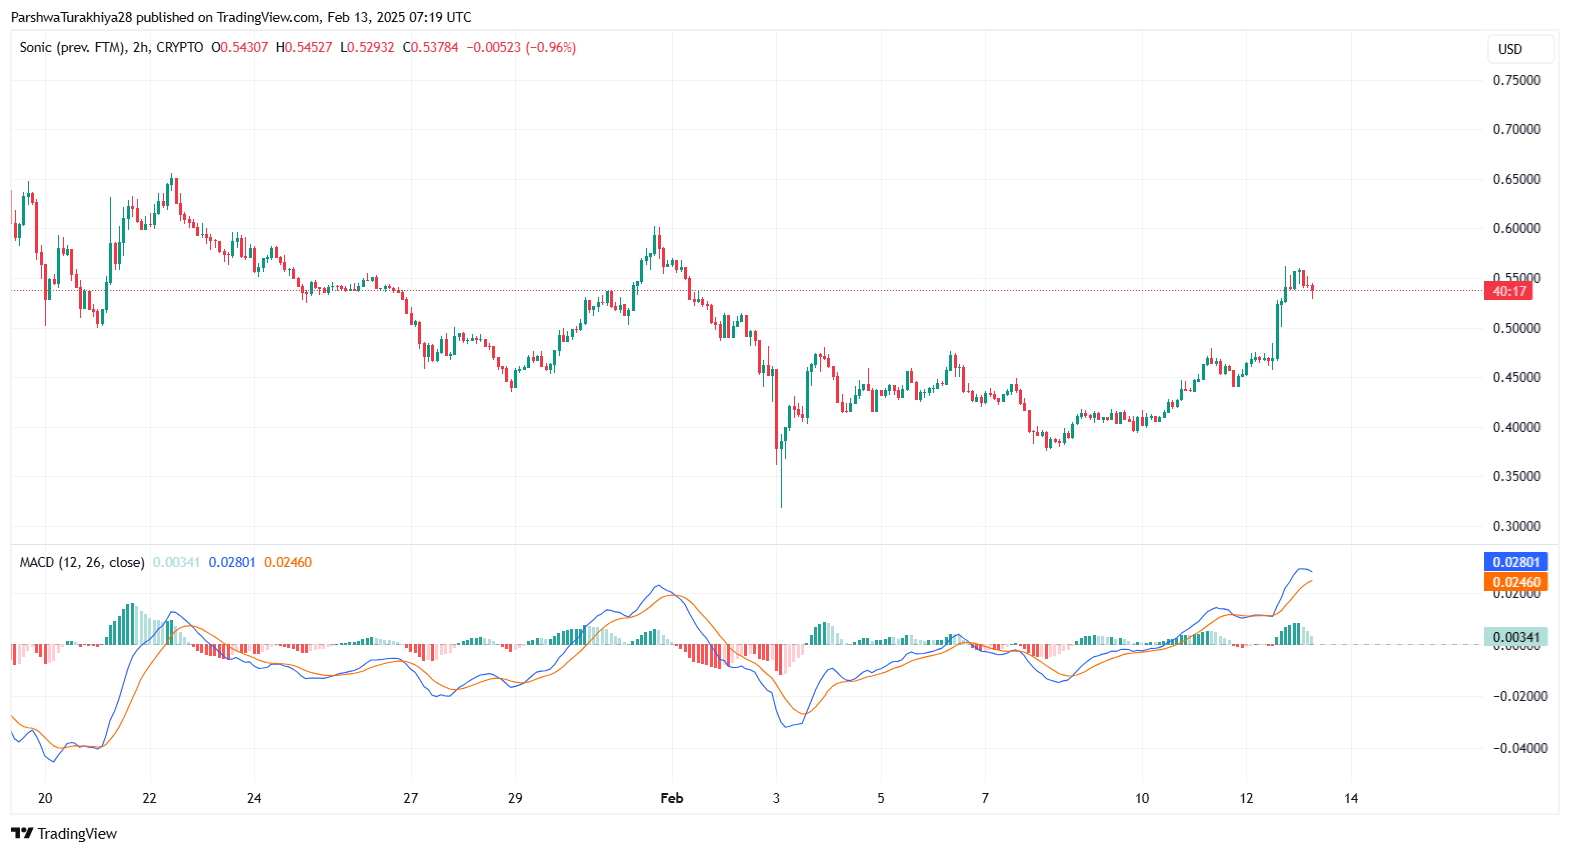
The MACD (Moving Average Convergence Divergence) analysis for Sonic (S) on the 2-hour chart indicates strong bullish momentum. The MACD line (0.02810) is significantly above the signal line (0.02461), confirming sustained buying pressure. The histogram is showing positive green bars, which reflects an expansion in momentum, suggesting that the price trend is currently bullish.
The widening gap between the MACD and signal lines indicates increased strength in the trend. However, traders should be cautious as an extended gap often precedes a potential pullback or consolidation. If the MACD line starts flattening or curving downward, it could signal an early sign of weakening momentum. A bearish crossover, where the MACD line crosses below the signal line, would indicate a shift in sentiment and potential retracement.
Relative Strength Index (RSI) Analysis for Sonic (prev. FTM) (S)
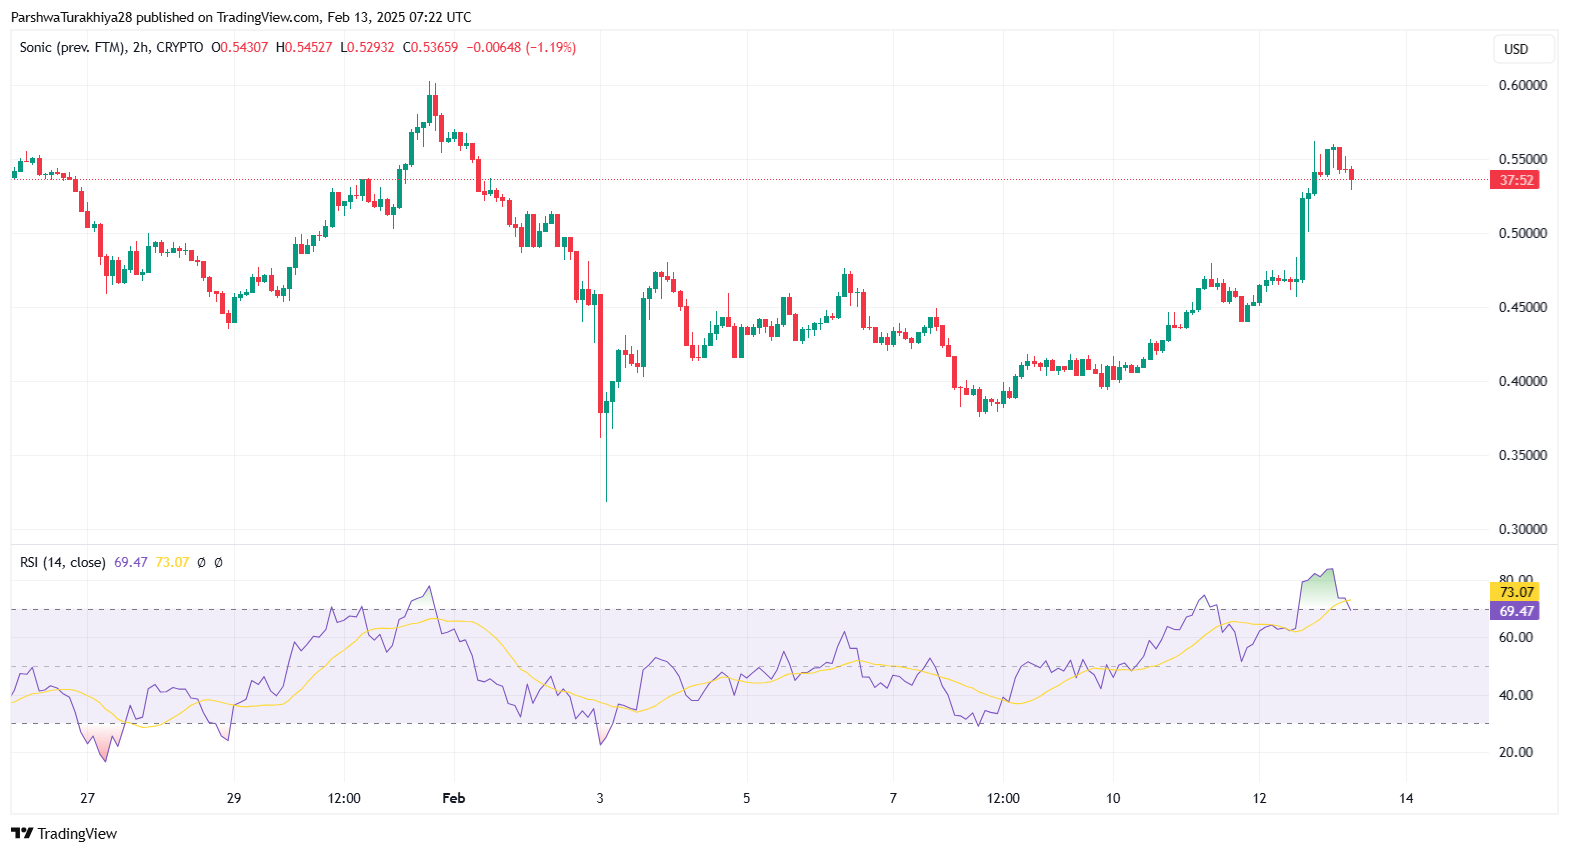
The Relative Strength Index (RSI) for Sonic (S) on the 2-hour chart currently stands at 69.80, approaching the overbought threshold of 70. This suggests that buying pressure has been strong, driving the price upward. However, with the RSI nearing overbought levels, there is an increased likelihood of a short-term pullback or consolidation before any further upward movement.
The RSI has been steadily climbing, reflecting strong bullish momentum. A breakout above 70 could indicate continued strength, potentially leading to further price appreciation. However, if the RSI starts declining below 65, it may signal weakening momentum, with the possibility of a price retracement toward key support levels.
Traders should watch for confirmation through price action and volume. If the RSI remains above 60, it may indicate that buyers are still in control. A sharp decline below 50 would be a stronger bearish signal, suggesting a shift in market sentiment.
Support and resistance levels for Sonic (prev. FTM) (S)
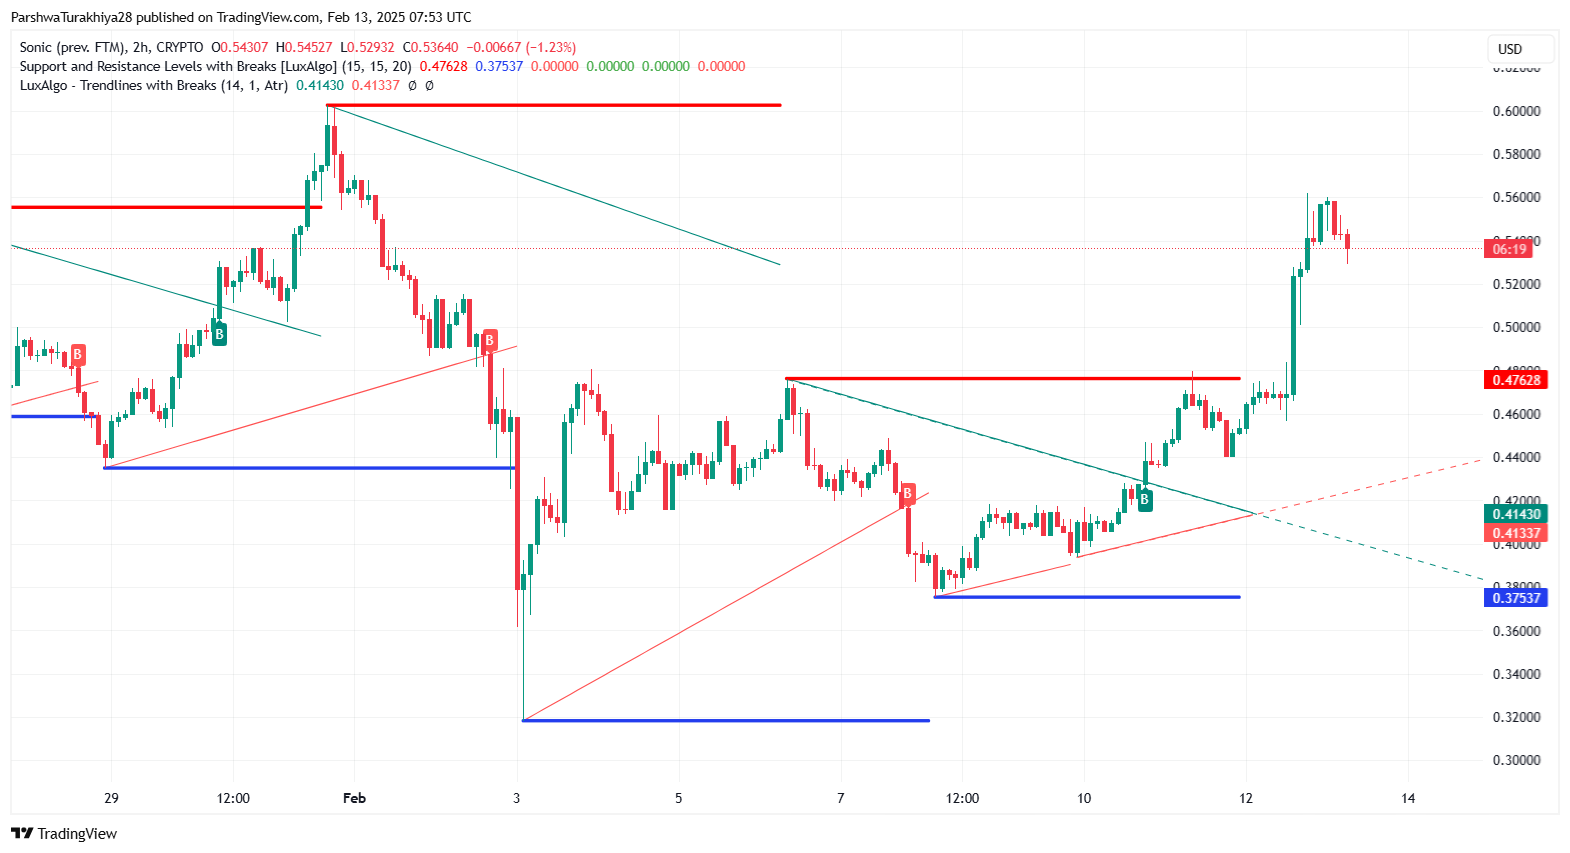
The support and resistance analysis for Sonic (S) on the 2-hour chart highlights key price levels that could influence future price movements.
The nearest resistance level is at $0.4762, where price previously encountered selling pressure and reversed. A breakout above this resistance could indicate renewed bullish momentum, potentially pushing the price toward $0.50+, where psychological resistance may come into play. If momentum remains strong, the next major resistance is near $0.55-$0.57, a zone that could act as a crucial test for further upside continuation.
On the downside, the immediate support level is at $0.4143, where buyers have previously stepped in to defend the price. If selling pressure increases, this level will be key in determining whether Sonic can hold its gains or experience a deeper pullback. A break below this support could lead to a retest of the next significant support around $0.3753, where the price has found strong buying interest in the past.
The trendline structure suggests a breakout from previous consolidation, with the price recently surpassing a descending trendline resistance. If it sustains above the $0.4762 level, it could confirm a bullish breakout, whereas failure to hold above support may lead to a correction. Traders should monitor these levels closely to identify potential breakout or retracement opportunities.
Sonic (prev. FTM) (S) 2025 Price Prediction Analysis

Sonic (S) is projected to trade within a price range of $0.50 (minimum), $0.562 (average), and $0.615 (maximum) in 2025. The EMA analysis suggests that the token has recently broken above the 200 EMA, signaling a possible shift from a downtrend to an upward trajectory. This bullish momentum indicates that Sonic could sustain its upward movement as long as it remains above key support levels.
The 20 EMA at $0.5075 serves as an immediate support level, aligning closely with the minimum projected price. If the price maintains above this mark, it strengthens the possibility of testing the $0.562–$0.615 range. Additionally, the 50 EMA at $0.4719 could provide further downside protection in case of short-term corrections.
On the resistance side, Sonic faces a significant hurdle between $0.55 and $0.57, which aligns with historical rejection zones. A strong breakout above this resistance could push the price toward the yearly maximum target of $0.615, potentially confirming a bullish trend continuation. However, failure to hold above $0.5075 could lead to a consolidation phase, where price stability is tested before another potential breakout.
The market sentiment, overall demand, and broader crypto trends will play a crucial role in Sonic’s price movement throughout 2025. Traders should closely monitor EMA levels and resistance breakouts, as they could determine whether the token sustains its bullish trajectory or faces corrections before reaching the projected highs.
Sonic (prev. FTM) (S) Price Prediction for 2026
The price is projected to range from $0.603 to $0.6405, averaging $0.6235. If Sonic continues its bullish trajectory, $0.64+ could act as a breakout zone, paving the way for sustained growth. However, failure to hold above $0.60 may lead to a period of consolidation before the next leg up.
Sonic (prev. FTM) (S) Price Prediction for 2027
Expected to move between $0.64 and $0.662, Sonic could face strong resistance around the $0.66 range, making breakout confirmation essential. The token will likely establish a more stable trading range, and sustaining above $0.64 could signal strength for long-term investors.
Sonic (prev. FTM) (S) Price Prediction for 2028
Sonic’s price is forecasted between $0.6785 and $0.703, with an average of $0.6995. If it manages to breach $0.70 convincingly, it could lead to a stronger accumulation phase. However, profit-taking at this level may trigger temporary pullbacks, making support levels key for trend continuation.
Sonic (prev. FTM) (S) Price Prediction for 2029
With a range of $0.72 to $0.7455, Sonic could test strong psychological resistance at $0.75. Sustained bullish sentiment and volume increase could push it beyond this barrier, but if buying momentum weakens, retracement to $0.72 support levels is possible.
Sonic (prev. FTM) (S) Price Prediction for 2030
Projected to trade between $0.765 and $0.791, Sonic could be on the verge of a new breakout phase, potentially surpassing the $0.80 threshold. If market conditions remain favorable, this year could mark a new price discovery zone, but maintaining momentum will depend on adoption and overall market trends.
FAQs
Sonic is a high-performance Layer-1 blockchain designed for fast transactions, low fees, and decentralized applications (DApps), evolving from Fantom (FTM).
The transition aimed to enhance scalability, improve network efficiency, and introduce new features like SonicVM and SonicDB while maintaining Ethereum compatibility.
The S token is Sonic’s native asset, used for staking, governance, transactions, and validator incentives.
Bollinger Bands, MACD, RSI, and EMA suggest bullish momentum, with resistance at $0.55–$0.57 and support near $0.50.
Sonic is projected to trade between $0.50 (minimum), $0.562 (average), and $0.615 (maximum) in 2025.
While $1 is not in the 2025-2030 range, continued adoption, ecosystem growth, and DeFi expansion could push it toward higher price discovery post-2030.
Sonic’s scalability, growing ecosystem, and technical upgrades make it a promising project, but investors should watch market trends and risk factors.
Adoption in DeFi, NFT, and enterprise applications, network upgrades, and broader crypto market trends will be key drivers.
Sonic offers faster transactions (10,000+ TPS), lower fees, and cross-chain interoperability, positioning it competitively against Ethereum, Solana, and Avalanche.
Sonic (S) is available on major crypto exchanges and DeFi platforms, with liquidity provided across centralized and decentralized exchanges.
Disclaimer: The information presented in this article is for informational and educational purposes only. The article does not constitute financial advice or advice of any kind. Coin Edition is not responsible for any losses incurred as a result of the utilization of content, products, or services mentioned. Readers are advised to exercise caution before taking any action related to the company.


 (S) price prediction for 2025-2030, covering support & resistance levels, technical indicators, and long-term growth potential. Will Sonic surpass $0.80 by 2030?)