


- Coinbase’s lack of ETH staking transparency raises concerns about its custody structure.
- Ethereum’s key support at $2,685-$2,690 must hold to prevent a drop to $2,650.
- ETH’s RSI at 43.14 suggests a neutral trend, but MACD hints at a potential reversal.
Coinbase, the largest Ethereum staking custodian, has consistently avoided disclosing information on its staked ETH holdings for the past five quarters. And now, estimates suggest Coinbase manages approximately 21% of all staked ETH, making its lack of transparency a significant concern.
Despite calling itself a transparent entity, Coinbase has not provided details on its staked ETH, cbETH backing, or cbBTC reserves. This has raised doubts about the integrity of its staking operations, particularly as its address rotation and custody structure make tracking more challenging.
Coinbase’s Transparency Issues & Staking
Tracking Coinbase’s staked ETH has proven difficult due to its frequent address rotations. While independent analysts have estimated a constant 15% of staked ETH under Coinbase in previous quarters, recent data suggests this number could be around 8.4%.
However, this figure only accounts for labeled addresses, with a significant portion unaccounted for. As Coinbase continues to modify its staking structure, accurately determining its true holdings remains a challenge.
Related: Ethereum Fees at $0.41 – A 2-Year Low: ETH Price Impact Analyzed
Base Network and cbETH
Base, Coinbase’s Ethereum Layer-2 network, aligns closely with Ethereum’s ecosystem, yet the exchange refuses to disclose its role in Ethereum’s security layer. A more transparent approach could enhance trust in its staking products.
Additionally, cbETH might have gained broader adoption if its backing was verifiable. Instead, Coinbase expanded cbETH’s supply without proving the corresponding staked ETH, creating uncertainty about its actual value.
Ethereum Price Analysis
Key Support and Resistance Levels
Ethereum has been showing signs of stability, trading at $2,728.67 with a 1.55% gain in the past 24 hours.
A critical support zone lies between $2,685 and $2,690, where previous price action suggests strong buying interest. If ETH fails to hold above this level, the next key support may form around $2,650.
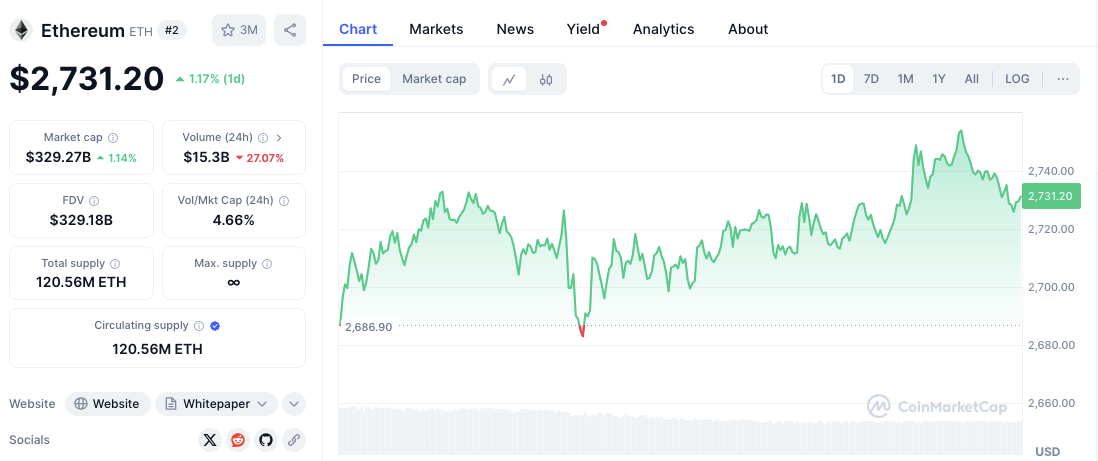
On the upside, resistance is visible between $2,740 and $2,750. A breakout above this level could push Ethereum toward $2,780 or even $2,800 in the near term. Given the current price movements, ETH is maintaining an upward trend with minor corrections, suggesting a bullish outlook.
Ethereum’s Technical Indicators
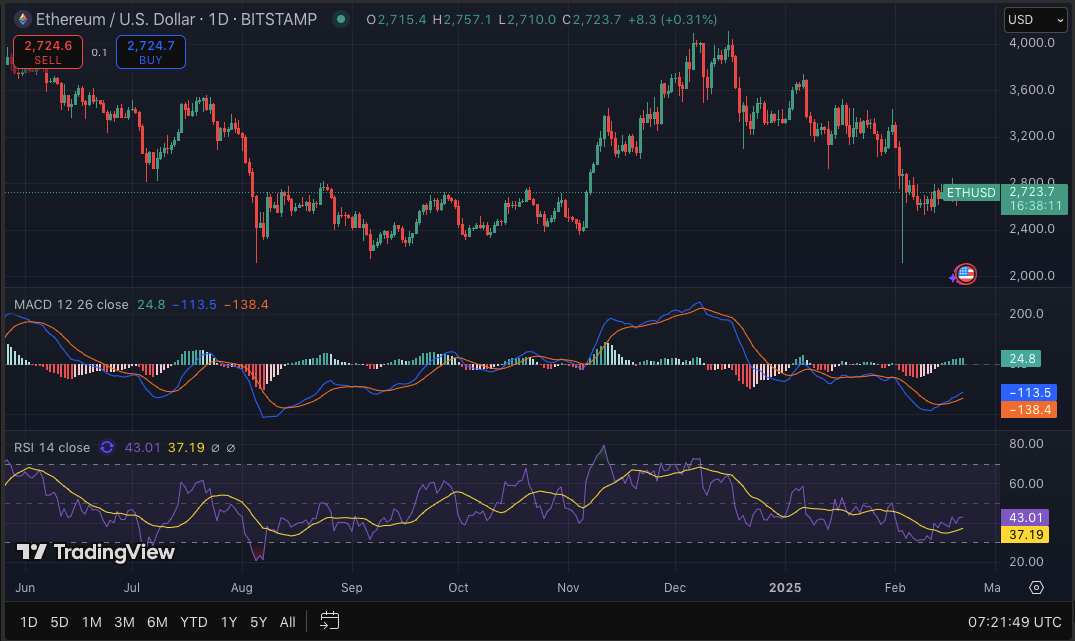
The Relative Strength Index (RSI) currently stands at 43.14, slightly above the oversold territory. This suggests ETH remains in a neutral-to-bearish zone, with potential for recovery if buying pressure increases.
Related: Ethereum Community Intrigued by $1.37 Million Burn & “Brain-Weapon” Claim
Meanwhile, the MACD indicator reveals a bearish trend, with the MACD line at -113.4 below the signal line at -138.3.
However, the histogram is showing signs of turning positive, signaling a possible bullish reversal. If momentum shifts, ETH could see an upward breakout beyond current resistance levels.
Disclaimer: The information presented in this article is for informational and educational purposes only. The article does not constitute financial advice or advice of any kind. Coin Edition is not responsible for any losses incurred as a result of the utilization of content, products, or services mentioned. Readers are advised to exercise caution before taking any action related to the company.


