


- Whale transactions drop 79%, signaling reduced institutional interest in SHIB.
- SHIB struggles as outflows exceed -$50M, causing sharp price declines.
- RSI at 39.62 nears oversold; MACD hints at weakening bearish momentum.
Shiba Inu (SHIB) has seen a major downturn in the last three months, with whale transactions falling sharply by 79%. This decrease in large-holder activity matches SHIB’s falling price, pointing to reduced institutional interest.
According to analyst Ali Martinez, whale transactions over $1 million have considerably decreased, pushing the asset lower.
Support is forming around $0.000016, but resistance stays near $0.000021. Current technical indicators suggest SHIB might continue to struggle in the short term unless whale accumulation picks up again.
Whale Activity Dries Up as SHIB Price Drops
SHIB’s price hit a high point in early December before starting a long slide. The drop in whale activity signals fading confidence among large investors, often leading to lower liquidity and increased volatility.
The reduction in high-value transactions implies institutional investors are selling off their holdings or decreasing their investment in SHIB.
Outflows Exacerbate SHIB’s Downward Trend

Looking at the spot inflow/outflow chart, a consistent negative trend is evident. Several instances of outflow spikes surpassing -$30 million occurred, notably in late May, early November, and mid-December. These large outflows often caused sudden price declines, showing the strong link between netflows and price movements.
Related: Shiba Inu (SHIB) Breakout Alert: Analyst Sees 422% Surge to New Highs
The largest outflow event, exceeding -$50 million in November, happened at the same time as a major SHIB price drop. While occasional inflows above $20 million were seen in July, October, and November, they weren’t enough to maintain long-term stability.
Market Indicators Paint Bearish Picture for SHIB
SHIB is currently trading at $0.00001523, down 2.48% in the last 24 hours and 9.58% over the past week. With a market capitalization of $8.97 billion and a 24-hour trading volume of $229.2 million, SHIB remains a highly traded asset despite its bearish trend.
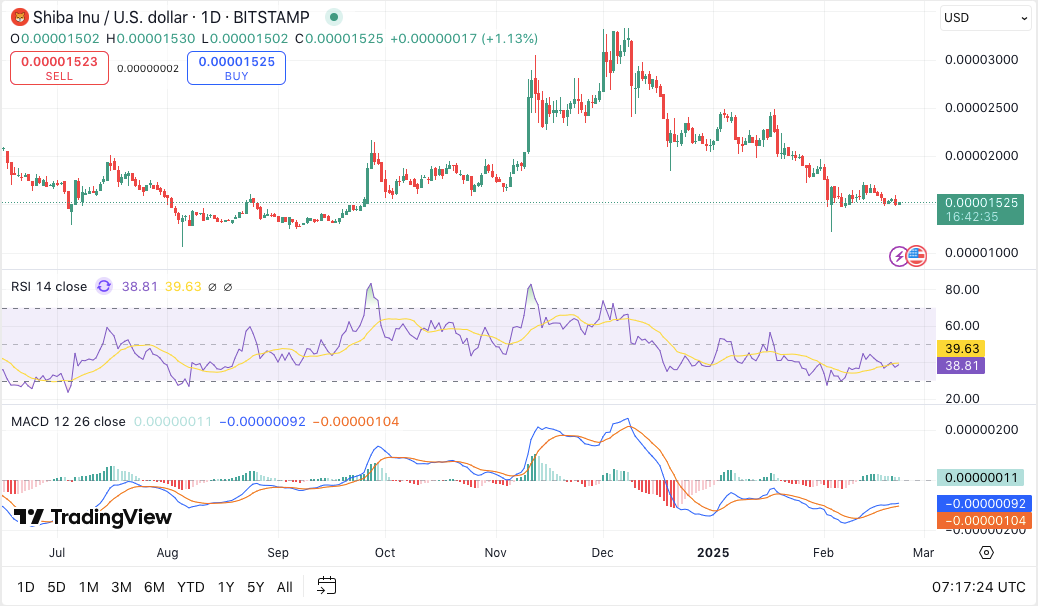
The Relative Strength Index (RSI) is hovering around 39.62, meaning SHIB is getting closer to oversold territory. If the RSI goes below 30, it could signal a potential reversal. However, it needs to go above 50 to confirm a change in momentum.
Related: Shiba Inu Price at Reset Point: Breakout or Stagnation Next?
The Moving Average Convergence Divergence (MACD) indicator also shows a bearish sentiment. The MACD line remains below the signal line, indicating ongoing downward pressure. However, the narrowing histogram suggests weakening bearish momentum, which could lead to a potential crossover if buying pressure increases.
Disclaimer: The information presented in this article is for informational and educational purposes only. The article does not constitute financial advice or advice of any kind. Coin Edition is not responsible for any losses incurred as a result of the utilization of content, products, or services mentioned. Readers are advised to exercise caution before taking any action related to the company.


