


- BNB Chain surpasses Solana in DEX volume, signaling rising investor confidence.
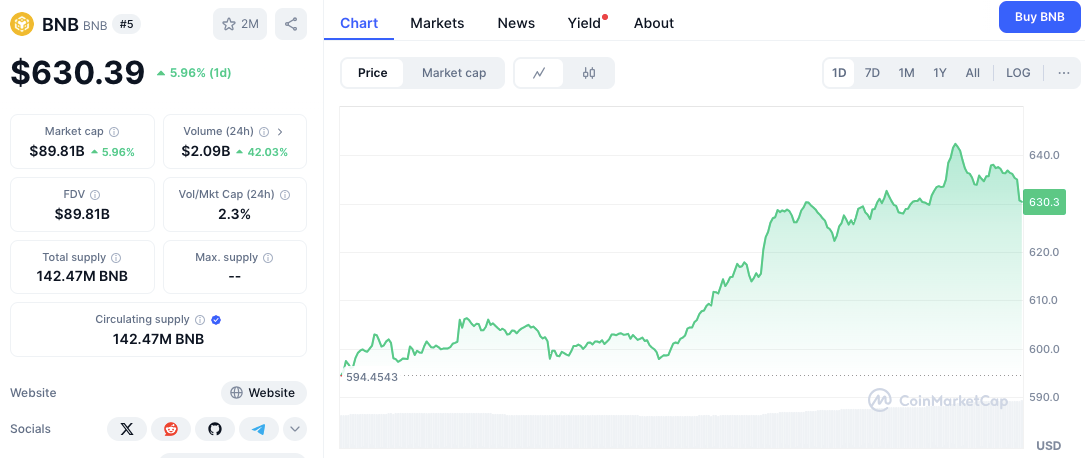
- BNB price surges past key levels, targeting $640 resistance amid bullish momentum.
- Technical indicators support an uptrend, with RSI and MACD signaling buying pressure.
BNB Chain has moved ahead of Solana in 24-hour decentralized exchange (DEX) trading volume, indicating a shift in market activity. This increase points to growing investor interest in BNB’s ecosystem, showing strong buying momentum in the broader crypto market.
In addition, BNB’s price has seen a significant rise, breaking past key resistance levels and staying in an upward trend. As trading volume increases, investors are watching for potential breakout points and key technical indicators to figure out the next price move.
Why Is BNB’s Price Going Up?
BNB is currently trading at $636.28, which is a 6.55 jump in the last 24 hours. This upward movement suggests strong bullish momentum, pushing the price toward new resistance levels.
This price increase comes as the broader market is also recovering, with buyers showing they believe in BNB’s long-term potential. Also, the rising trading volume supports this upward trend, showing that investors are consistently interested.
Related: BNB Surges 7% After Binance Clinches $2 Billion from Abu Dhabi’s MGX
Key Price Levels for BNB
BNB has found good support between $600 and $610, a range that was previously a strong buying area. Another minor support level has appeared at $620, where the price paused before this latest upward move. If the price stays above $630, it might test the resistance at $640, which is currently a key price barrier.
If BNB breaks above $640, the next target range is between $650 and $660. These levels are price points where people might take profits. However, if the price can’t stay above $630 and falls below $620, it might go back down to test $610 or even lower levels. Traders are watching these price moves closely to see which way the price might break out next.
Technical Indicators Support a Continued Uptrend
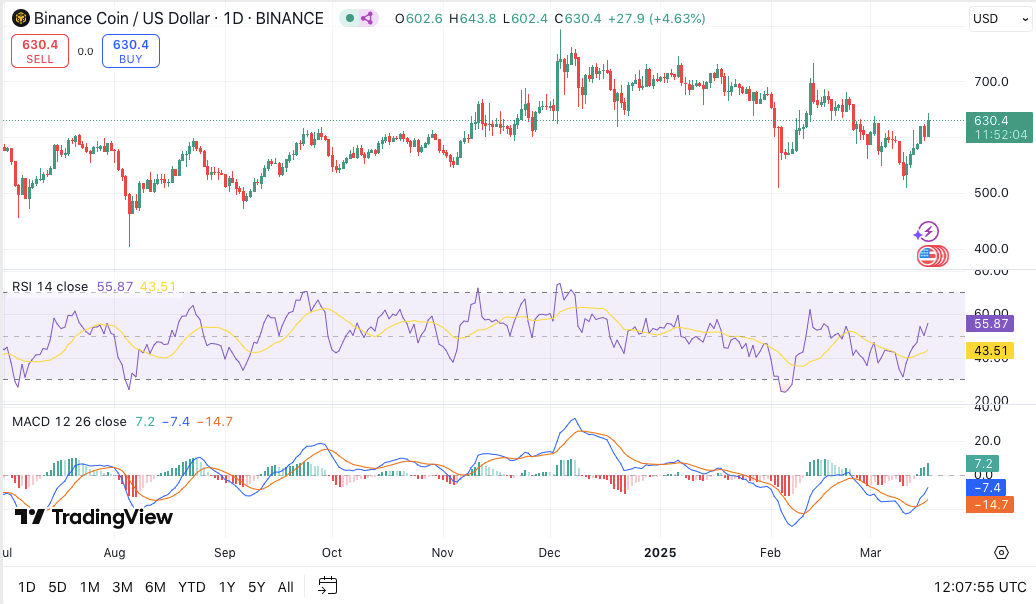
BNB’s Relative Strength Index (RSI) stands at 55.87, signaling growing bullish momentum. Since the RSI is above 50 but below 60, there’s still room for the price to go up before it might be considered overbought. If the RSI crosses 60, that could confirm a strong upward trend, encouraging more buyers to get in.
Related: BNB Chain Sees Activity Spike: CZ’s Shadow Looms Large (Price Analysis)
The Moving Average Convergence Divergence (MACD) indicator also suggests buying interest. The MACD line has crossed above the signal line, pointing to upward price movement. Additionally, the histogram is turning positive, reinforcing the likelihood of continued buying pressure.
Disclaimer: The information presented in this article is for informational and educational purposes only. The article does not constitute financial advice or advice of any kind. Coin Edition is not responsible for any losses incurred as a result of the utilization of content, products, or services mentioned. Readers are advised to exercise caution before taking any action related to the company.


: SEC Drops Appeal in XRP Lawsuit – What’s Next for the Company and XRP?")


