


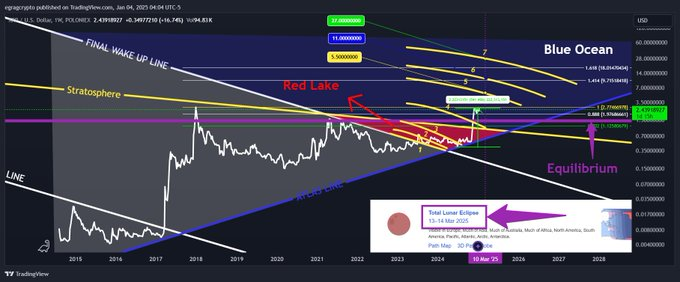
- Analyst’s chart uses Fibonacci arcs to map XRP’s potential price path
- “Red Lake” and “Blue Ocean” zones on the chart represent market behavior
- Technical analysis suggests XRP to potentially reach price targets ranging from $13 to $27
Crypto analyst EGRAGCrypto has released their latest “XRP Bermuda Triangle” chart, presenting a detailed technical analysis that combines Fibonacci arcs and symbolic zones to project XRP’s future price movements.
The chart tracks XRP’s progression through seven significant Fibonacci arcs. As of January 2025, XRP has moved past the first four arcs, indicating a change in market momentum. Price is now navigating between arcs five and seven, with each arc potentially acting as a resistance or acceleration area. The month of March is crucial when these arcs converge, suggesting increased volatility.
Related: XRP’s Counter-Narrative: Challenging Bitcoin’s Institutional Dominance Towards $200K
What Do the “Red Lake” and “Blue Ocean” Zones Signify for XRP?
The Bermuda Triangle structure incorporates symbolic zones that reflect the psychology of XRP traders and overall market sentiment.
Related: Crypto Author Challenges CoinMarketCap’s XRP Supply Calculation, Calls for Fairer Accounting
After reclaiming the Equilibrium zone near $1.12 and breaking above the long-term Atlas Line, XRP pushed through the Final Wake-Up Line—a downtrend that lasted for several years. Incidentally, this breakout led to a volatile period known as the Red Lake, historically marked by strong price rejections.
XRP Price Levels Highlighted in the “Blue Ocean” Zone
Having moved out of the Red Lake, XRP is now in what EGRAG calls the Blue Ocean—a wider range with less immediate resistance.
Key Fibonacci levels within this zone include $1.97, $2.77, $9.71, and $18.01. These levels are combined with forecasts from Elliott Wave theory, which suggests Wave 3 could reach as high as $13 or $21. Assuming historical patterns and Fibonacci extensions hold, Wave 5 could potentially drive the price toward $27 or even higher.
Related: XRP’s Counter-Narrative: Challenging Bitcoin’s Institutional Dominance Towards $200K
With a confluence of technical indicators and symbolic zones the Bermuda Triangle chart aims to serve as more than just a visual representation—it’s presented as a strategic roadmap for those looking at XRP’s long-term potential.
Disclaimer: The information presented in this article is for informational and educational purposes only. The article does not constitute financial advice or advice of any kind. Coin Edition is not responsible for any losses incurred as a result of the utilization of content, products, or services mentioned. Readers are advised to exercise caution before taking any action related to the company.

 Price Prediction for June 23, 2025: Can ETH Rebound After Slipping Below $2,250?")
 Price Prediction for June 23, 2025: BTC Holds Above $101K as Options Expiry Nears and Bears Pressure $105K Zone")


