
 Price Prediction For June 20, 2025")

Bitcoin continues to hover below a critical resistance zone, maintaining a tight range after recent failed breakout attempts. Traders are closely watching for confirmation of either a bullish reversal or further downside as key momentum indicators remain mixed. Here’s a detailed look at the Bitcoin price today, current momentum, and what to expect next.
What’s Happening With Bitcoin’s Price?
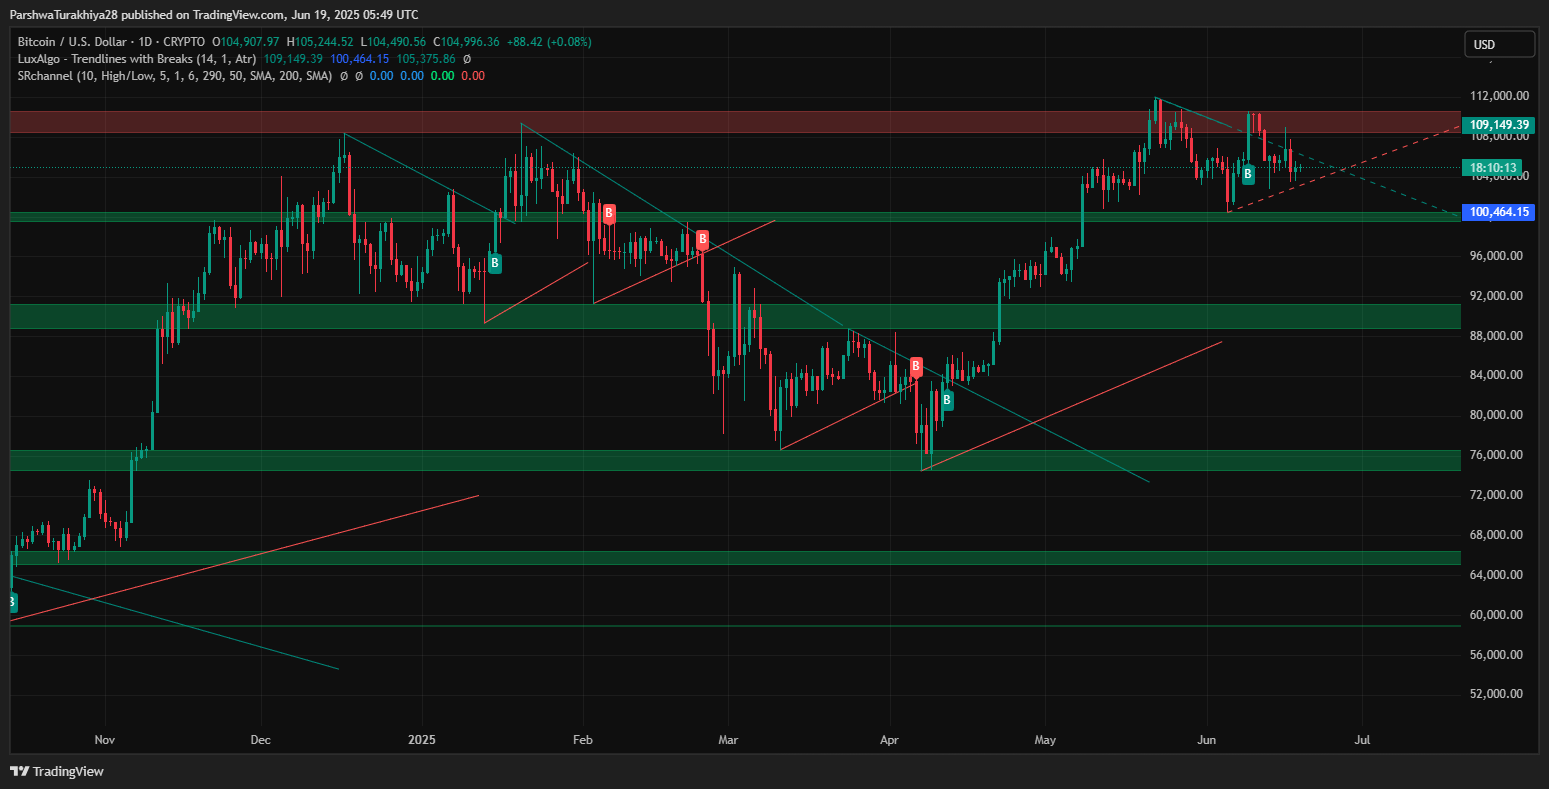
The Bitcoin price is trading at $104,980 at the time of writing, reflecting a minor decline of 0.14% over the last 24 hours. Following a sharp rejection from the $108,000–$109,000 zone, BTC is consolidating above the $104,300–$103,700 support band. Buyers are attempting to defend this range amid increasingly tight price action forming within a symmetrical triangle pattern on the daily chart.
This contraction phase, paired with declining ATR (average true range), suggests Bitcoin price volatility is compressing ahead of a breakout. The question now is Why is Bitcoin price going down today despite supportive technical structures? The answer lies in conflicting momentum signals and weakening trend strength indicators.
Bitcoin Price: RSI, MACD, and Trend Indicators Paint Mixed Picture
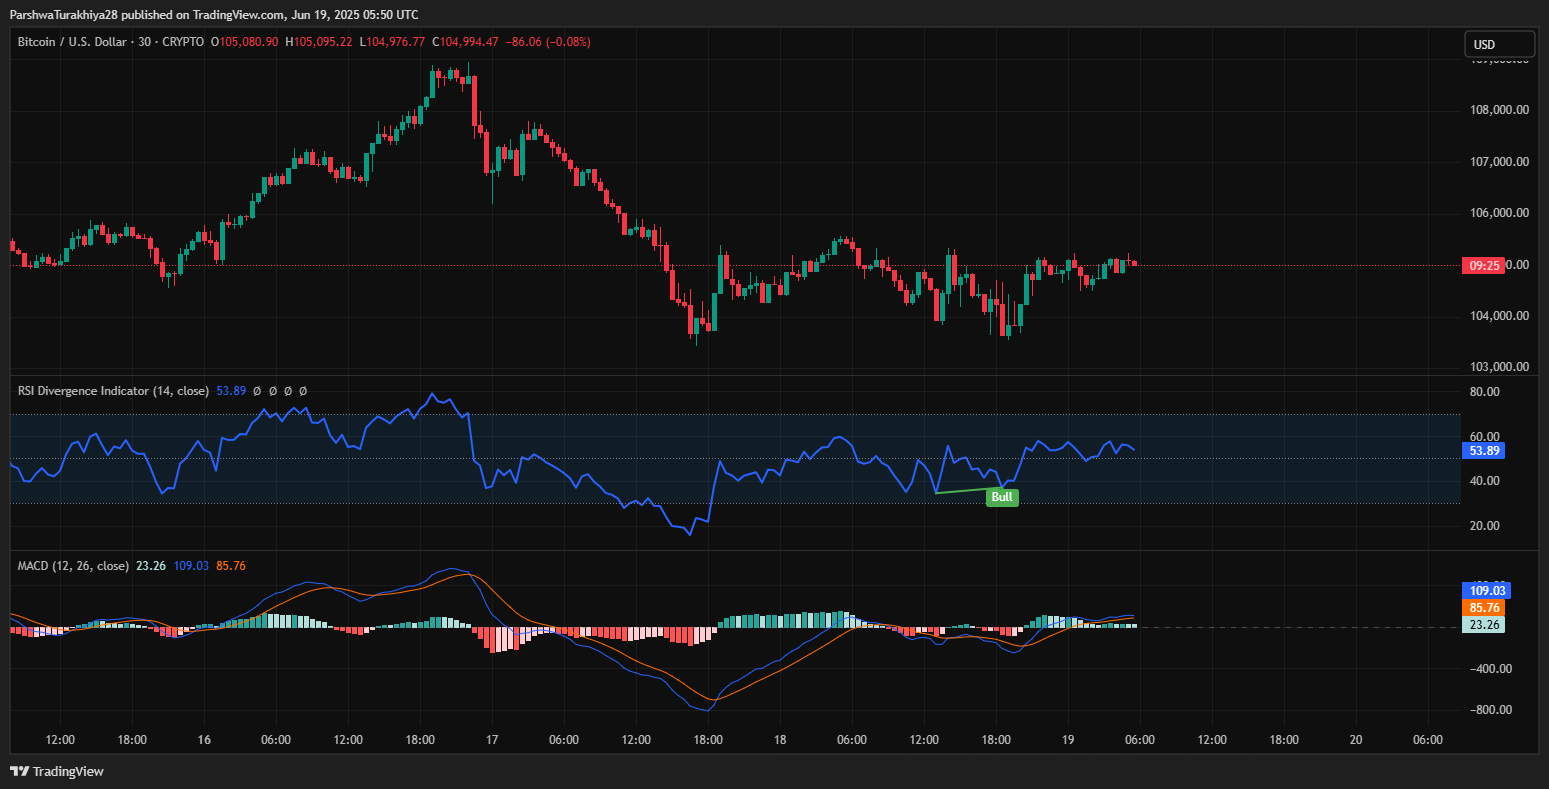
On the 30-minute chart, the RSI currently stands at 53.89, sitting just above the midline and signaling neutral momentum. However, the MACD remains in positive territory, with a slight bullish crossover in play, suggesting the potential for upward continuation if buyers reclaim $105,300.
The Keltner Channel also shows Bitcoin price action sitting just below the basis line, signaling pressure from above.Meanwhile, the Bollinger Bands are contracting sharply, further confirming that Bitcoin price volatility is diminishing. This contraction typically precedes strong moves in either direction. Unless bulls regain control above $106,000 with volume, bears may soon press toward lower liquidity zones.
Bitcoin Price: Key Support and Resistance Levels to Watch
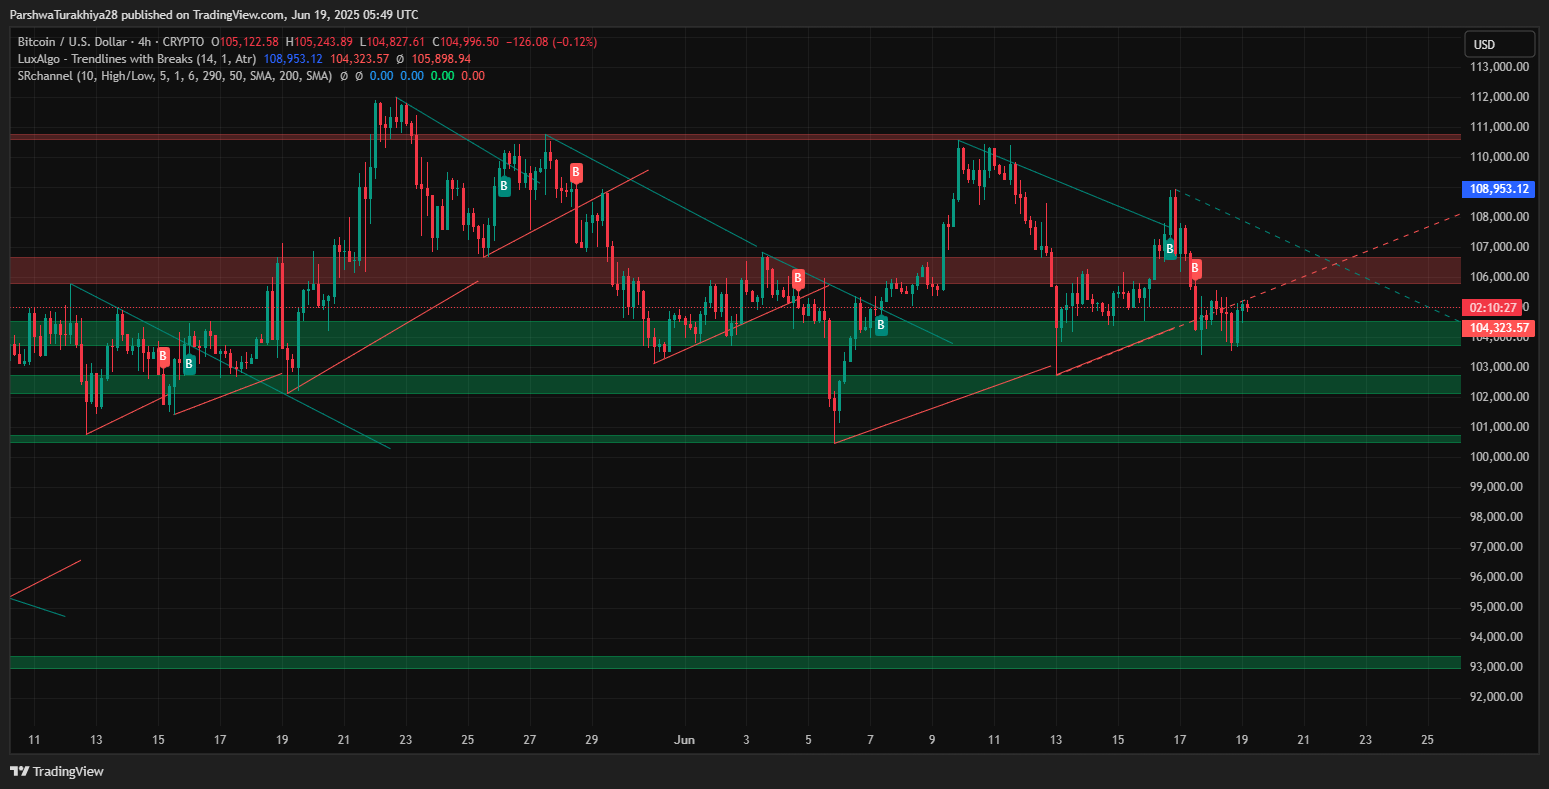
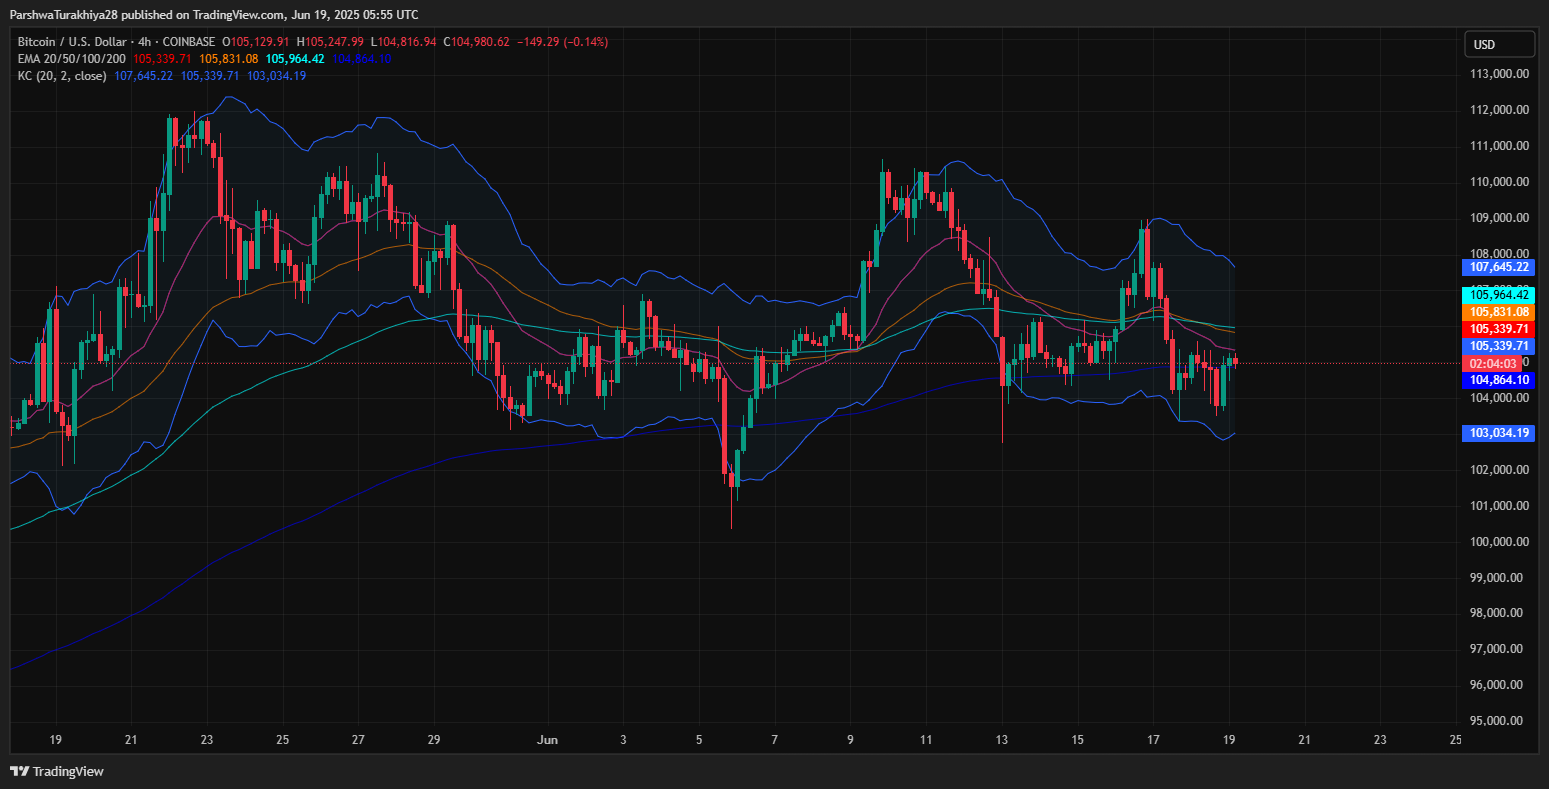
The 4-hour chart for Bitcoin presents a clear technical landscape with key support and resistance levels that traders should monitor closely. Immediate support lies between $104,300 and $103,750. This range has acted as a crucial demand zone in recent sessions, preventing deeper downside moves and providing a temporary floor for Bitcoin price action during periods of increased selling pressure.
Below this, major support levels are visible at $101,000 and $99,500. If the current support range fails to hold, these levels could become the next areas where buyers may attempt to step in. A sustained drop below $100,000 would likely trigger more aggressive bearish sentiment, adding to current Bitcoin price volatility.

On the upside, resistance is capped by a confluence of indicators. The 20/50/100 EMA cluster sits at $105,960, acting as the first barrier. Just above, the Parabolic SAR signals resistance at $106,443, while the Supertrend indicator marks another ceiling at $107,961. This stacked overhead resistance explains the current pause in upward momentum.
To unlock a stronger bullish rally, Bitcoin must decisively break above the $108,000–$109,000 breakout zone. This region represents a critical bullish pivot. Unless bulls reclaim this zone with strong volume and momentum, any Bitcoin price spikes toward the $112,000 level are unlikely to be sustained. The price remains trapped below the upper boundary of the descending channel, limiting breakout potential in the short term.
Why Bitcoin Price Going Down Today

The recent decline is largely driven by technical rejection near the $108,000 resistance, as shown by repeated bearish rejections on both the 30-minute and 4-hour charts. Additionally, the Klinger Oscillator has turned negative, and the True Strength Index (TSI) remains below zero at -0.57, suggesting momentum is still leaning bearish.
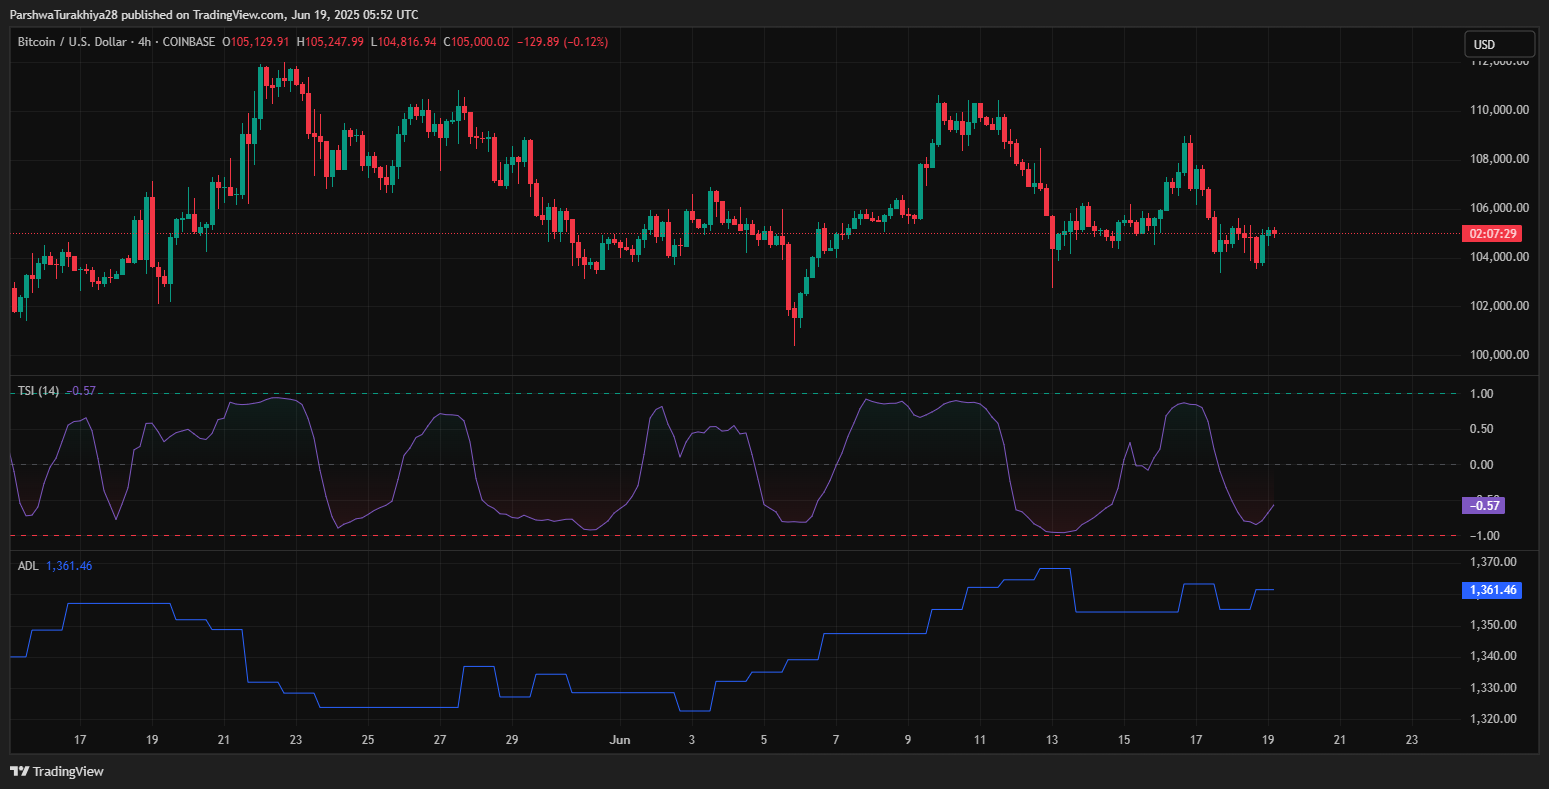
Furthermore, the ADL (Accumulation/Distribution Line) has flattened out, implying that despite price consolidating, strong buying pressure is not yet visible. This lack of demand explains why Bitcoin price going down today, even as traders anticipate a breakout.
Bitcoin Price Short-Term Outlook and Forecast
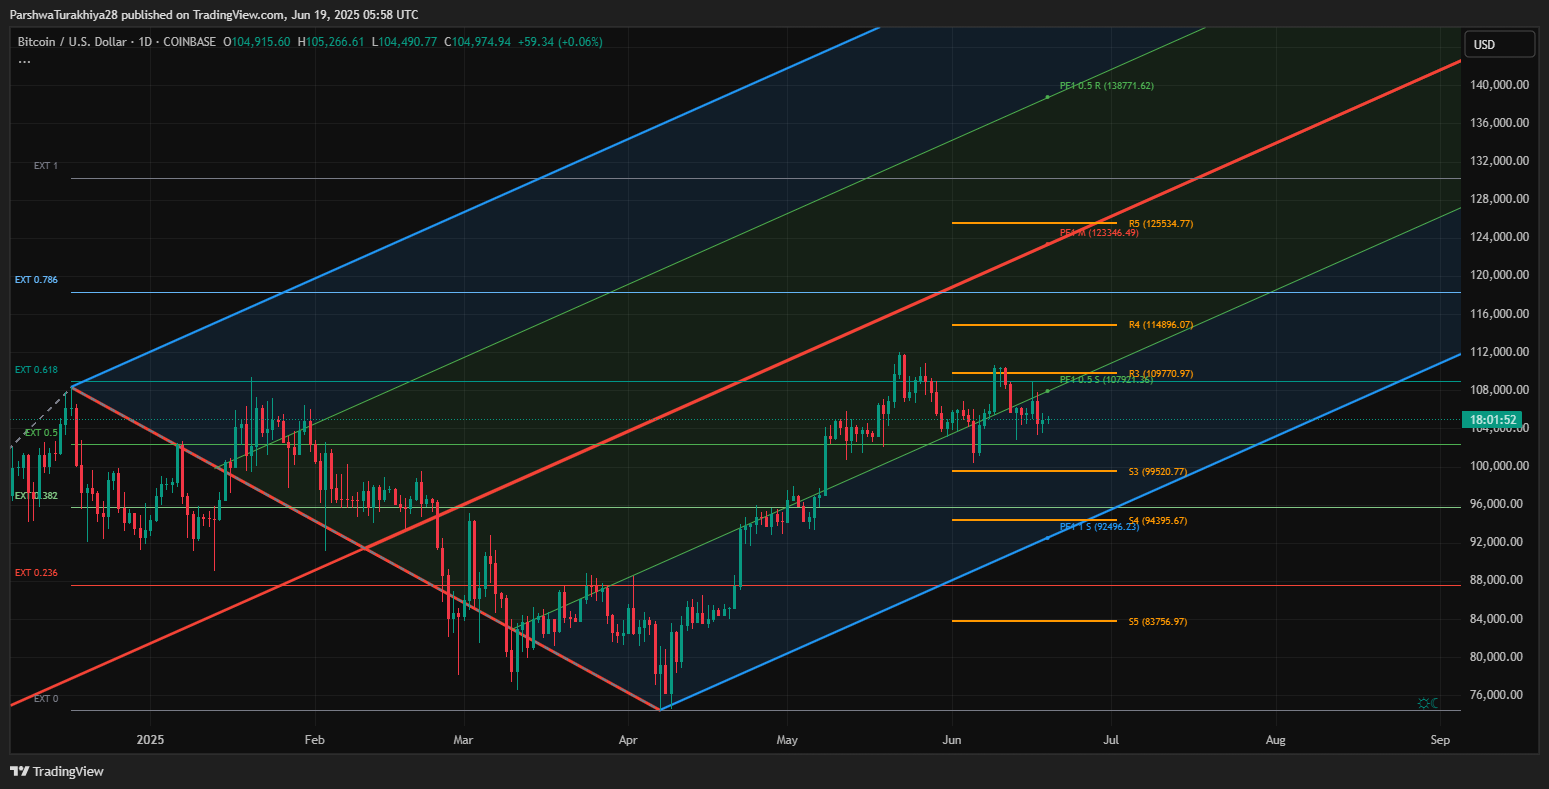
Bitcoin is currently positioned at the apex of a descending triangle and a broader rising channel structure, as seen on the daily Fibonacci pitchfork. If BTC closes above $106,000 with volume, a rally toward $109,000 and potentially $114,000 is feasible.
However, failure to hold above $103,750 could trigger a sharper drop to $99,520 or even $94,395. Traders should keep a close watch on the next 12–24 hours for directional confirmation.
| Level Type | Price (USD) |
| Immediate Support | 104,300 – 103,750 |
| Major Support Zone | 101,000 – 99,520 |
| Resistance Cluster | 105,960 – 107,961 |
| Breakout Confirmation | 108,953 |
| Bearish Breakdown Zone | 103,000 – 99,520 |
| Bullish Target Levels | 109,770 – 114,896 |
For now, the Bitcoin price update reflects cautious indecision as traders await clearer signals. With volatility near cycle lows and momentum mixed, breakout traders may find opportunity once BTC escapes the current compression zone.
Disclaimer: The information presented in this article is for informational and educational purposes only. The article does not constitute financial advice or advice of any kind. Coin Edition is not responsible for any losses incurred as a result of the utilization of content, products, or services mentioned. Readers are advised to exercise caution before taking any action related to the company.
 Price Prediction 2025: Road to $0.20 and Beyond?")
 Price Prediction for June 20, 2025")
 Price Prediction for June 20, 2025")
 Price Prediction for June 20, 2025")

