
 Price Prediction 2025: Road to $0.20 and Beyond?")

The Bubblemaps price today is trading at $0.1400, down 3.4% on the day, after hitting intraday highs near $0.148. Despite short-term volatility, the broader structure shows signs of bullish continuation as BMT attempts a breakout from a multi-week symmetrical triangle. As we progress through mid-2025, traders are closely tracking whether the breakout attempt above the $0.144 pivot zone can fuel further upside.
What’s Happening With Bubblemaps’s Price?
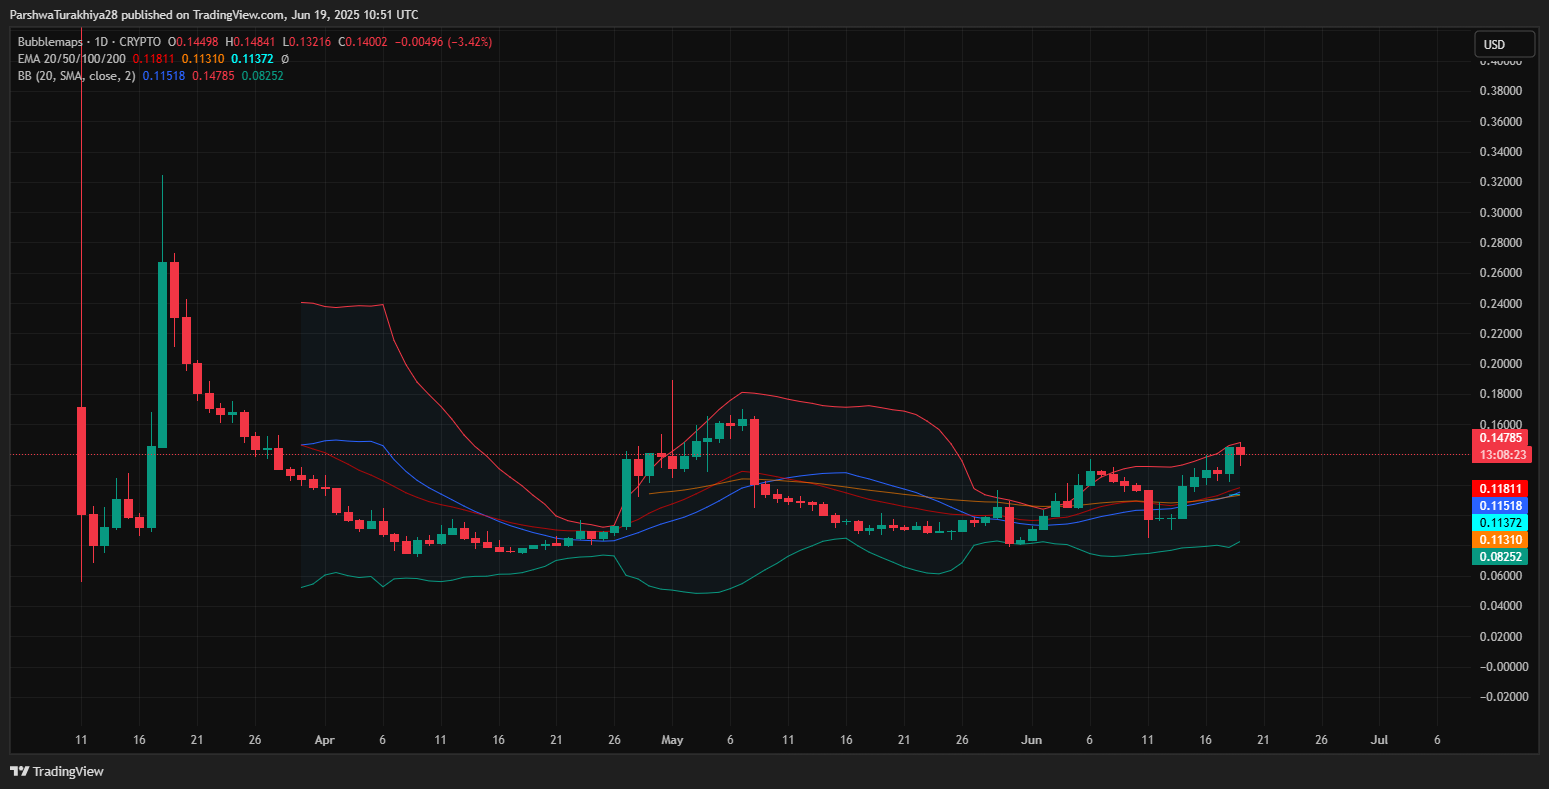
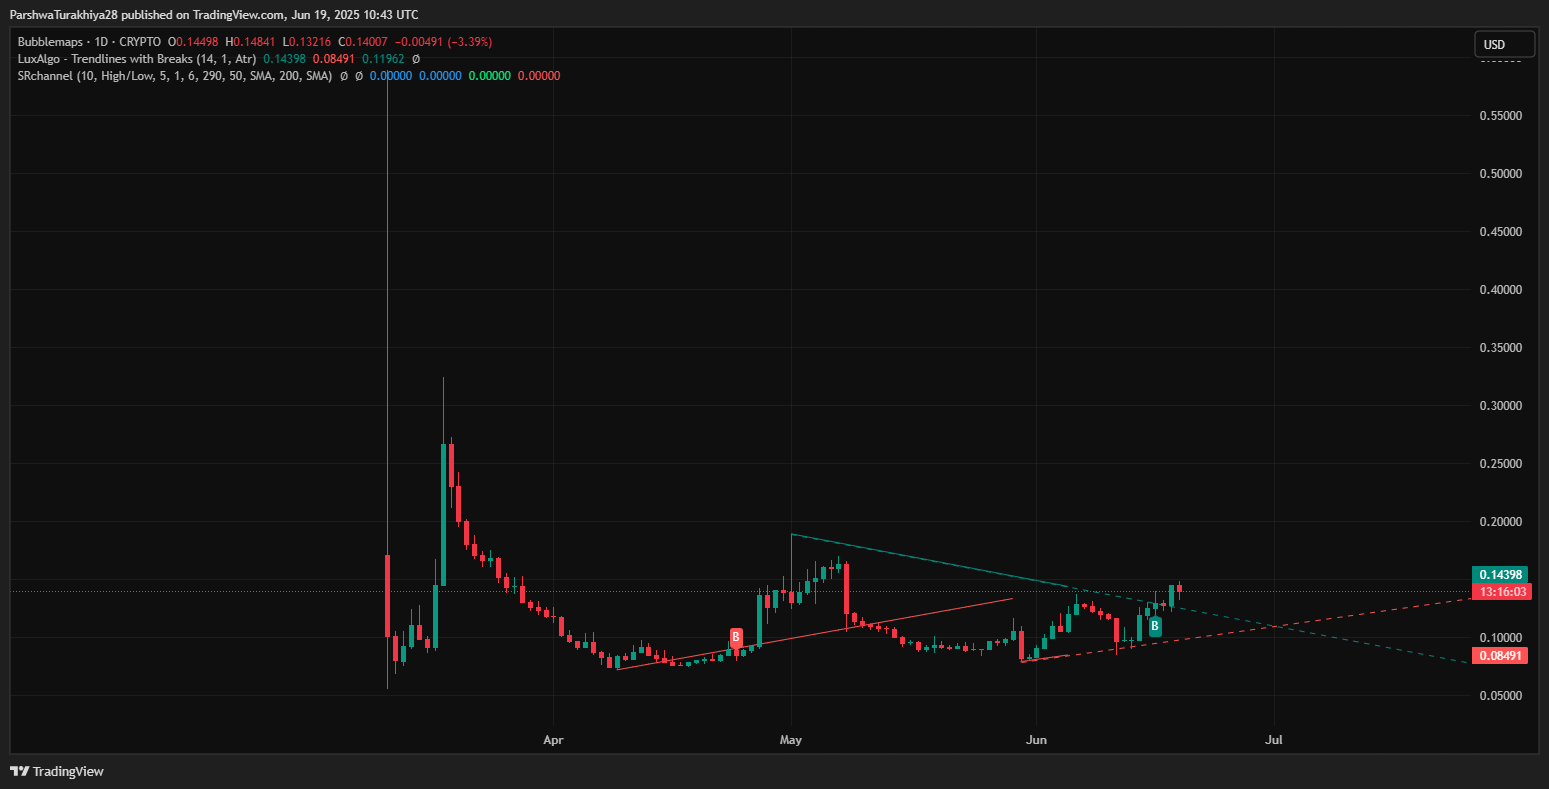
The Bubblemaps price action has been climbing steadily since early June after establishing a strong base above the $0.09 zone. The daily chart confirms a triangle breakout with a bullish bias. Price has cleared multiple EMAs including the 20/50/100-day clusters, with the 200-day EMA now acting as dynamic resistance near $0.147. This area coincides with the upper Bollinger Band, capping price for now.
BMT price dynamics (Source: TradingView)
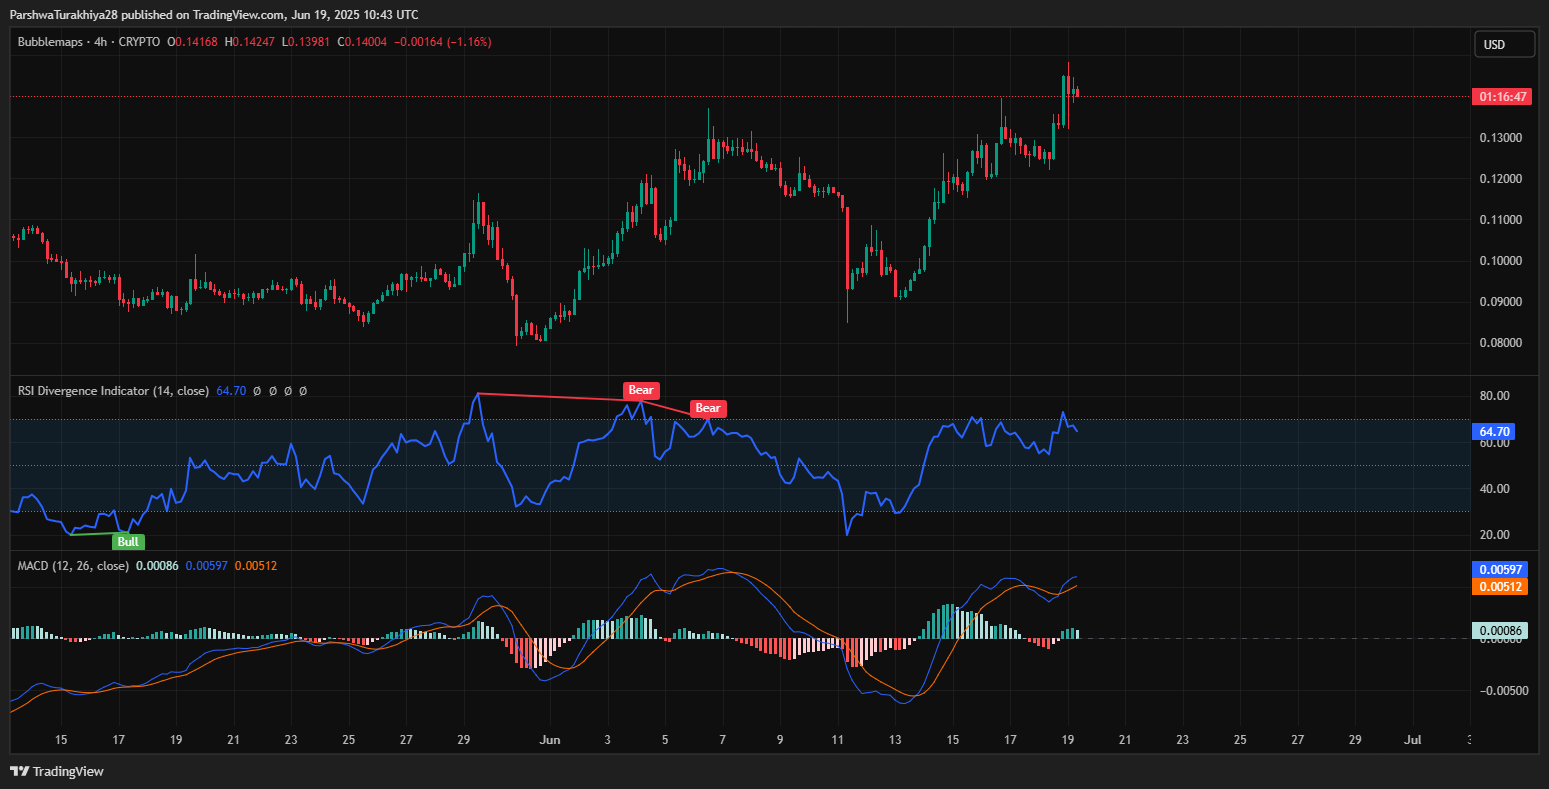
MACD on the 4-hour chart is still bullish but beginning to flatten, with histogram momentum fading slightly. RSI is hovering near 64.70 and remains elevated, but a bearish divergence spotted earlier this month is a caution flag for overextension. Volatility, however, has expanded, with Bollinger Bands widening—suggesting continuation rather than exhaustion.
Why Bubblemaps Price Going Up Today? Strength Above Key Structure
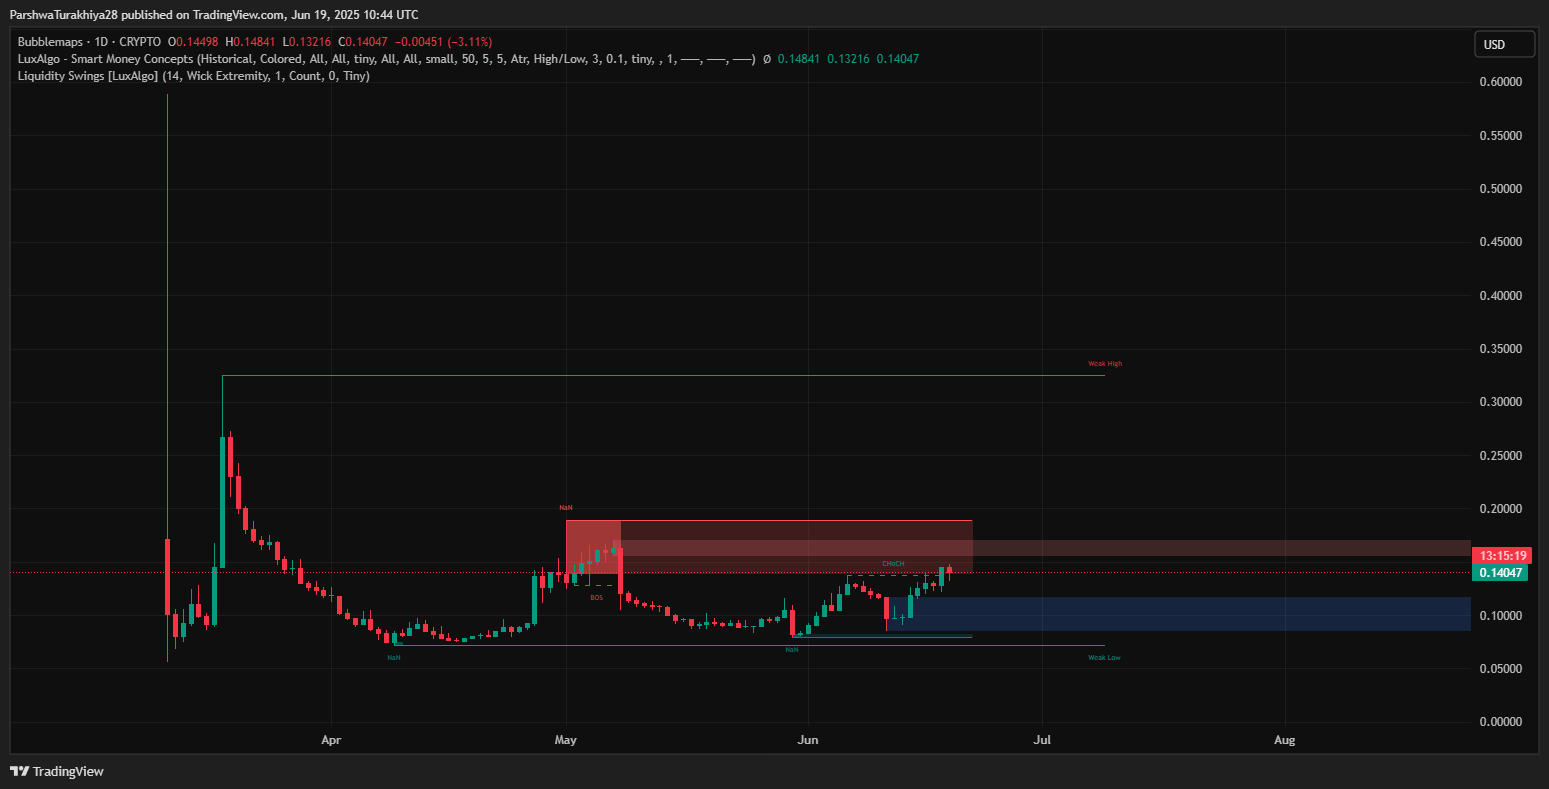
The question is: Why Bubblemaps price going up today despite overbought conditions on shorter timeframes? The answer lies in the clean structural breakout, confirmed by Smart Money Concepts and trendline breaks. A bullish CHoCH (Change of Character) occurred above $0.11, followed by a BOS (Break of Structure), indicating institutional-level accumulation.
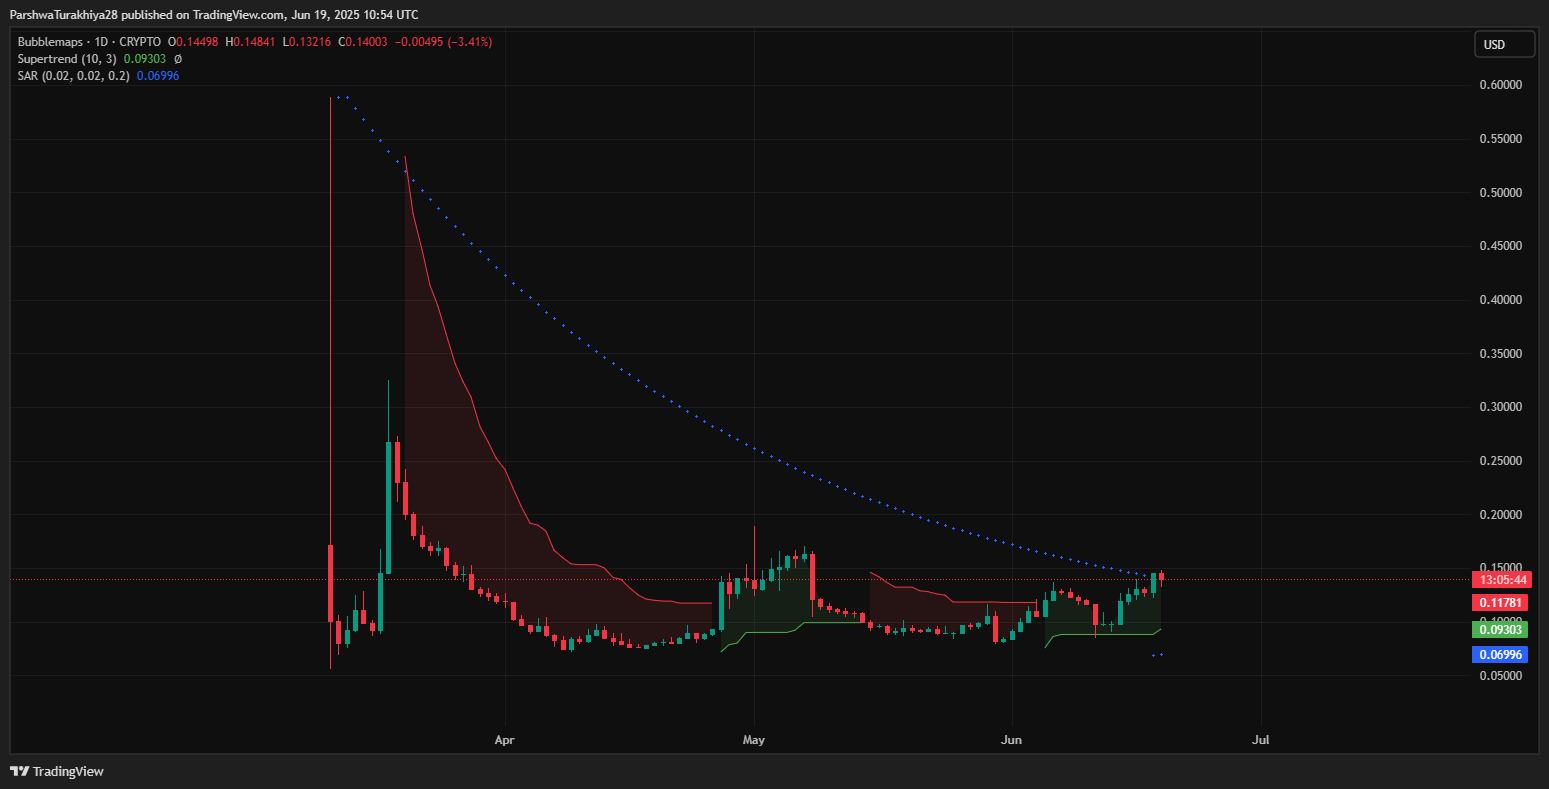
Price also broke above the key supply zone between $0.128 and $0.144, previously acting as a ceiling throughout May. This breakout came with expanding volume and a bullish flip in the Supertrend indicator on the daily chart. Furthermore, the Awesome Oscillator remains positive, and the Chande Momentum Oscillator is above 30, supporting bullish sentiment.
From a volume profile perspective, BMT has cleared the high-volume node near $0.115, with the next major cluster developing around $0.198 to $0.20—a potential year-end magnet level.
Bubblemaps Price Update: Range Expansion in Play
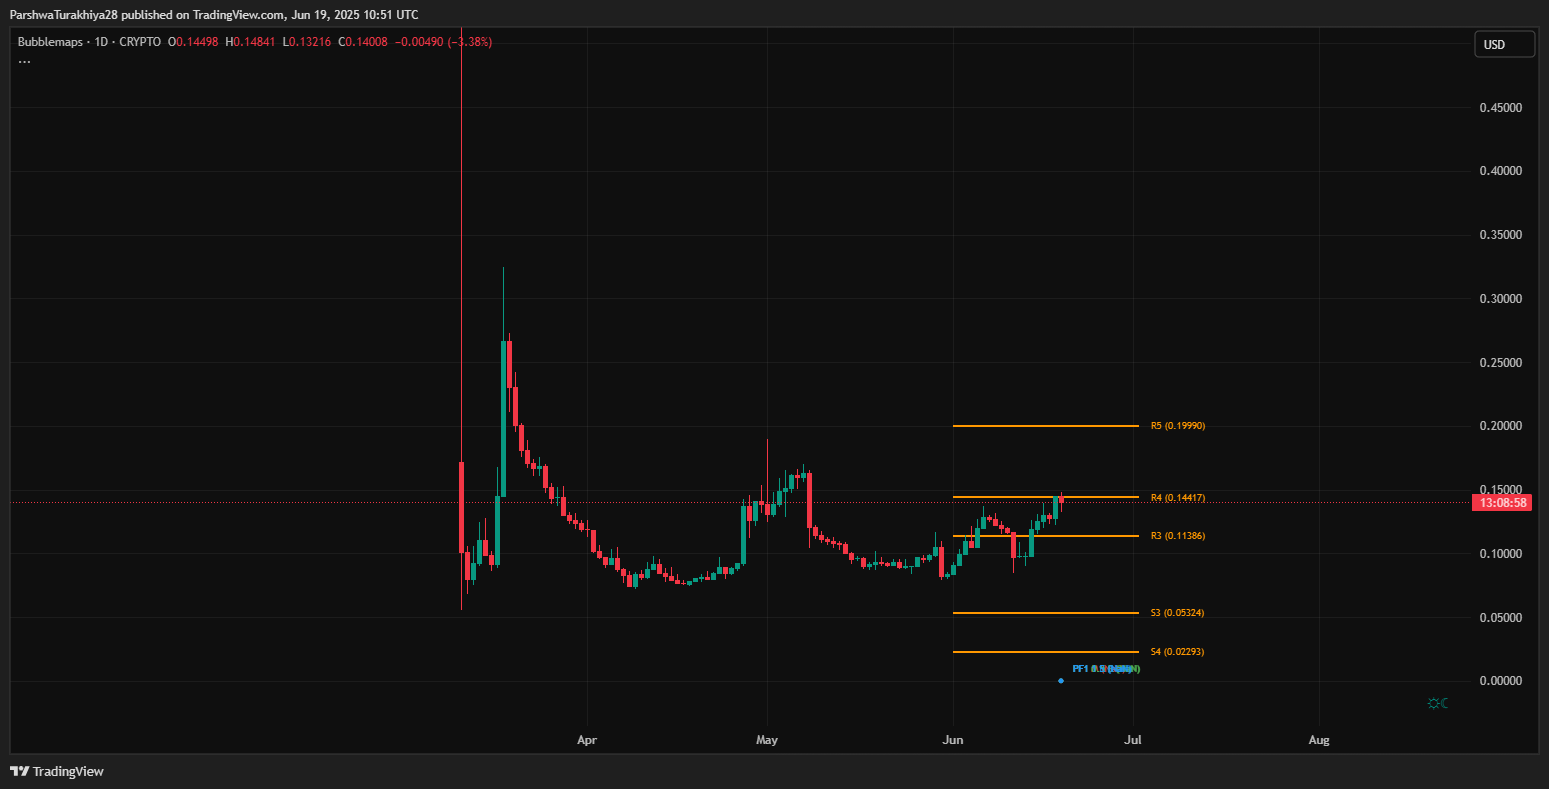
The current Bubblemaps price update suggests short-term consolidation just below $0.15, but momentum remains constructive. On the higher timeframe, Fibonacci extensions place R4 and R5 targets at $0.1441 and $0.1999, respectively. A daily close above $0.144 would confirm this move and likely ignite a second wave toward the $0.20 psychological level.
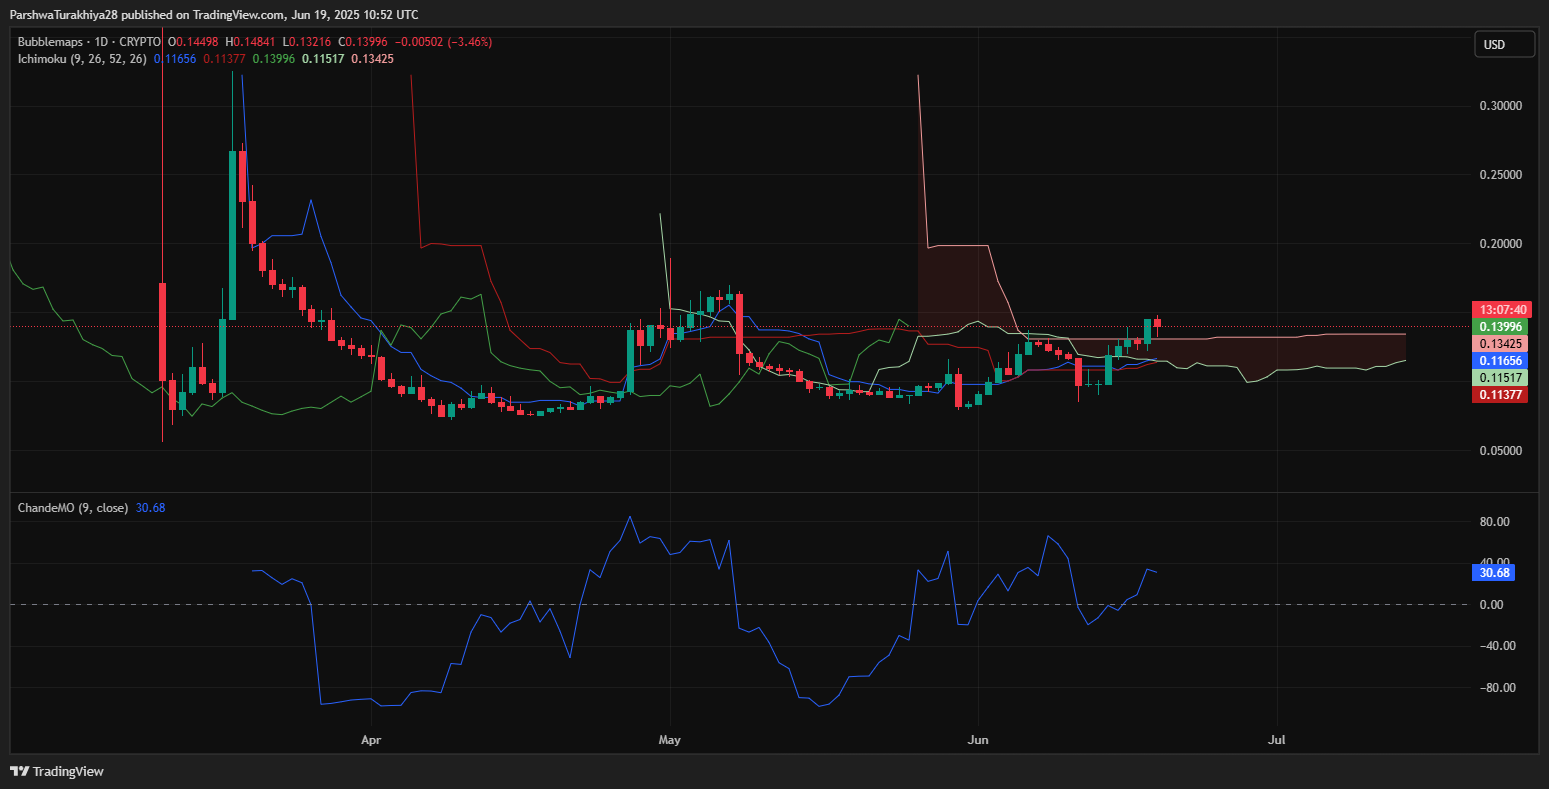
Support remains well-defined at $0.113 (bullish order block) and $0.096 (previous breakout base). Any pullback toward these zones is likely to attract dip-buyers, especially with price now above the Ichimoku Cloud base and leading indicators flashing green.
Bubblemaps (BMT) Price Forecast for 2025: Road to $0.20 and Beyond?
Looking further into 2025, the yearly outlook favors a bullish continuation, provided broader crypto sentiment remains neutral to positive. If bulls maintain control above the $0.14–$0.15 breakout band, price could attempt a retest of the $0.20–$0.22 region, followed by a longer-term target near $0.30, aligned with the weak high marked in Smart Money Concept zones.
However, the rally remains fragile without sustained volume. RSI divergences and weakening MACD crossovers may suggest intermittent corrections. Traders should also watch for reaction around the Bollinger midline ($0.115), which has historically acted as a key trend-defining level.
Technical Forecast Table: Bubblemaps (BMT) Price 2025 Outlook
| Indicator/Zone | Level (USD) | Signal |
| Resistance 1 (R4 Pivot) | 0.1441 | Immediate breakout zone |
| Resistance 2 (R5 Pivot) | 0.1999 | Year-end target |
| Resistance 3 (Weak High) | 0.30 | Extended bullish target |
| Support 1 (Order Block) | 0.1130 | Short-term demand |
| Support 2 (Breakout Base) | 0.0963 | Structural support |
| Support 3 (Trendline) | 0.0849 | Triangle retest zone |
| 20/50/100/200 EMA | 0.113–0.118 | Bullish cross confirmation |
| RSI (4H) | 64.70 | Slightly overbought |
| MACD | Bullish | Momentum positive but flat |
| Bollinger Bands (Daily) | Expanding | Range breakout confirmation |
| Supertrend (Daily) | 0.0930 | Bullish |
| Ichimoku Kumo (Daily) | Supportive | Price above cloud |
| Volume Profile HVN | 0.198 | Magnet target zone |
Disclaimer: The information presented in this article is for informational and educational purposes only. The article does not constitute financial advice or advice of any kind. Coin Edition is not responsible for any losses incurred as a result of the utilization of content, products, or services mentioned. Readers are advised to exercise caution before taking any action related to the company.
 Price Prediction 2025, 2026, 2027-2030")

 Price Prediction for August 2")
 Price Prediction for August 2")
 Price Prediction for August 2")
