
 Price Prediction For June 21 2025")

The Dogecoin price today is trading around $0.1703 after recovering slightly from recent lows near $0.1670. Despite this minor uptick, DOGE remains stuck in a broader downtrend, having lost over 20% from its recent swing high above $0.2135 earlier this month. Traders are closely watching whether current signals point to an imminent reversal or a continuation of the bearish cycle.
Why Dogecoin Price Going Down Today?
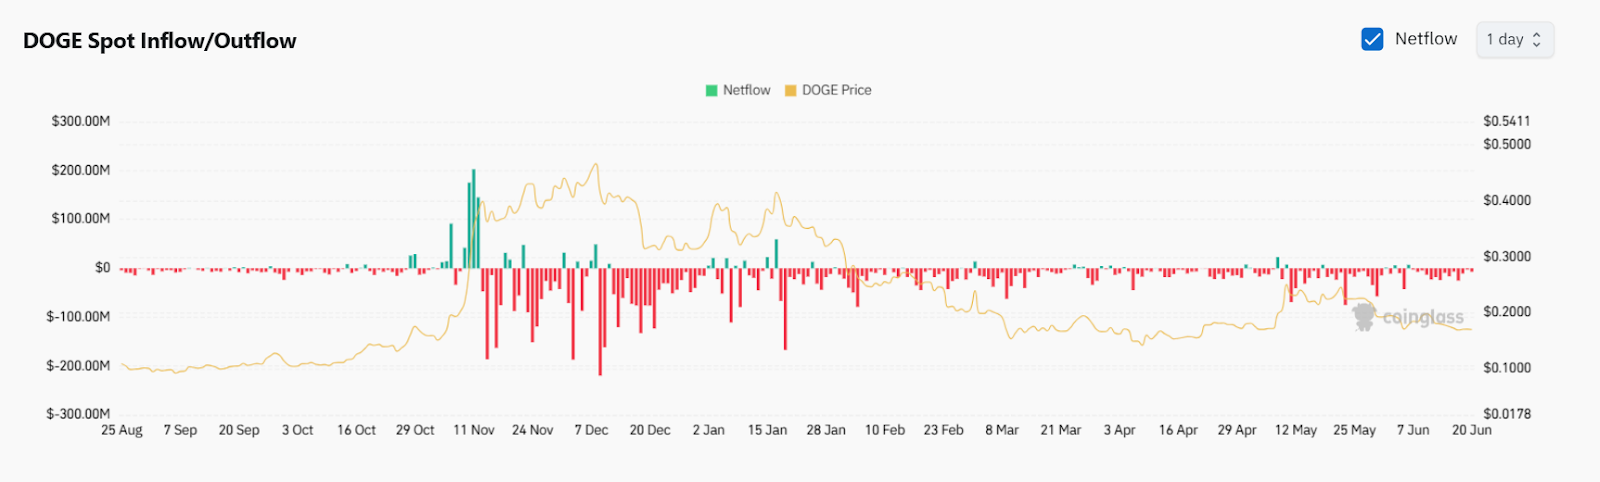
The question of why Dogecoin price going down today can be examined through both on-chain activity and technical structures. According to Coinglass, Dogecoin has witnessed exchange net outflows exceeding $38 million over the past 48 hours. Historically, large-scale outflows are considered a positive signal as they indicate reduced sell-side liquidity and potential accumulation by long-term holders. However, in the current context, this has not yet translated into upward price pressure.
This divergence between exchange behavior and price movement reflects market hesitation. On-chain participants may be reducing exposure on exchanges, but without strong demand or breakout signals, the Dogecoin price remains under pressure near the $0.17 zone.
What’s Happening With Dogecoin’s Price?

Technically, the Dogecoin price action is compressing within a narrowing triangle on the 4-hour chart. Price remains capped under a key trendline near $0.1787 while consolidating just above support at $0.1645. This level also coincides with a high-volume demand zone that has been defended multiple times since April.
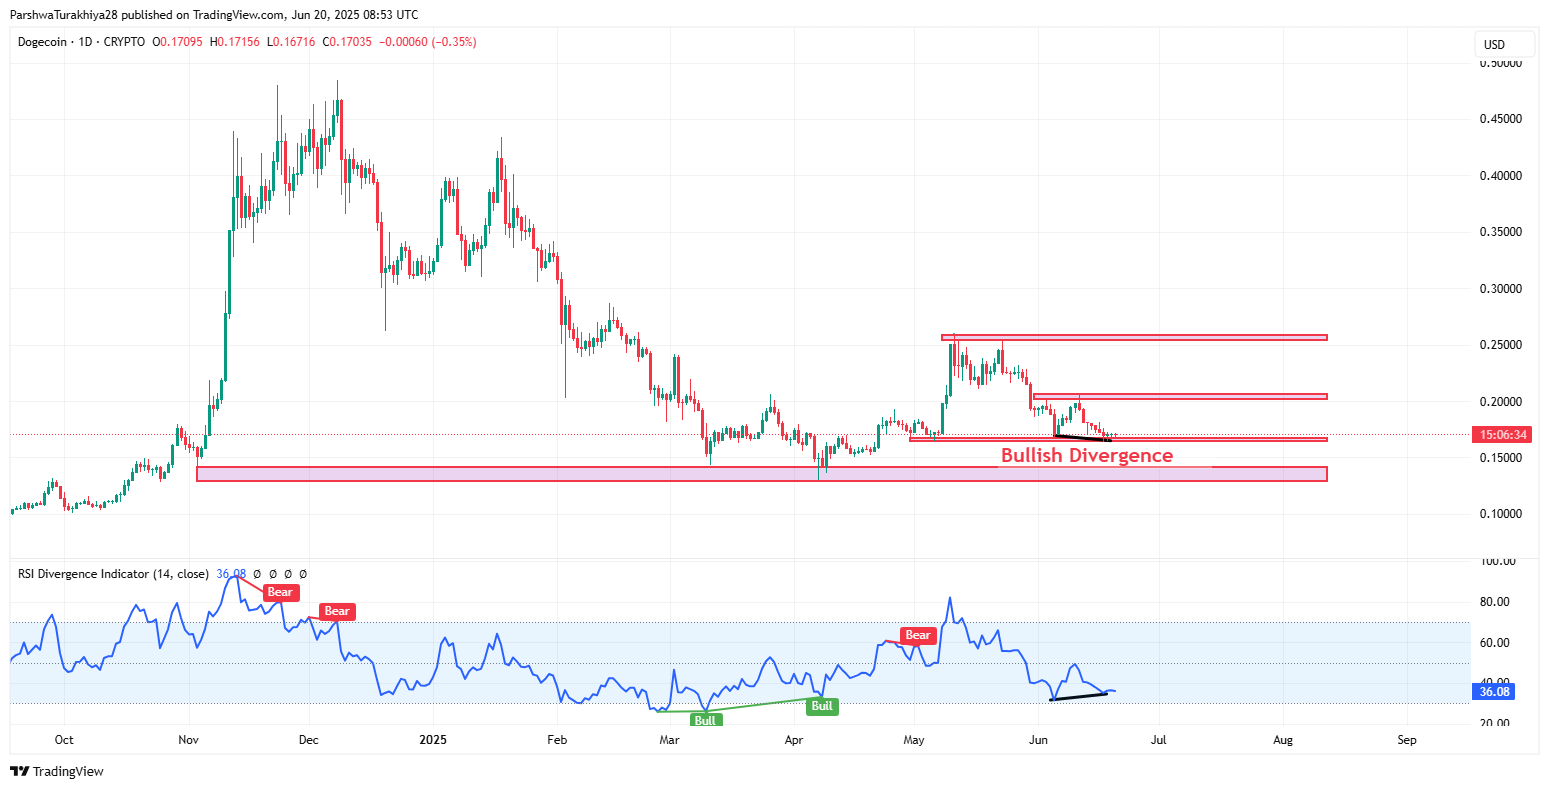
A notable bullish divergence has emerged on the daily RSI (14), where price has made lower lows but RSI has started printing higher lows. Currently at 36.08, RSI sits in the oversold zone, further signaling potential for a short-term bounce. A confirmed close above the trendline resistance could open the door toward $0.1820 and potentially $0.1950 in the coming sessions.
Dogecoin (DOGE) Price: Bollinger Bands, EMAs, and Supertrend Structure
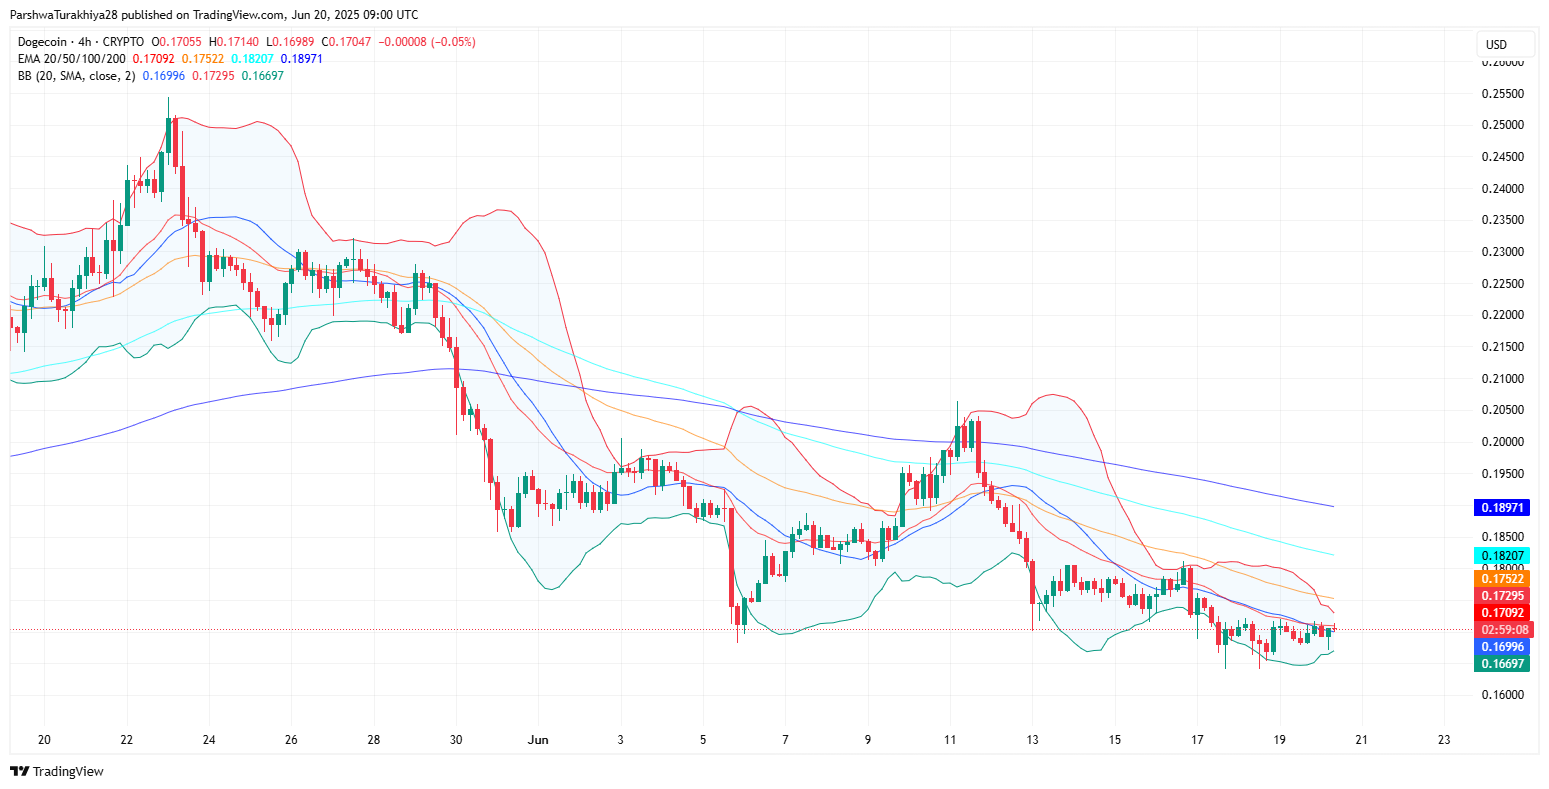
Looking at the Bollinger Bands on the 4-hour timeframe, the Dogecoin price today is hovering just below the midline (SMA 20), with the upper band near $0.1830 and the lower band around $0.1670. The squeeze in the bands suggests reduced Dogecoin price volatility, which often precedes a sharp move. If price manages to break above the midline decisively, the next logical target would be the upper band.
EMA levels also present a layered ceiling. The 20/50/100/200 EMA cluster sits between $0.1709 and $0.1897. This means DOGE must reclaim this zone to build a sustainable bullish structure. As of now, price is still trading below all key EMAs, which maintains a short-term bearish bias until a reversal is confirmed.
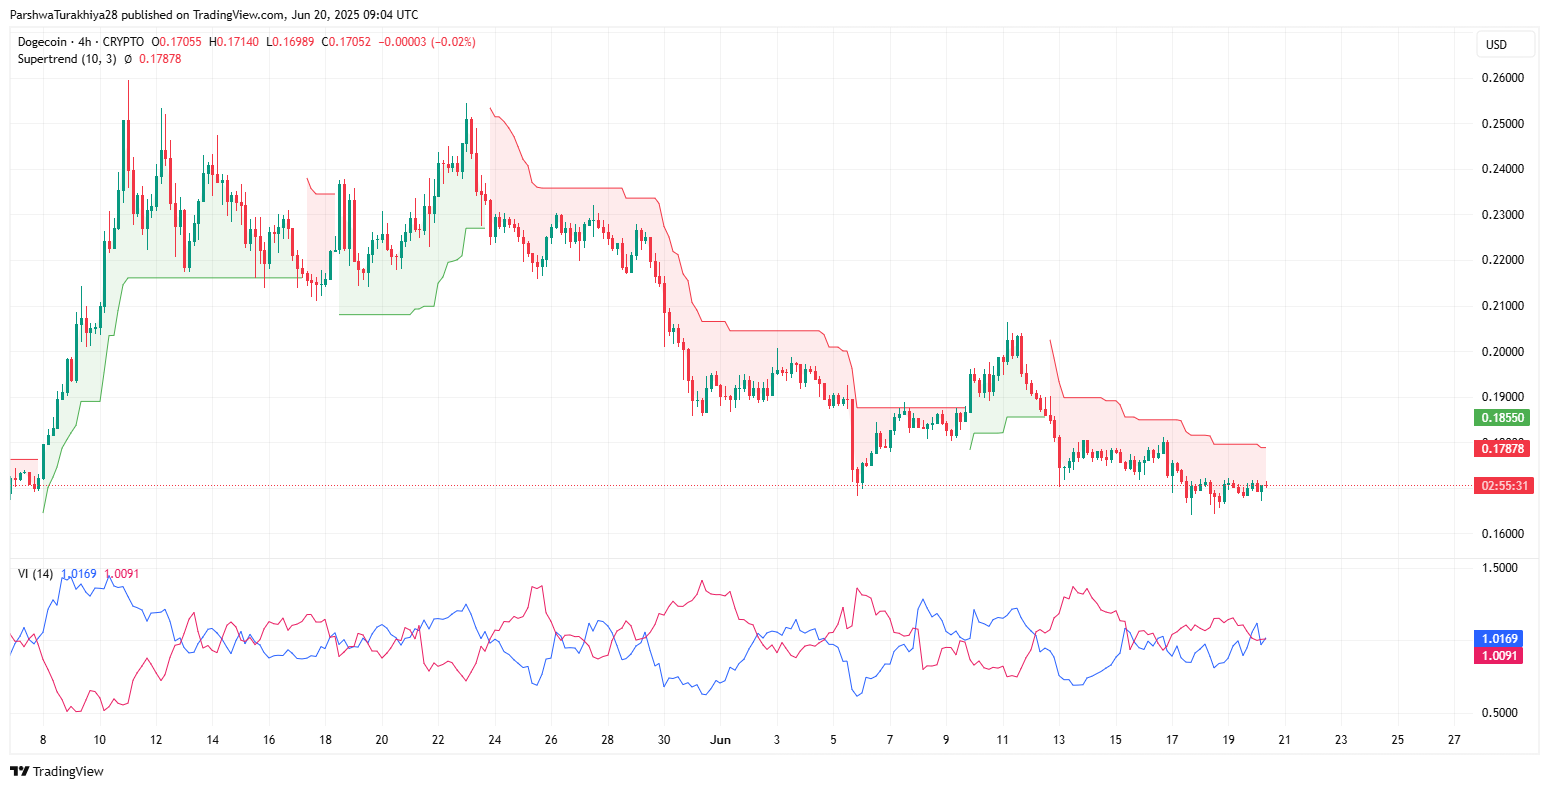
The Supertrend indicator on the 4-hour chart remains in red, with the trailing stop at $0.1787. This level now becomes a critical invalidation zone for short positions and a breakout threshold for bullish momentum.
Dogecoin (DOGE) Price Prediction: Smart Money and Liquidity Outlook

From a Smart Money Concepts (SMC) perspective, DOGE remains stuck between equal highs and equal lows. The recent break of structure (BOS) near $0.1650 has not seen aggressive follow-through, suggesting that large players are likely waiting for liquidity collection before initiating a directional move.
Liquidity zones remain stacked near $0.1880 and $0.2100 on the upside, and $0.1640 and $0.1480 on the downside. Until one of these boundaries is breached with volume, DOGE may continue to range in a low-volatility chop.
Dogecoin (DOGE) Price Prediction: RSI, MACD, and Momentum Indicators
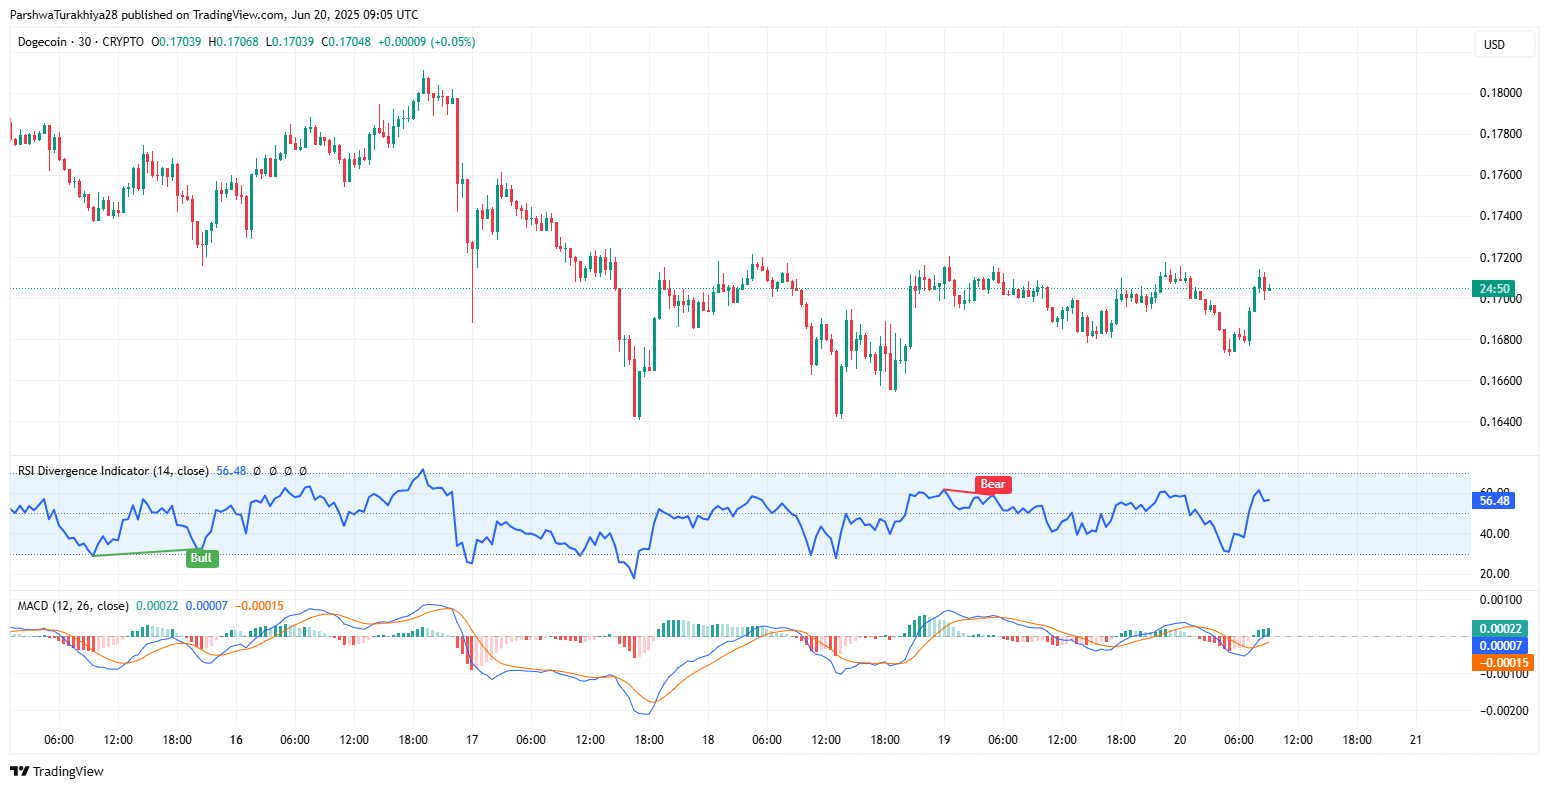
On the 30-minute chart, the RSI is currently at 56.48 after recovering from sub-40 levels. MACD has recently flipped bullish with a minor crossover, although momentum remains weak and unconvincing. This aligns with the broader narrative that while local bounces are possible, strong trend continuation is lacking without higher volume participation.
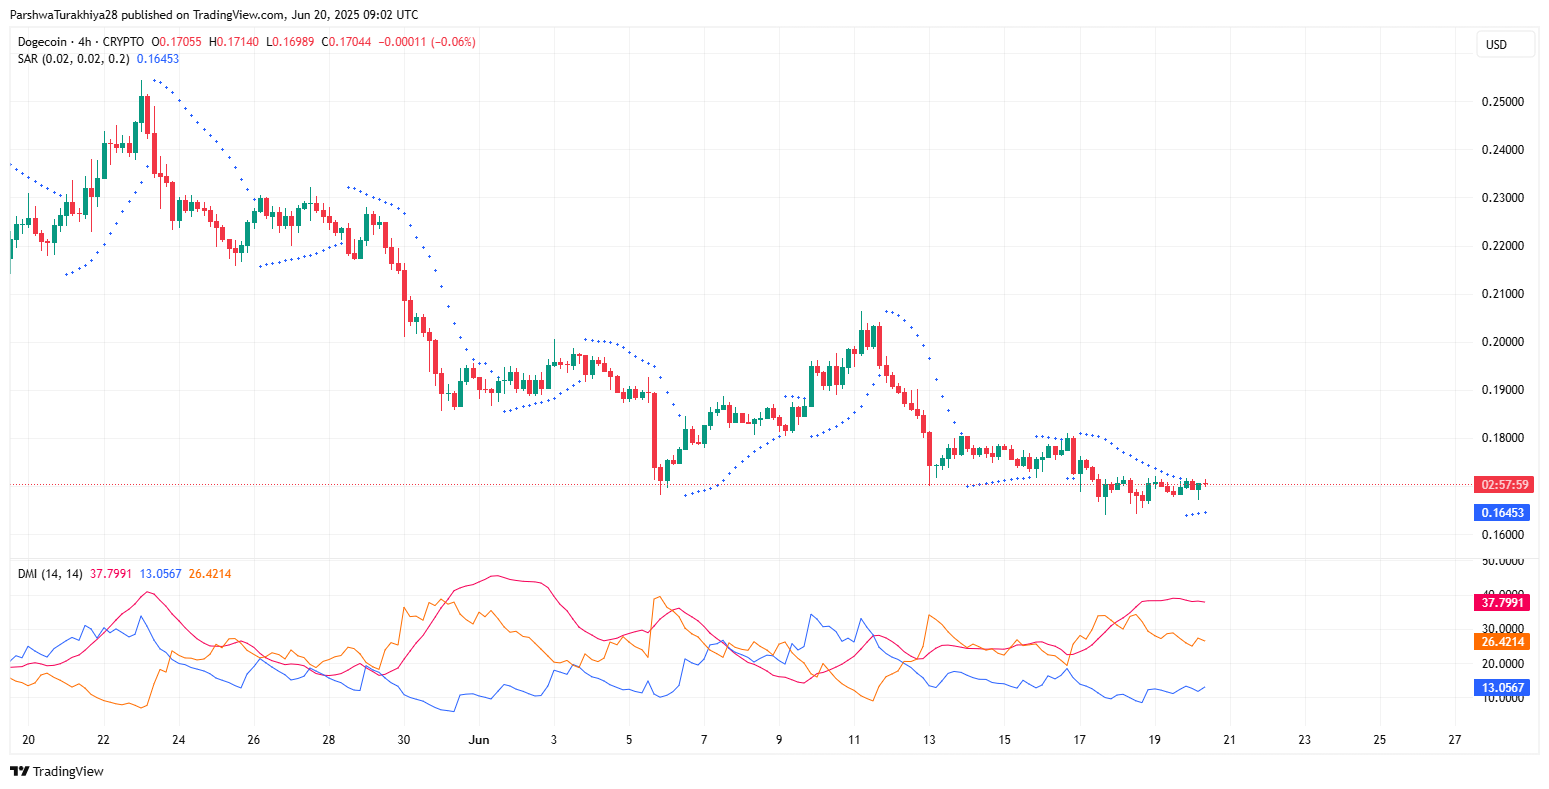
Directional Movement Index (DMI) on the 4-hour chart also paints a mixed picture. The ADX remains subdued below 20, indicating that the current trend lacks strength. Unless either the +DI or -DI begins to expand, Dogecoin price spikes are likely to remain limited to short intraday swings.
Short-Term Dogecoin Price Forecast
Overall, Dogecoin price update suggests a cautiously neutral bias heading into June 21. Key support at $0.1640 must hold to prevent a deeper retest toward $0.1500. On the upside, any breakout above $0.1785 could attract short-term traders, with $0.1880 and $0.1950 as potential resistance zones.
Dogecoin (DOGE) Forecast Summary Table
| Technical Indicator | Status |
| 4H RSI | Bullish divergence at 36.08 |
| MACD | Weak bullish crossover |
| Bollinger Bands | Volatility squeeze forming |
| Supertrend (4H) | Bearish below $0.1787 |
| Key Support | $0.1645 and $0.1500 |
| Key Resistance | $0.1785, $0.1880, $0.1950 |
| Netflow | -$38M (48hr outflows) |
Disclaimer: The information presented in this article is for informational and educational purposes only. The article does not constitute financial advice or advice of any kind. Coin Edition is not responsible for any losses incurred as a result of the utilization of content, products, or services mentioned. Readers are advised to exercise caution before taking any action related to the company.
 Price Prediction For June 21 2025")
 Price Prediction For June 21 2025")

 Price Prediction for June 21, 2025")
 Price Prediction 2025: Road to $0.20 and Beyond?")
