


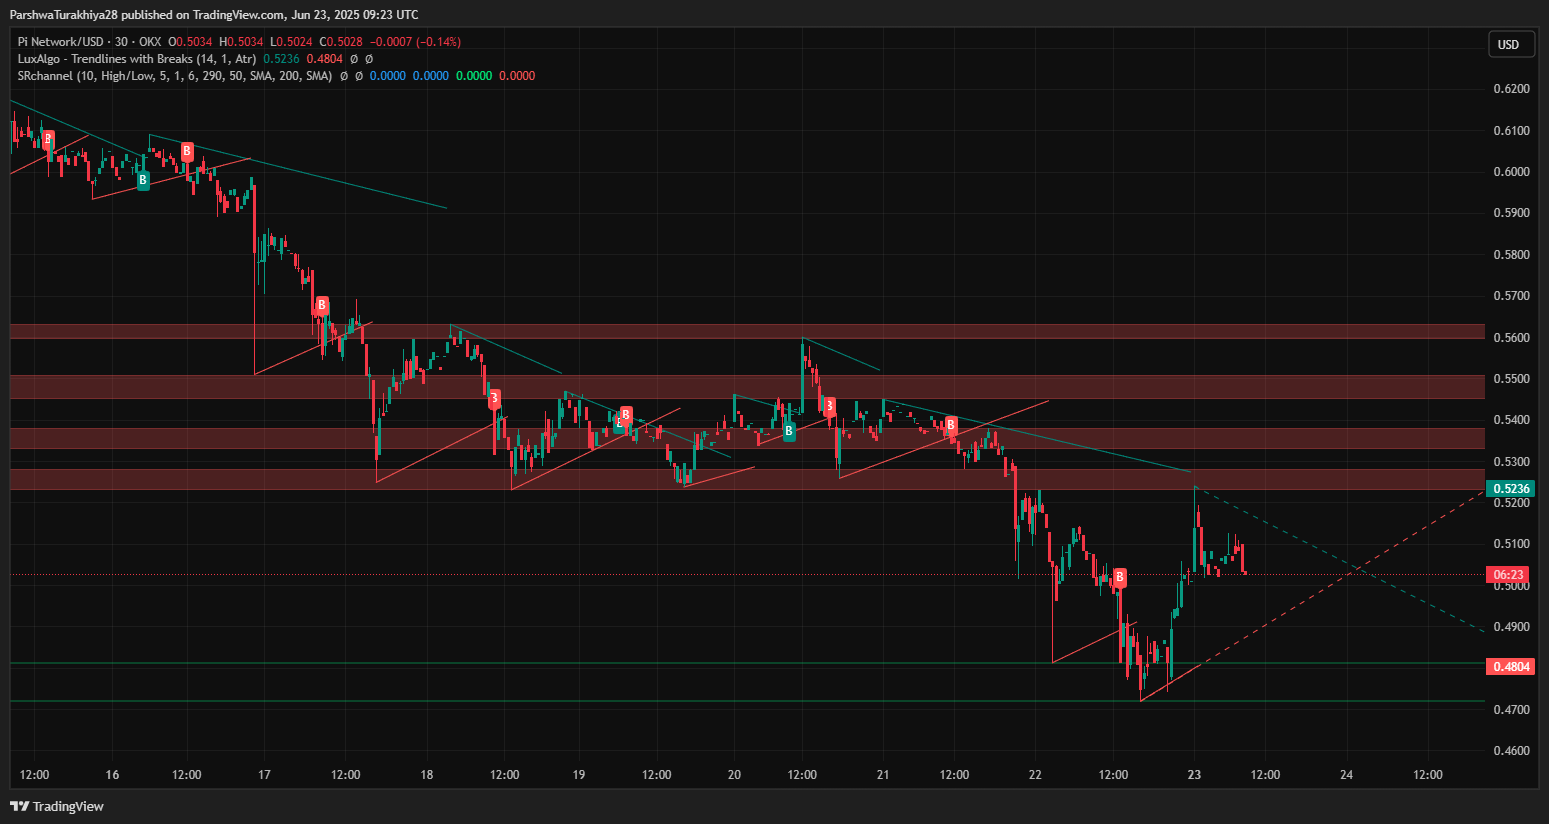
The Pi Network price today is hovering near $0.502, showing signs of fatigue after a short-lived recovery attempt from the $0.48 low. While short-term buyers attempted to reclaim momentum, the overall Pi Network price action remains firmly under bearish control, with multiple resistance rejections and breakdown structures visible across all timeframes.
What’s Happening With Pi Network’s Price?
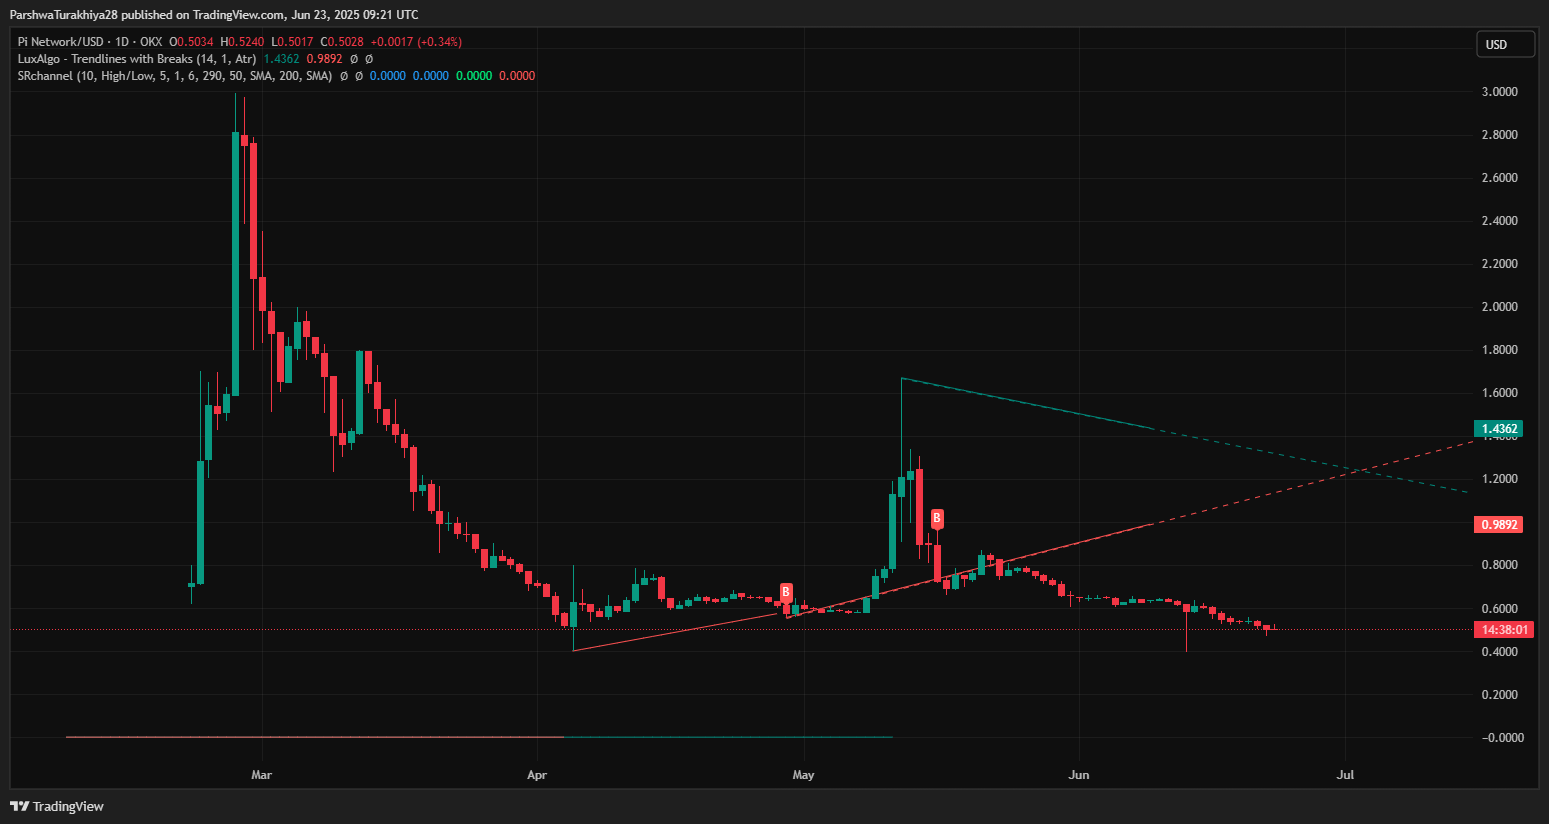
The daily chart shows a prolonged downtrend since the $3.00 high in March, with price now consolidating below both dynamic and structural resistance. The recent rejection from $0.537 and failure to close above $0.5896 reinforces the ongoing bearish channel. Trendlines on the daily and 4-hour charts confirm lower highs and descending volume, while liquidity pockets above remain untapped.
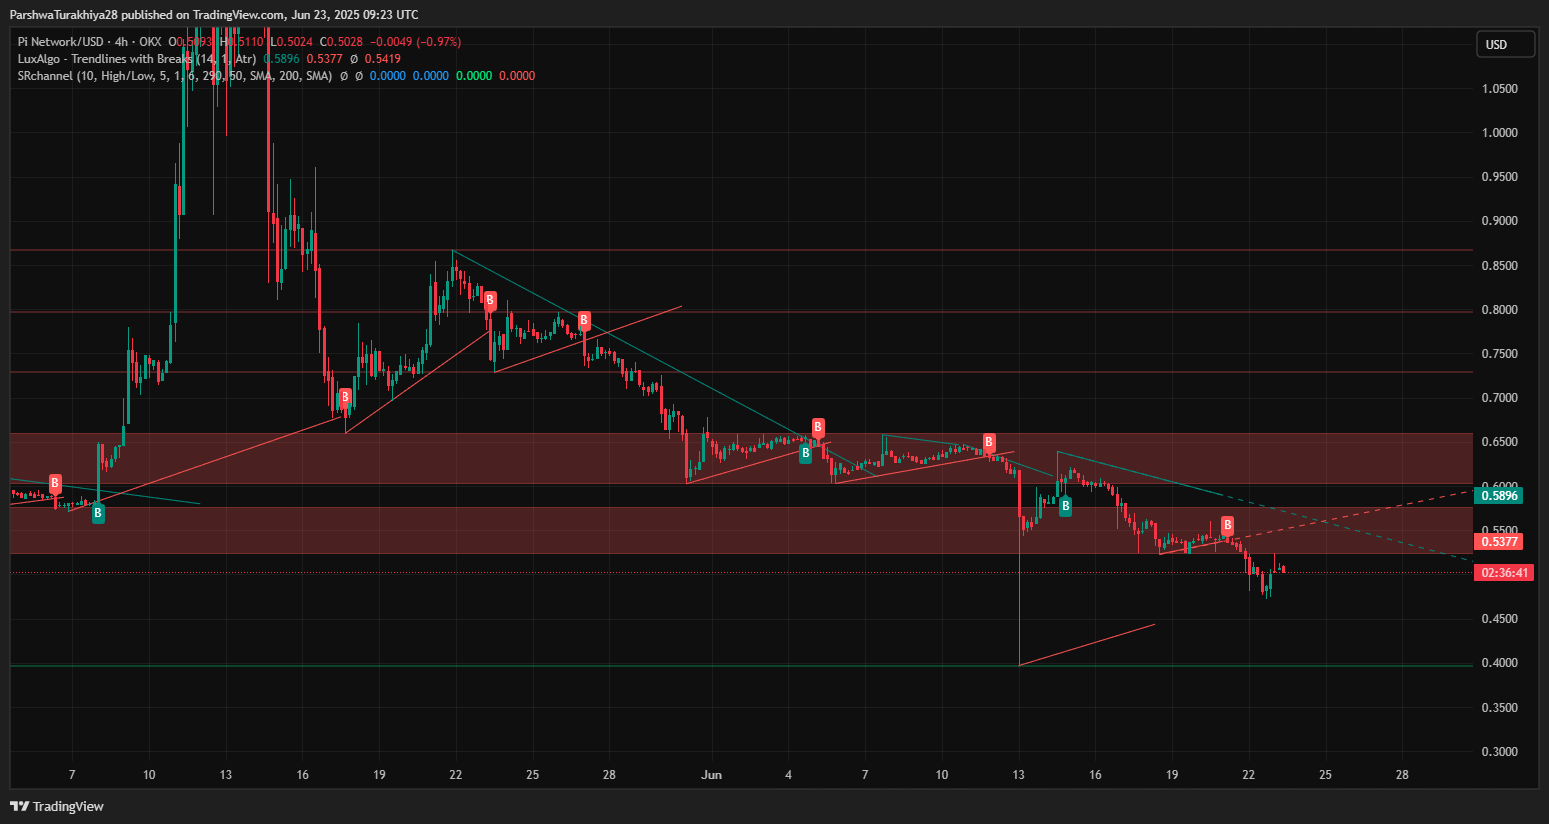
On the 4-hour timeframe, PI formed a failed breakout from a descending wedge, followed by a rejection at $0.537 and a breakdown into the lower support zone near $0.48. The price remains trapped within a compression zone, failing to sustain any bullish flag formations. Liquidity SMC zones are now stacked between $0.520 and $0.550 — strong resistance areas for any upside attempt.
Why is the Pi Network Price Going Down Today?
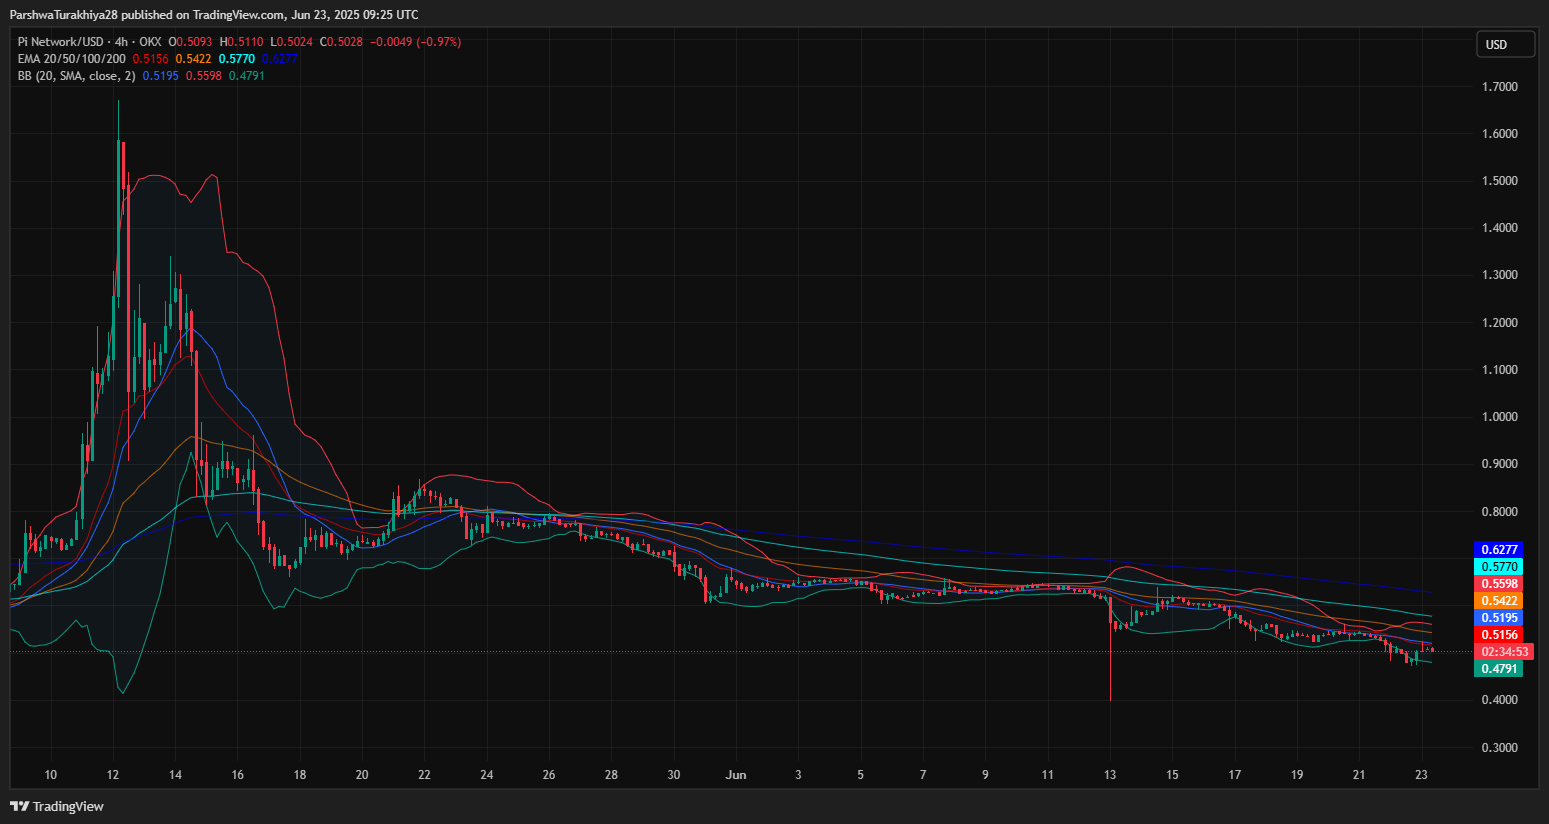
Multiple technical indicators explain why Pi Network price going down today. First, the 4-hour EMA cluster (20/50/100/200) shows a tight bearish alignment, with resistance between $0.515 and $0.577. Price is struggling below the 20 EMA at $0.5156 and remains squeezed under descending Bollinger Bands, signaling low Pi Network price volatility and trend exhaustion.

The 30-minute chart shows a weakening RSI around 50.27 after hitting a local overbought zone earlier in the session. MACD is crossing bearishly again, with histogram momentum fading — indicating a likely pause or pullback. Simultaneously, a strong SMC supply block around $0.520–$0.537 is actively rejecting recovery attempts.
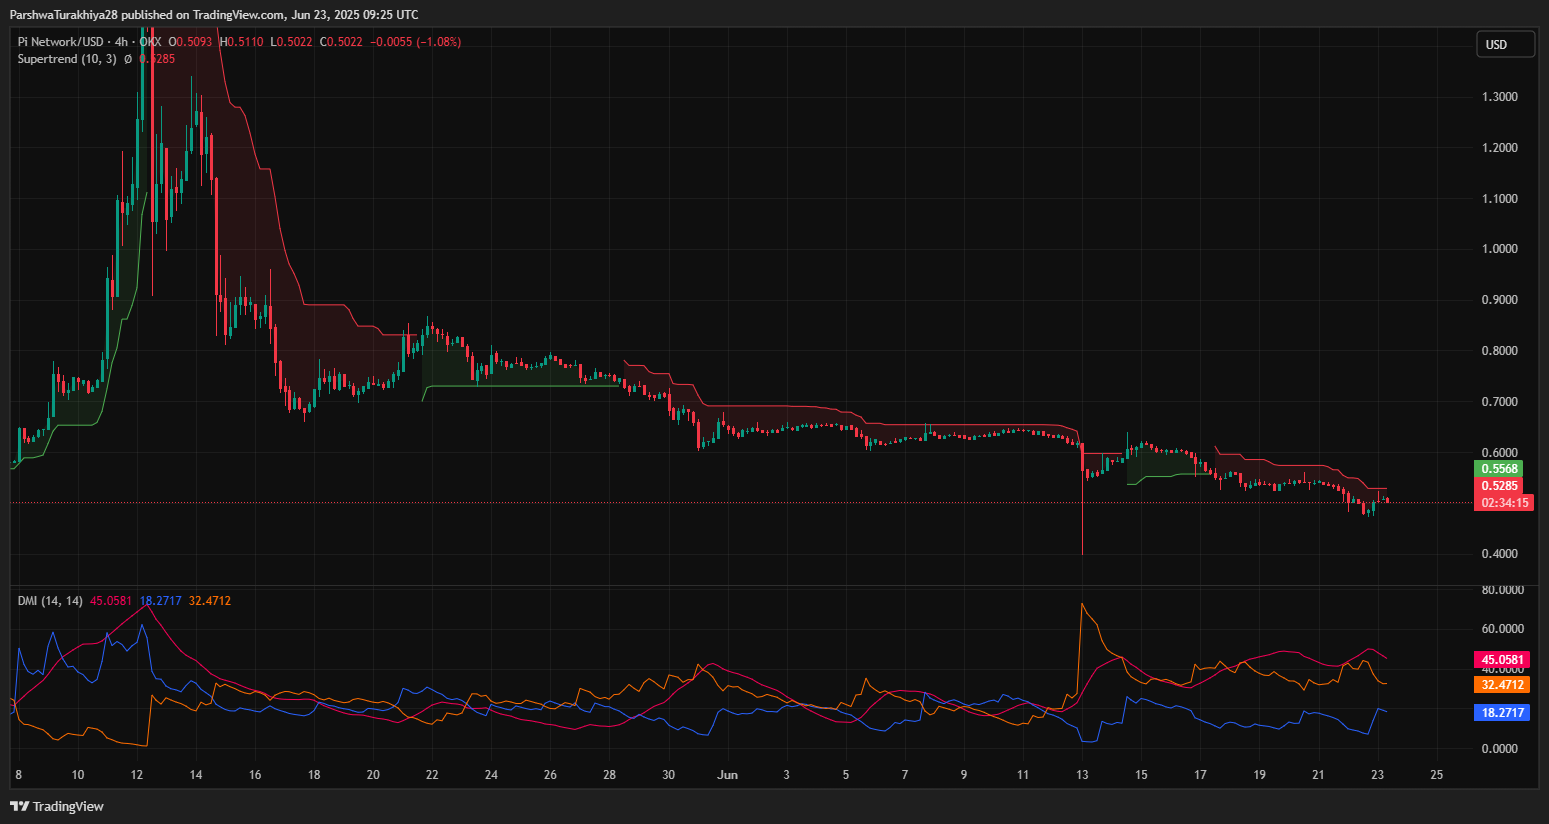
The Supertrend indicator remains bearish on the 4-hour chart, positioned at $0.5285. Unless PI closes decisively above this line, sellers will likely continue dominating the structure. DMI shows rising ADX (32.47) with -DI leading at 45.05, confirming trending downside momentum.
Pi Network Price Forecast and Short-Term Outlook
As of now, PI is attempting to hold above $0.50, which is acting as a round-number support zone. A breakdown below $0.48 could open the door toward the previous wick low near $0.445 or even deeper inefficiencies at $0.42–$0.40. On the upside, only a sustained breakout above $0.537 with volume confirmation could shift sentiment.

Structure-wise, the 30-minute chart shows a wedge forming between $0.480 and $0.523. If bulls manage to reclaim $0.520–$0.523 with bullish CHoCH and volume push, it could initiate a short-term bounce toward $0.550. However, broader pressure still weighs unless PI reclaims the $0.60 psychological level and clears the upper channel trendline.
Pi Price Forecast Table: June 24, 2025
| Indicator/Level | Value/Signal |
| Pi Network price today | $0.502 |
| Resistance 1 | $0.523 (short-term rejection zone) |
| Resistance 2 | $0.537–$0.550 (supply block) |
| Support 1 | $0.480 (trendline + liquidity) |
| Support 2 | $0.445 (wick low) |
| EMA 20/50/100/200 (4H) | Bearishly aligned |
| RSI (30-min) | 50.27 (neutral, declining) |
| MACD (30-min) | Bearish crossover, fading strength |
| Supertrend (4H) | Bearish under $0.5285 |
| VWAP | $0.503–$0.505 range-bound |
| DMI ADX (14) | ADX: 32.47, -DI leads at 45.05 |
| Bollinger Bands | Narrow, trending lower |
Disclaimer: The information presented in this article is for informational and educational purposes only. The article does not constitute financial advice or advice of any kind. Coin Edition is not responsible for any losses incurred as a result of the utilization of content, products, or services mentioned. Readers are advised to exercise caution before taking any action related to the company.
 Price Prediction 2025, 2026, 2027–2030")
 Price Prediction 2025, 2026, 2027–2030")
 Price Prediction for August 8")
 Price Prediction for August 8")
 Price Prediction for August 8")
