
 Price Prediction For June 25")

After a sharp rebound from the $100,000 region, the Bitcoin price today is trading near $105,400 as bulls attempt to regain control. The recovery follows a high-volume bounce from major demand zones, with momentum indicators pointing toward a potential short-term continuation. However, the price remains capped below a critical resistance band, creating a tight range heading into June 25.
What’s Happening With Bitcoin’s Price?
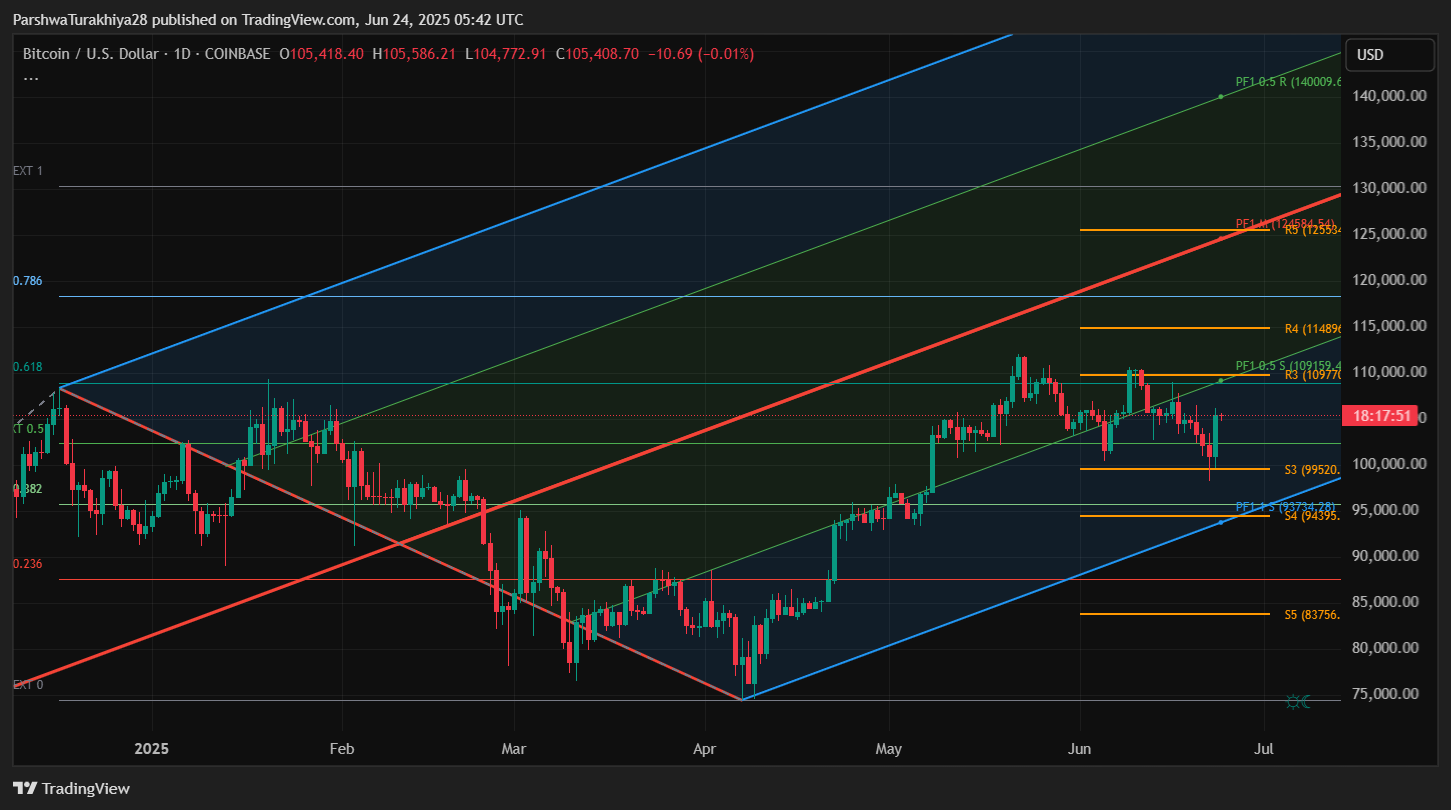
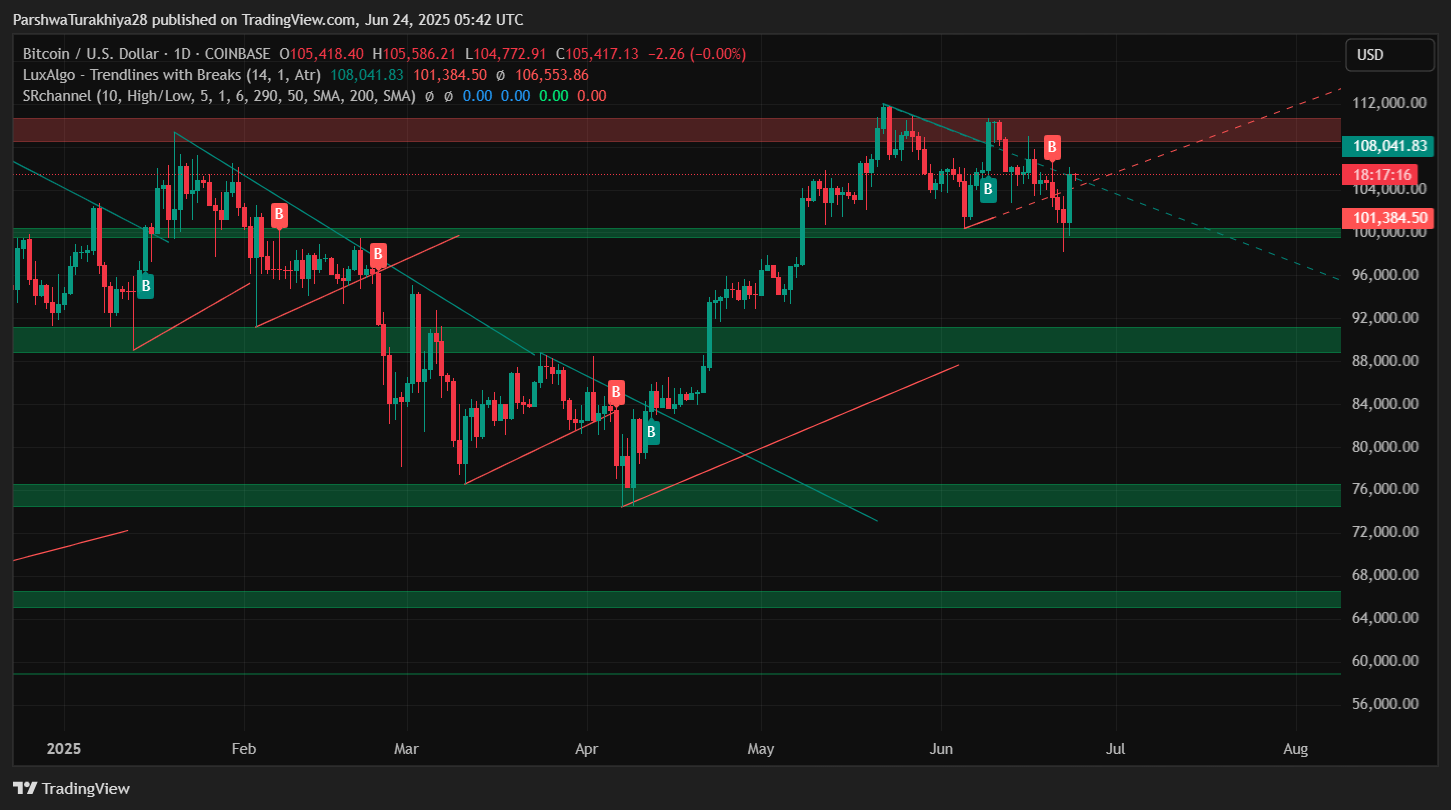
Bitcoin price action on the daily chart shows BTC moving within a medium-term ascending pitchfork. After breaking below mid-channel support earlier this week, bulls stepped in aggressively at the lower bounds near $100K. This level also aligns with the 38.2% Fibonacci retracement zone and prior breakout support.
The daily structure remains fragile, as price is now approaching key resistance levels between $106,000 and $108,000. This area overlaps with a Fibonacci pivot and prior rejection zone. Meanwhile, upside targets are visible at $109,150 and $114,890, both significant Fibonacci and pivot cluster zones. On the downside, $102,000 and $100,000 form crucial intraday support levels.
Why is the Bitcoin Price Going Up Today?
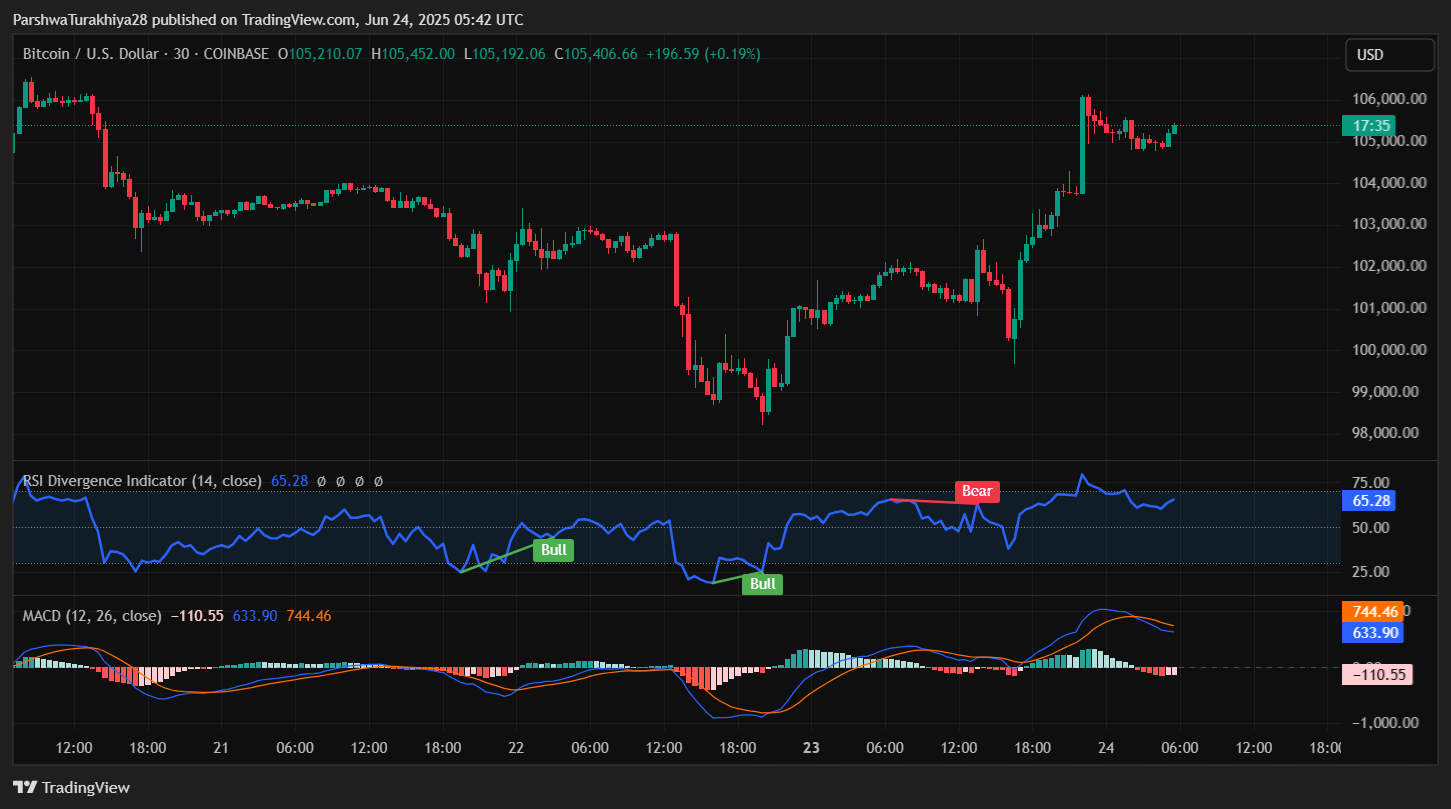
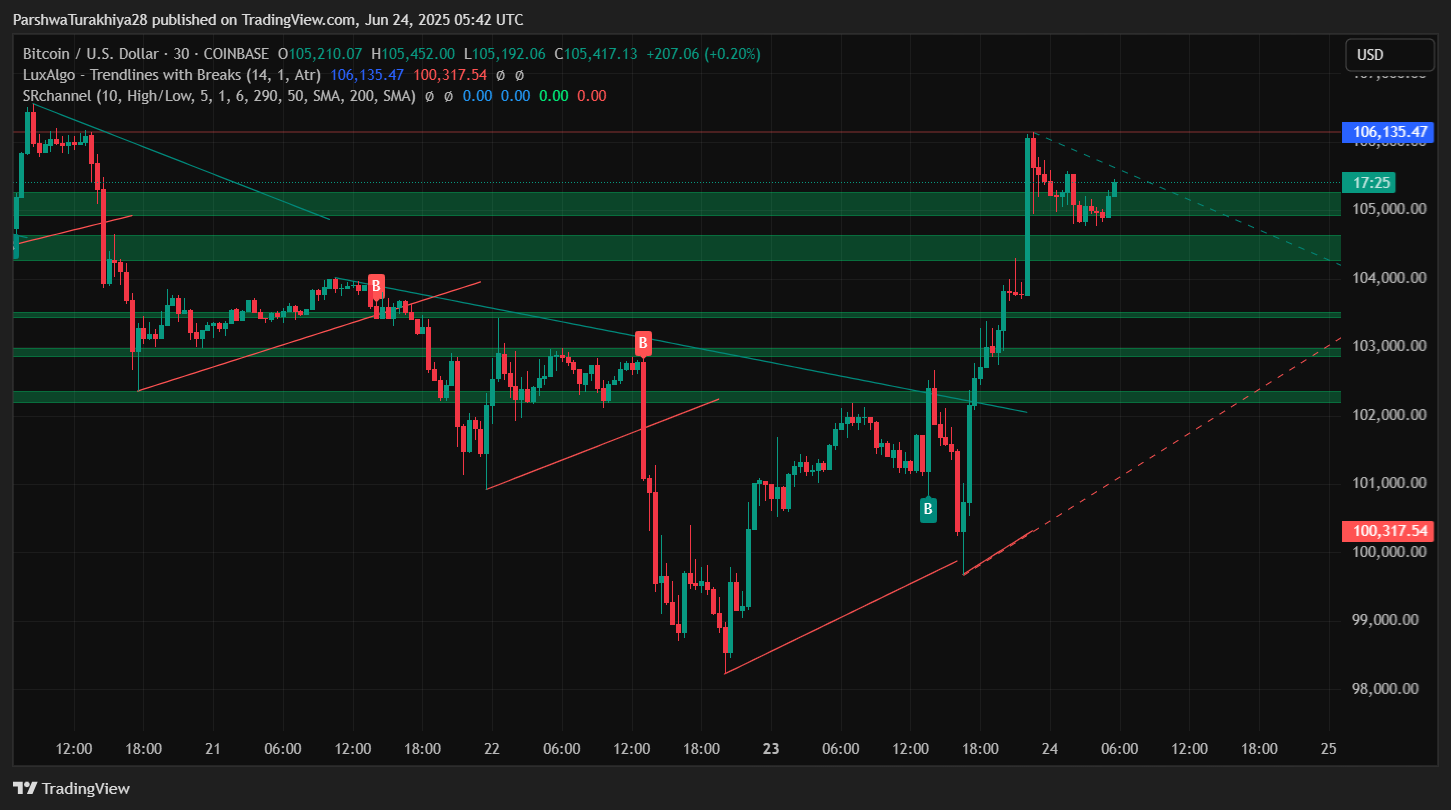
The Bitcoin price is rising today after rebounding strongly from the $100,000 psychological support zone, which coincided with a key demand region on the 4-hour chart. Several technical indicators are reinforcing this move. On the 30-minute chart, the Relative Strength Index (RSI) is holding near 65.28, reflecting sustained bullish momentum, though it is approaching short-term overbought territory.
Meanwhile, the MACD has confirmed a bullish crossover, with a rising histogram that points to strengthening upside pressure.

The Supertrend indicator on the 4-hour timeframe has also flipped bullish, placing dynamic support around $100,239. In addition, the Directional Movement Index (DMI) shows a clear improvement in buyer strength, with the +DI rising above the -DI line.
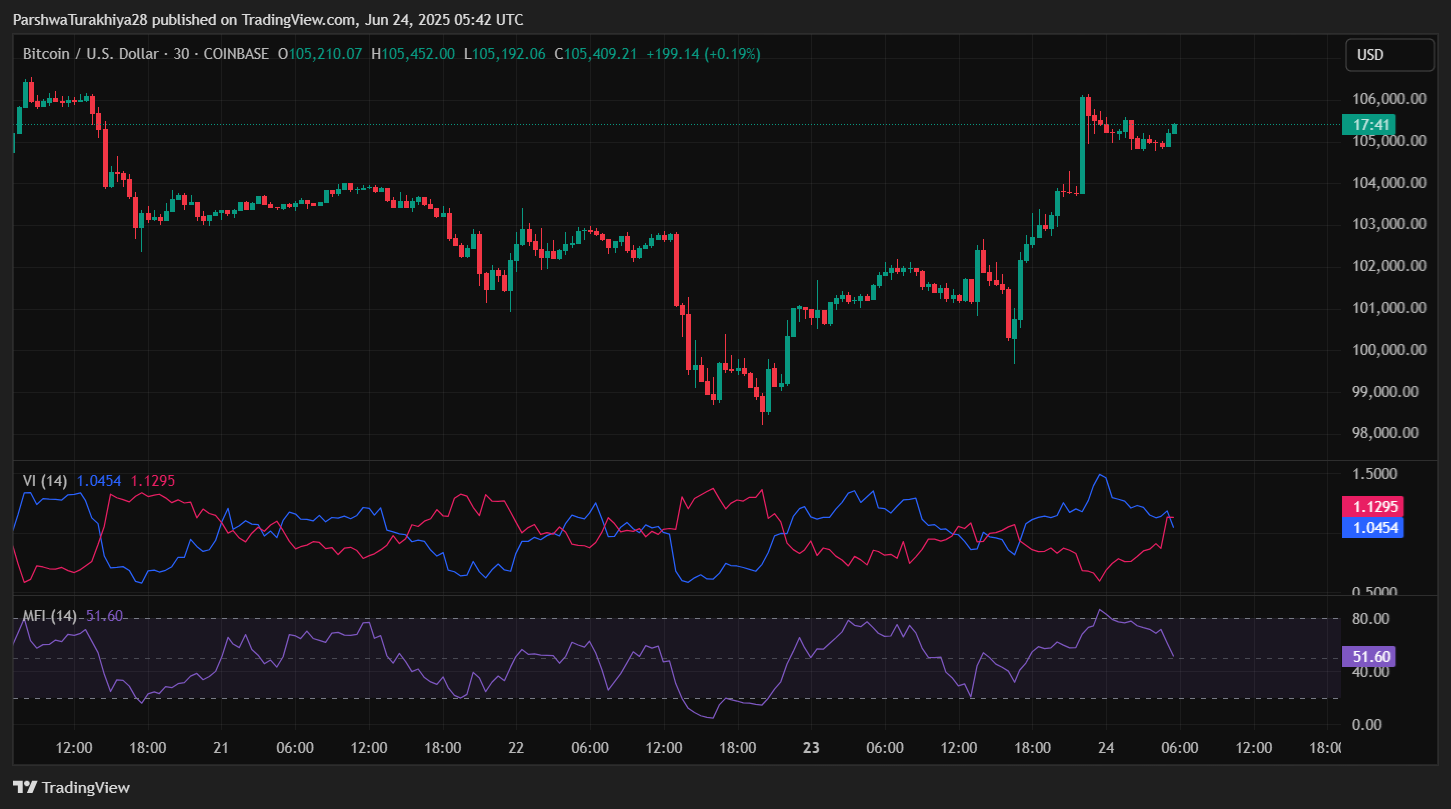
Money Flow Index (MFI) readings near 51.6 further support a shift toward positive capital inflows. Altogether, these signals validate the recovery from $100K and suggest that Bitcoin may attempt to challenge resistance near $106,000 if this momentum continues.
Bitcoin Price Volatility Builds Near Resistance
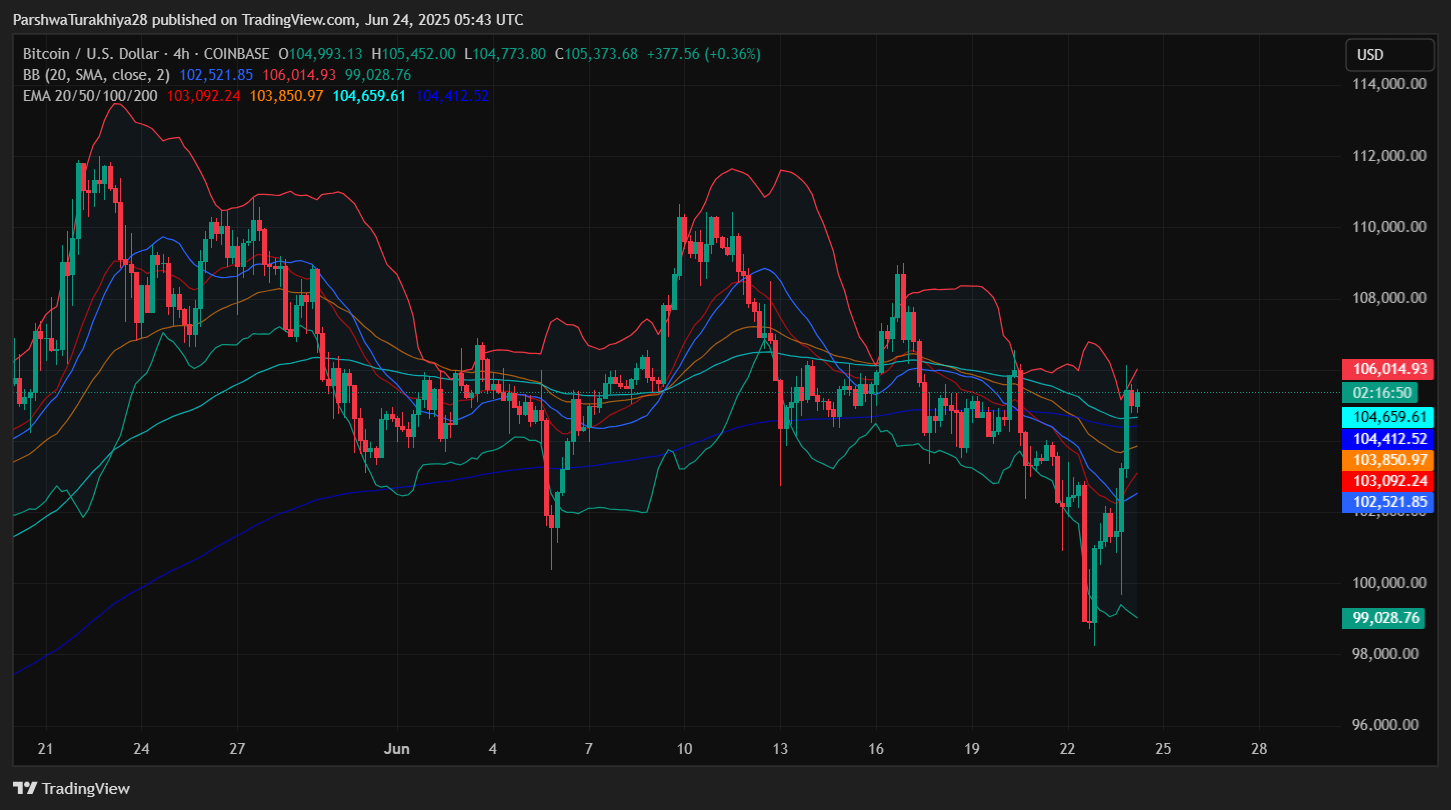
On the intraday chart, Bitcoin price volatility is expanding again. The Bollinger Bands on the 4-hour chart have widened sharply after a long compression period, indicating a fresh move in progress. The price is now challenging the upper band at $106,014 while sitting just above the 20/50 EMA cluster ($103,092–$103,850).
The price recently reclaimed and held above the key VWAP and order block zones from $102,500 to $104,500, as visible on the 30-minute and 4-hour order block charts. This area now serves as a strong intraday base.
Furthermore, trendline resistance is observed near $106,135. A break and close above this level could validate the next leg up toward $109K. However, failing to break above $106K may bring consolidation back toward $103.7K or even $102.9K support.
Short-Term Outlook: Can Bitcoin Price Break Past $106K?
The short-term structure remains tilted in favor of the bulls, but multiple timeframes show that BTC is nearing key resistance. Volume has picked up slightly, but a decisive push above $106,135 with follow-through will be required to continue the rally.
The next upside targets are $109,771 and $114,890 based on Fibonacci pivot levels. On the downside, losing $103,850 opens the door toward $102,500 and the deeper support cluster at $100,317.
With technicals such as the RSI nearing overbought, MACD flattening, and price testing diagonal resistance, traders should watch for confirmation before positioning. Bitcoin price spikes remain possible, but volatility will likely define direction in the next 24 hours.
Bitcoin Price Forecast Table
| Indicator/Zone | Level (USD) | Signal Description |
| Bitcoin price today | $105,400 | Current spot level |
| Resistance 1 | $106,135 | Intraday resistance trendline |
| Resistance 2 | $109,150 | Pivot + Fibonacci cluster |
| Support 1 | $103,850 | EMA50 + structure base |
| Support 2 | $102,521 | Bollinger midline + VWAP zone |
| Supertrend (4H) | $100,239 | Trendline support |
| RSI (30-min) | 65.28 | Neutral-bullish (watch for overbought) |
| MACD (30-min) | Bullish crossover | Momentum recovering |
| DMI (+DI/-DI) | 28.4 / 21.6 | Bullish tilt |
| MFI (14) | 51.6 | Neutral-to-positive capital flow |
Disclaimer: The information presented in this article is for informational and educational purposes only. The article does not constitute financial advice or advice of any kind. Coin Edition is not responsible for any losses incurred as a result of the utilization of content, products, or services mentioned. Readers are advised to exercise caution before taking any action related to the company.
 Price Prediction 2025, 2026, 2027–2030")
 Price Prediction 2025, 2026, 2027–2030")
 Price Prediction for August 8")
 Price Prediction for August 8")
 Price Prediction for August 8")
