


The XRP price today is consolidating near $2.1833 after a sharp reversal from $1.96 last week. The recovery is supported by structural reclaim and bullish momentum across key indicators.
However, price is nearing a congestion zone around $2.20–$2.28, where multiple resistance layers converge. Traders now await confirmation whether XRP can build above this band or retrace into a short-term cooldown.
What’s Happening With XRP’s Price?
After rejecting sub-$2.00 levels, the XRP price action shows a clear V-shaped recovery. The 4-hour chart confirms a break above the descending wedge resistance with price now retesting the upper boundary of the prior liquidity zone between $2.05 and $2.18.

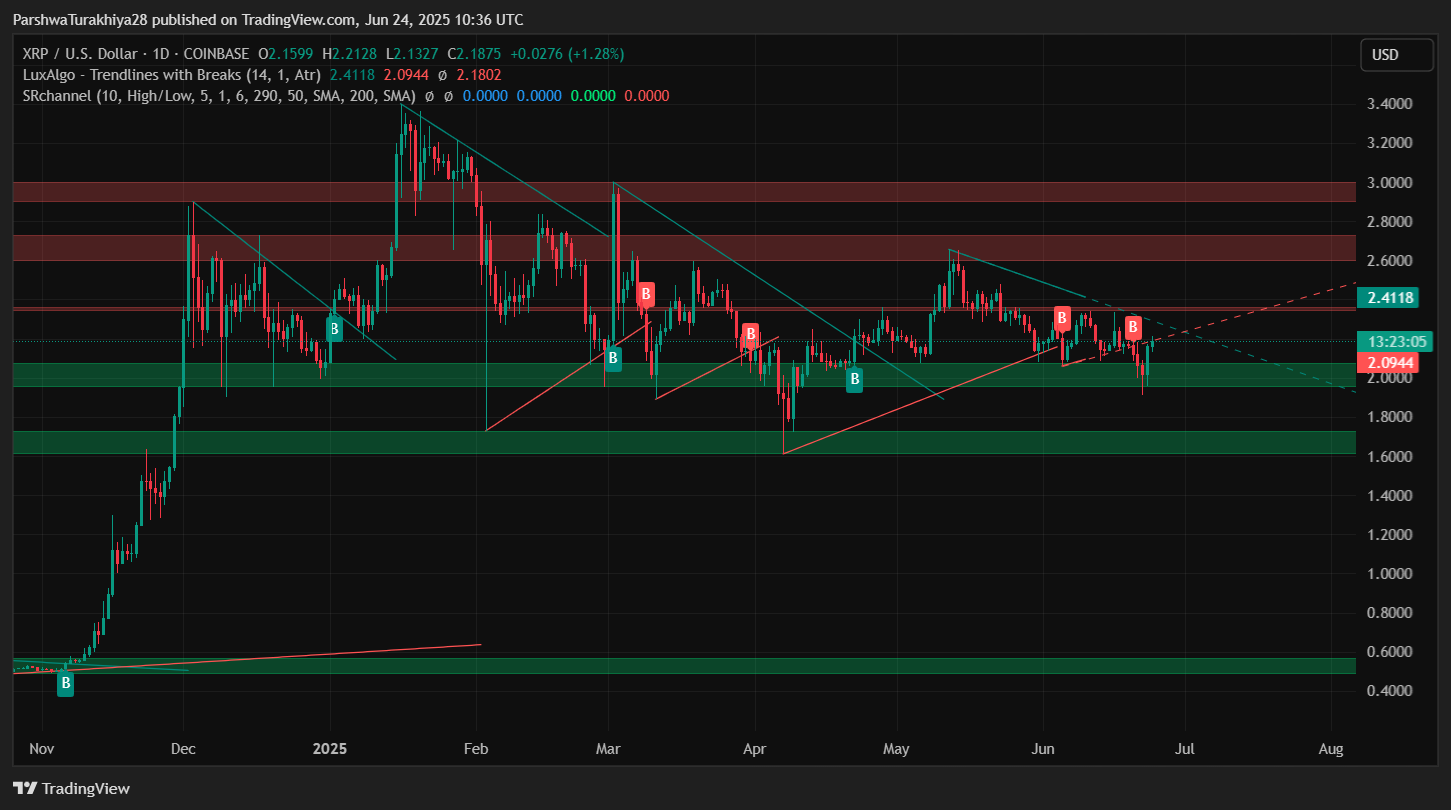
On the daily chart, XRP has broken through key mid-June resistance near $2.10 and is currently attempting to flip the broader breakdown structure. This includes a descending trendline extending from the April highs and overlapping Fibonacci resistance near $2.25.
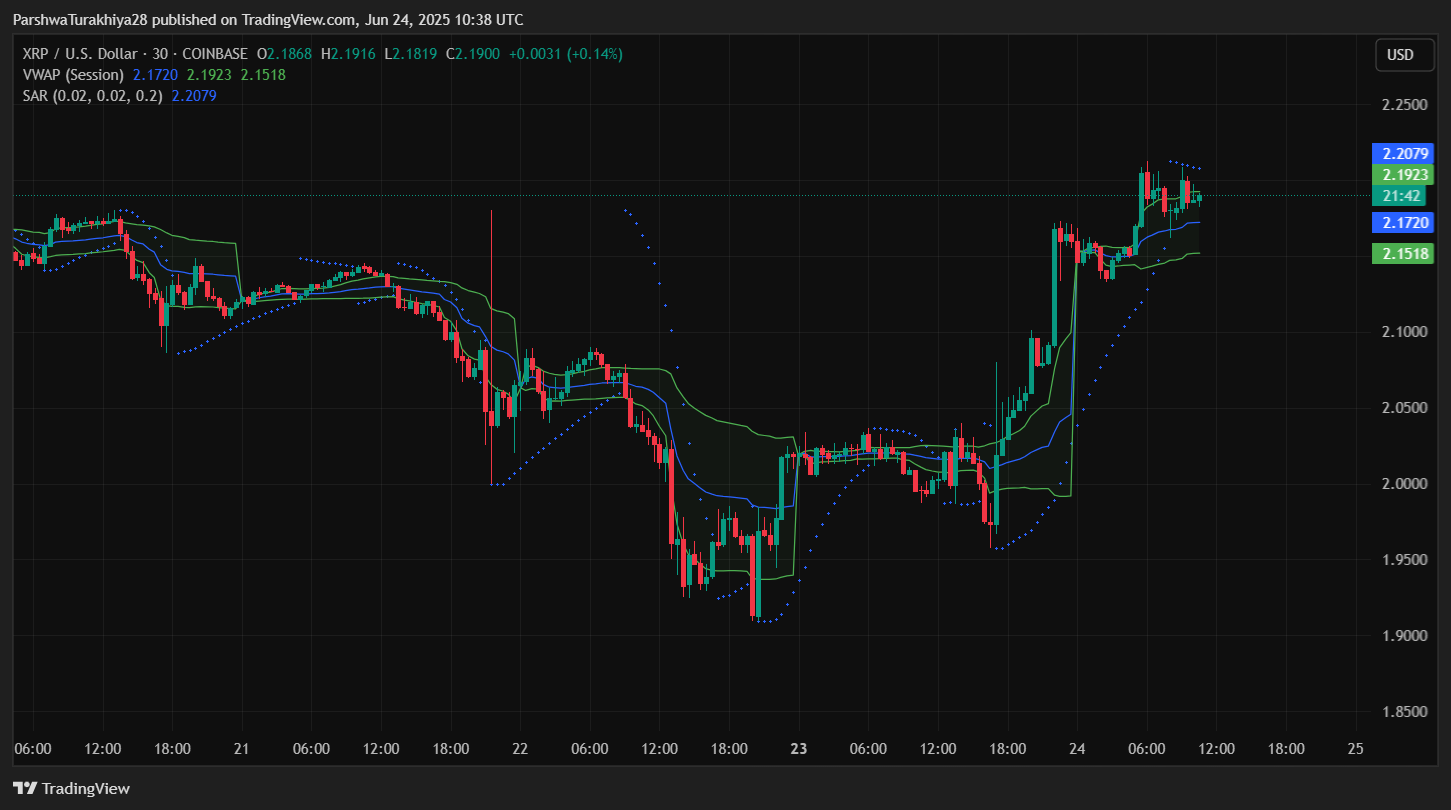
Parabolic SAR has flipped bullish on the 30-mins chart, while supertrend signals have turned green, marking the early phase of a trend shift.
XRP Price: Indicators Show Recovery But Signal Key Hurdles
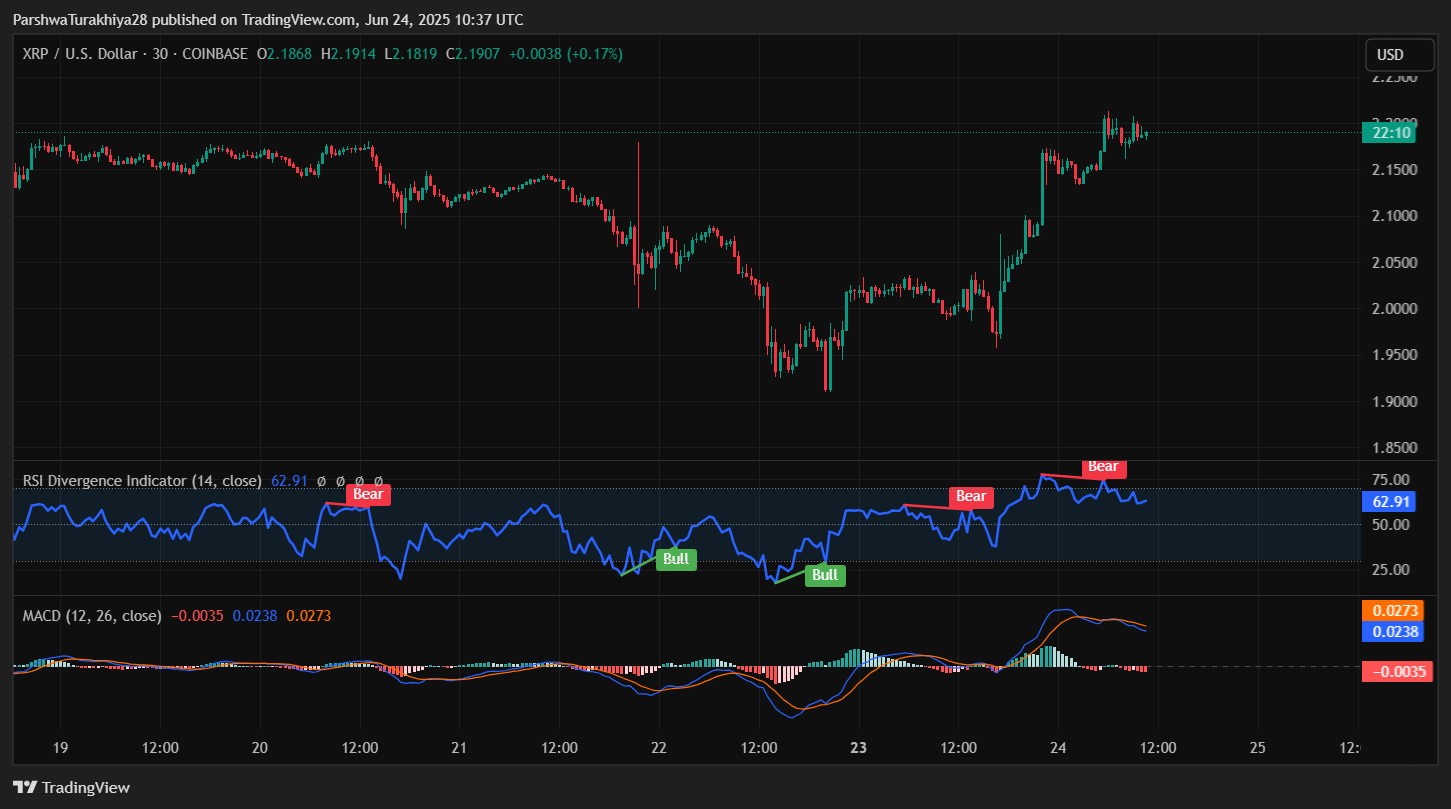
RSI is rising across multiple timeframes, with the 4-hour RSI around 69, inching toward the overbought threshold. Notably, RSI has formed a bullish divergence on the 2-hour chart, confirming upside momentum from the $1.96 base.
MACD on both 4-hour and 1-hour charts has triggered a bullish crossover with strong histogram expansion, suggesting buyers are in control. However, MACD slope is slightly flattening on the 1-hour chart, hinting at momentum fatigue near $2.20.
Bollinger Bands are widening, with XRP hugging the upper band on the 4-hour timeframe, a classic sign of breakout volatility. Yet, this also increases the chance of short-term rejection or consolidation around current levels.
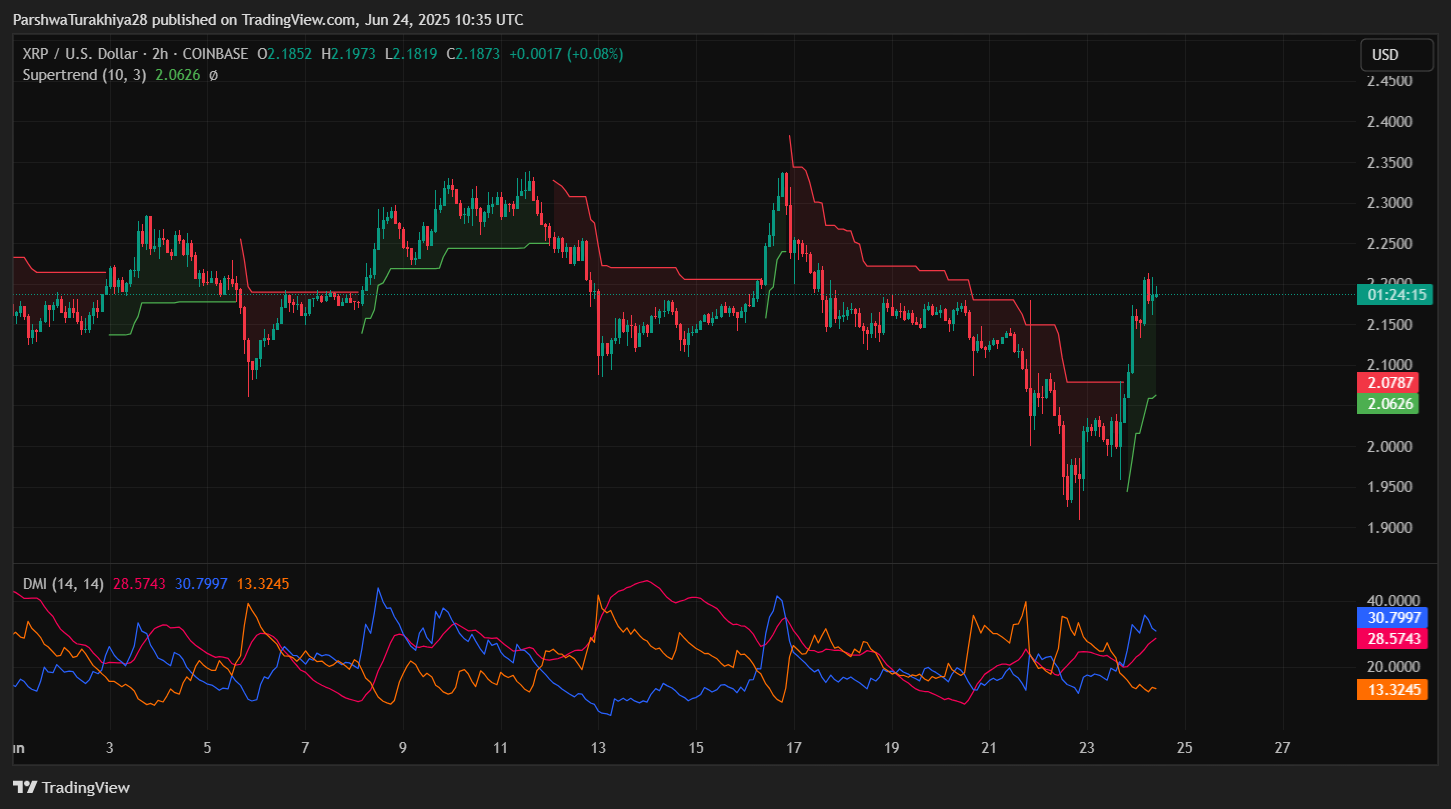
ADX/DMI analysis shows a rising ADX around 29 on the 4-hour chart, confirming trend strength. DMI+ remains above DMI−, but the gap is narrowing, suggesting slowing upside momentum unless a fresh impulse follows.
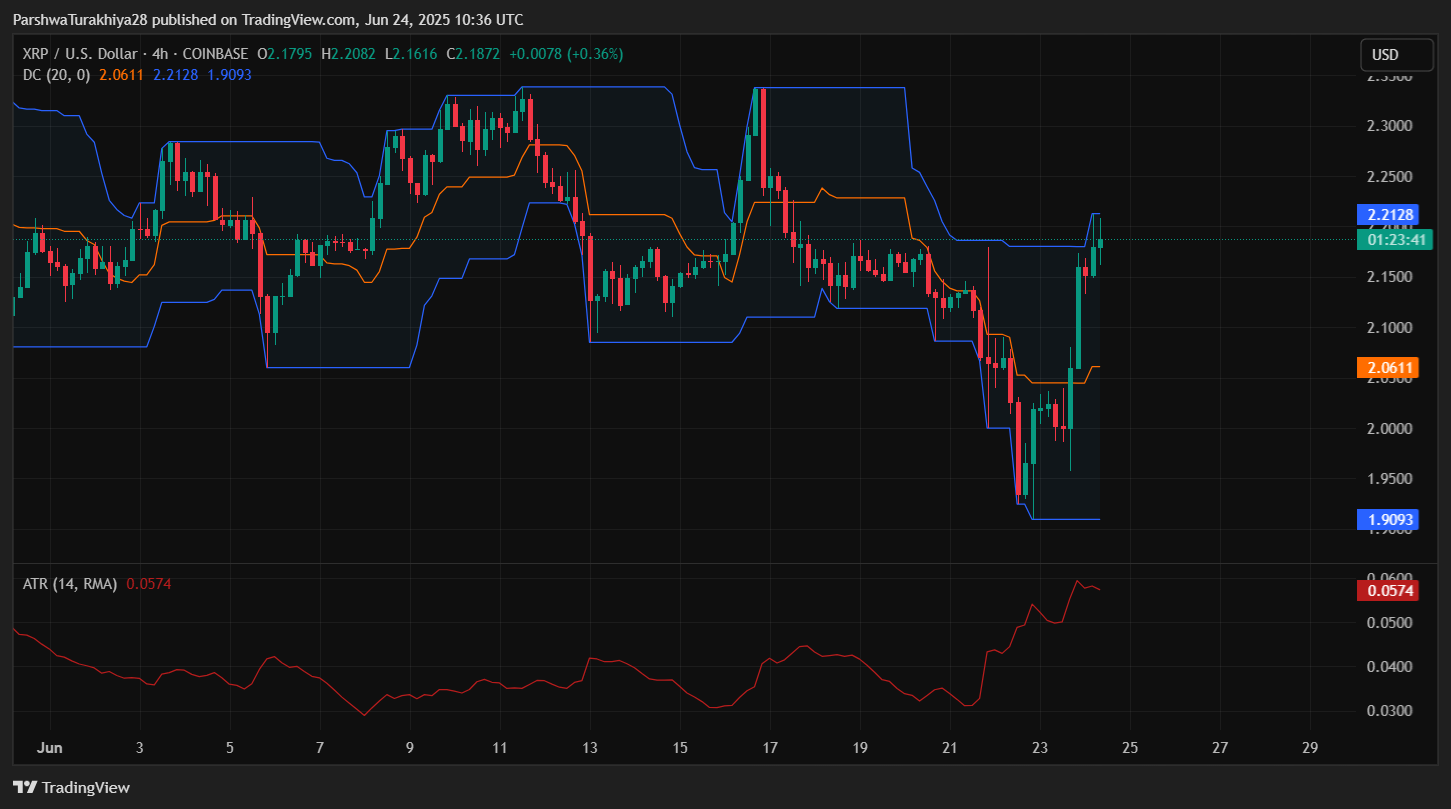
ATR has picked up, reinforcing increased price range and trader activity. Combined with reclaim of key moving averages (SMA/EMA 50 and 100), this suggests XRP is entering a high-volatility phase.
XRP Liquidation Data Shows Long Bias as Price Holds Above $2.18
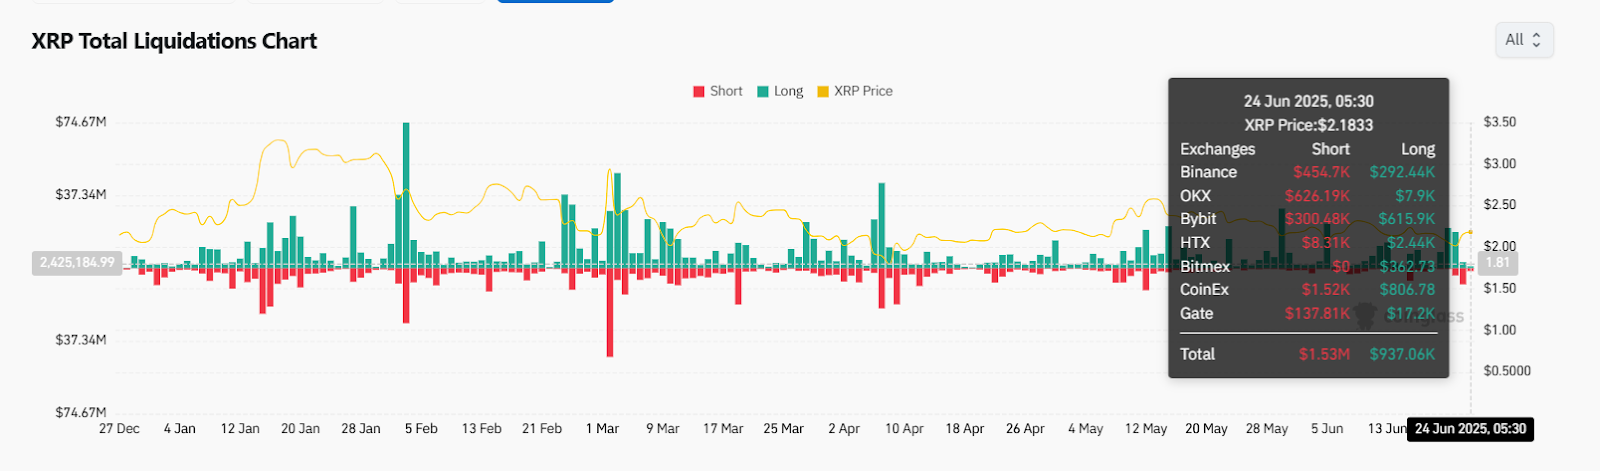
On June 24, 2025, XRP traded around $2.1833, with total long liquidations amounting to $937.06K and short liquidations much lower at $1.53M. The discrepancy highlights strong bullish sentiment as long positions dominated liquidation activity. Notably, Bybit saw the largest long liquidations at $615.9K, followed by Binance at $292.44K, suggesting leveraged buyers were caught in intraday pullbacks. Short liquidations remained minimal across exchanges, reinforcing the notion that bears are currently under pressure.
Despite this, the long-liquidation clusters—especially at CoinEx and Bybit—indicate that upside momentum may be facing temporary exhaustion. The liquidation spikes also align with XRP price hovering near a local resistance zone, shown by a flattening yellow price curve. Historically, large long liquidations have preceded short-term consolidation or retracements, making this a potential inflection point. Traders should watch for increased volatility near the $2.20–$2.25 range as leverage begins to unwind.
XRP Price Short-Term Forecast: Eyes on $2.25–$2.30 With $2.10 Key Support

The current XRP price update suggests short-term bullish bias, but with risk of rejection near $2.25–$2.30 where historical sell pressure was concentrated. If price breaks above $2.30, the next upside targets sit at $2.41 and $2.55.
On the downside, $2.10 serves as immediate support, followed by $2.00. A daily close below $1.96 would invalidate the current bullish setup and shift momentum back to sellers.
Until then, the broader market structure favors continuation toward $2.30 if buyers can sustain control.
XRP Price Technical Forecast Table: June 25
| Indicator/Zone | Level (USD) | Signal/Comment |
| XRP price today | $2.1833 | Consolidating near breakout zone |
| Resistance 1 | $2.25–$2.30 | Major supply zone + Fib confluence |
| Resistance 2 | $2.41 / $2.55 | April high zones |
| Support 1 | $2.10 | Former resistance, now flipped support |
| Support 2 | $1.96 | Bullish reversal origin |
| RSI (4H) | 69.1 | Approaching overbought |
| MACD (4H) | Bullish | Positive crossover, histogram growing |
| Bollinger Bands (4H) | Expanding | Price near upper band |
| ADX (4H) | 29.2 | Strong trend strength |
| ATR (1H) | 0.076 | Higher volatility |
| Supertrend (4H/Daily) | Bullish Flip | Breakout confirmation |
| SAR (4H) | Below Price | Bullish confirmation |
The XRP price spikes from sub-$2.00 have sparked a renewed uptrend, supported by broad indicator confirmation and structural flips. While short-term resistance near $2.30 remains a key challenge, momentum favors bulls unless price slips below $2.10. Sustained action above $2.25 could lead to accelerated gains toward $2.41 and beyond.
Disclaimer: The information presented in this article is for informational and educational purposes only. The article does not constitute financial advice or advice of any kind. Coin Edition is not responsible for any losses incurred as a result of the utilization of content, products, or services mentioned. Readers are advised to exercise caution before taking any action related to the company.
 Price Prediction For June 25 2025")

 Price Prediction For June 25")
 Price Prediction For June 25")
 Price Prediction For June 25")
