
 Price Prediction for June 27")

After a powerful rebound from sub-$99,000 levels earlier this week, the Bitcoin price today trades around $107,800, marking a +9% surge over the past 72 hours. The rally has now entered a critical red supply zone between $108,000 and $110,000, where historical rejections have often triggered consolidation phases. Price is pausing just below this resistance, and several indicators hint at an imminent inflection.
What’s Happening With Bitcoin’s Price?
From a multi-timeframe perspective, Bitcoin price action has flipped bullish after a breakout from the descending channel seen on the daily and 4-hour charts. The current rally originated from a liquidity sweep near $98,000, forming a bullish order block and reclaiming the broken structure.
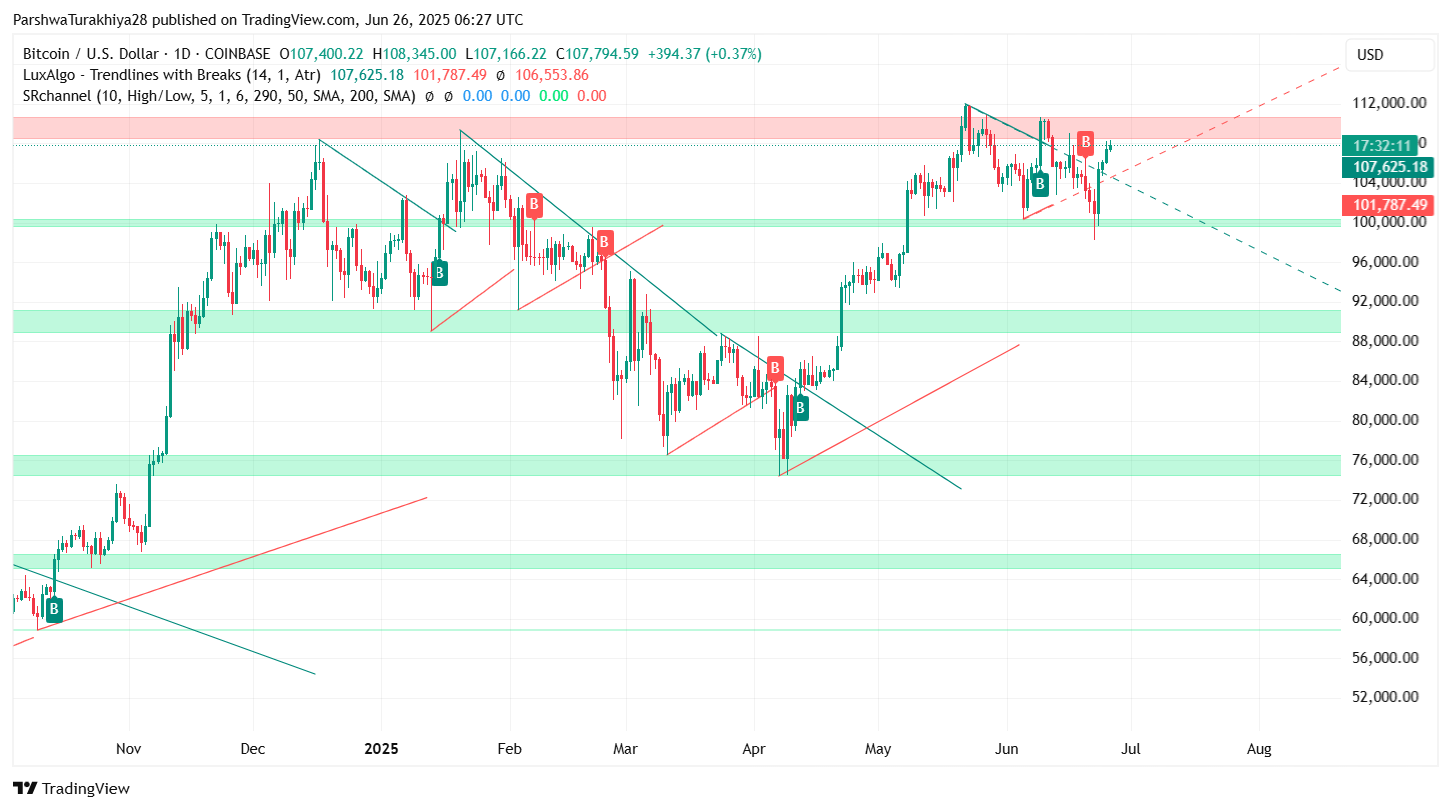
Price is now testing the same region that caused the last rejection near $108,000. The 1D chart shows this area aligning with the upper trendline projection, where BTC reversed in early June. A breakout above this could initiate a broader expansion phase, while rejection would risk a retracement back toward $104,000–$105,000.
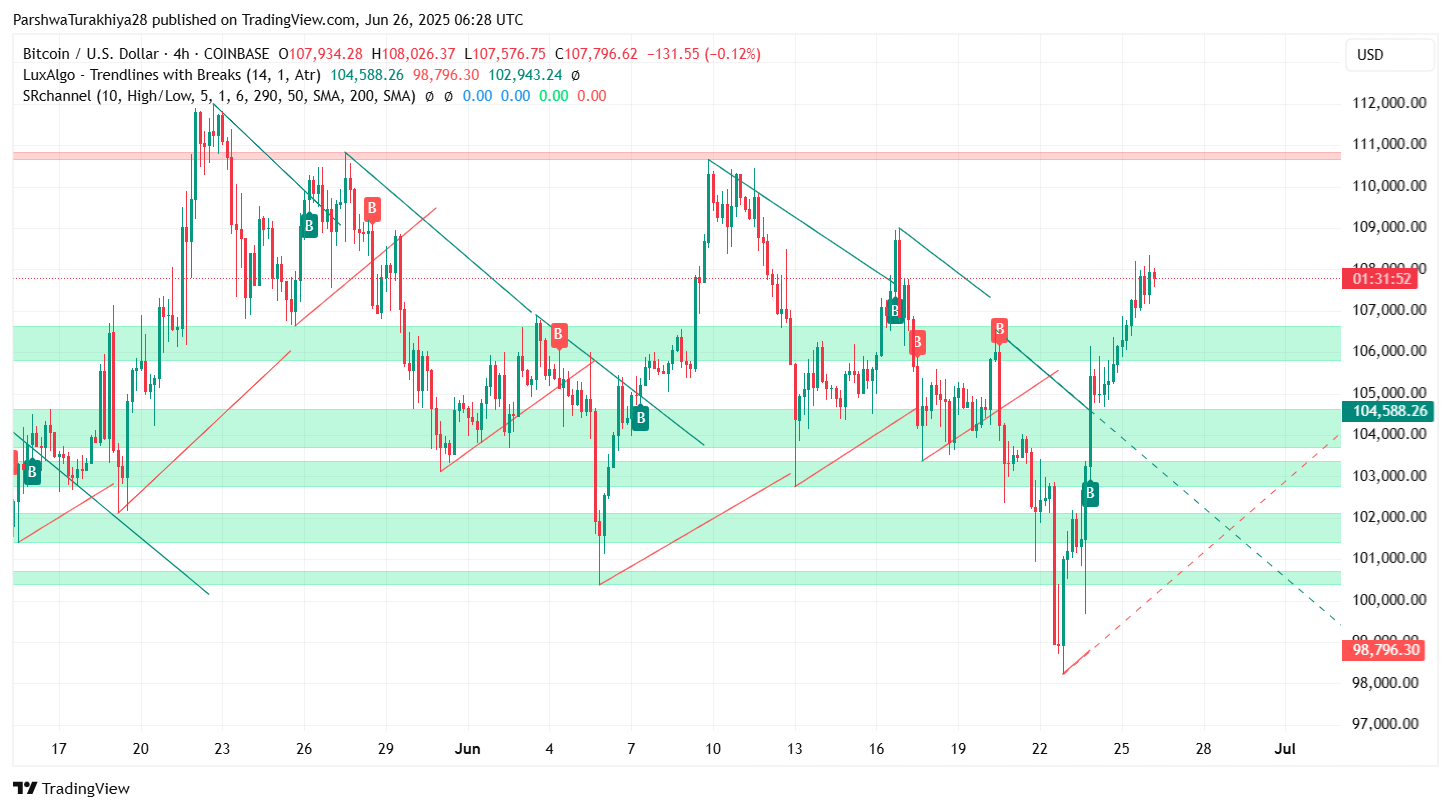
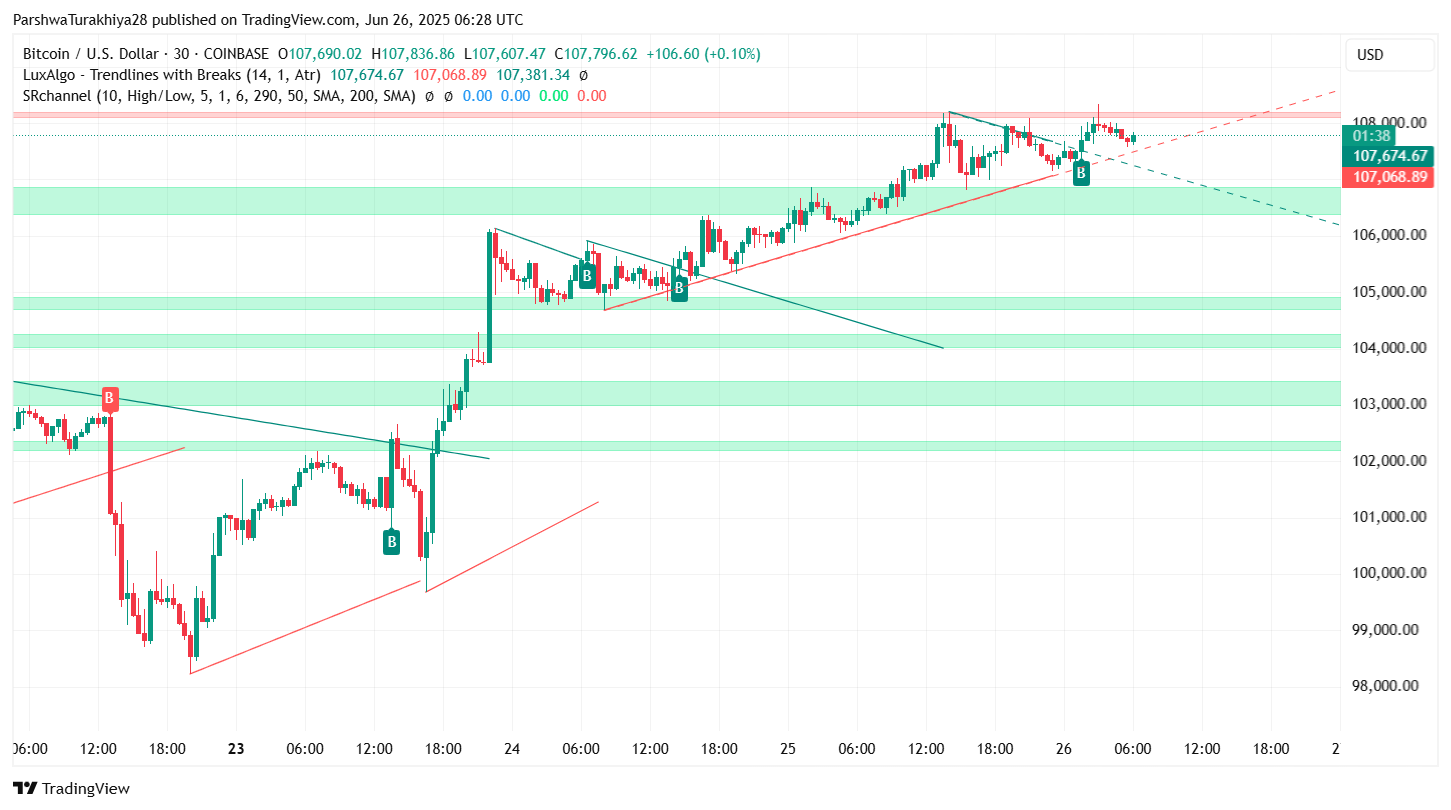
The 4-hour chart confirms a clean break of multiple diagonal trendlines and reclaim of horizontal demand at $104,500. Price now sits atop stacked support levels, but upside candles are shrinking in size, indicating hesitation.
Why Is the Bitcoin Price Going Up Today?
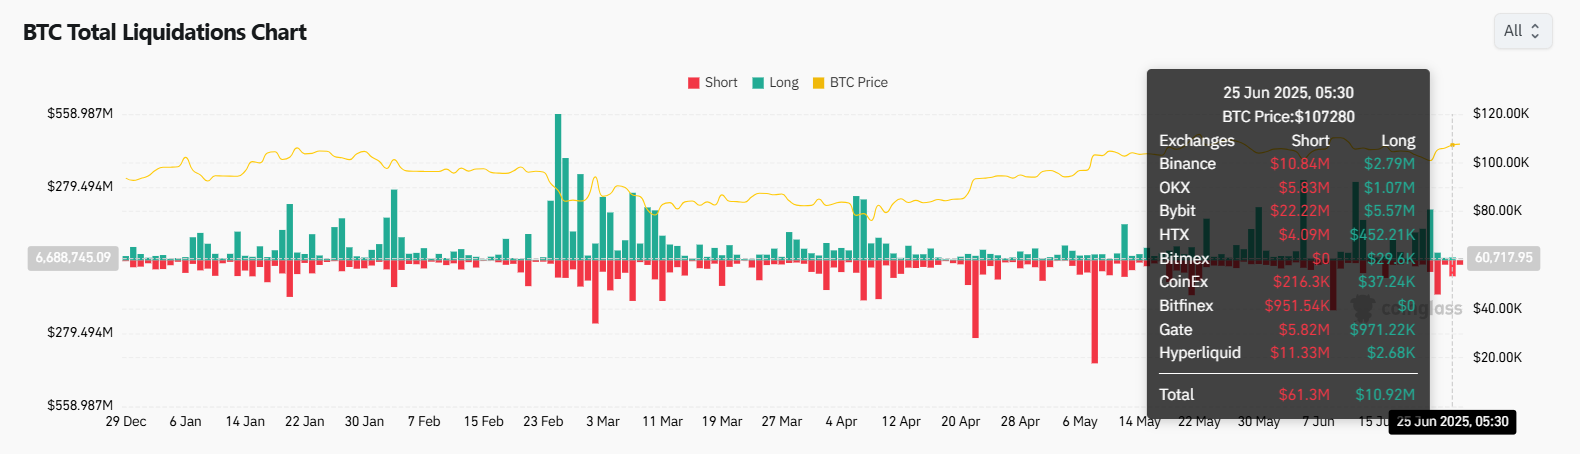
The reason why Bitcoin price going up today lies in a combination of liquidation triggers and technical reclaim zones. According to CoinGlass, over $60 million in short positions were liquidated on June 25 alone, driving a cascade effect that accelerated the move toward $108,000.
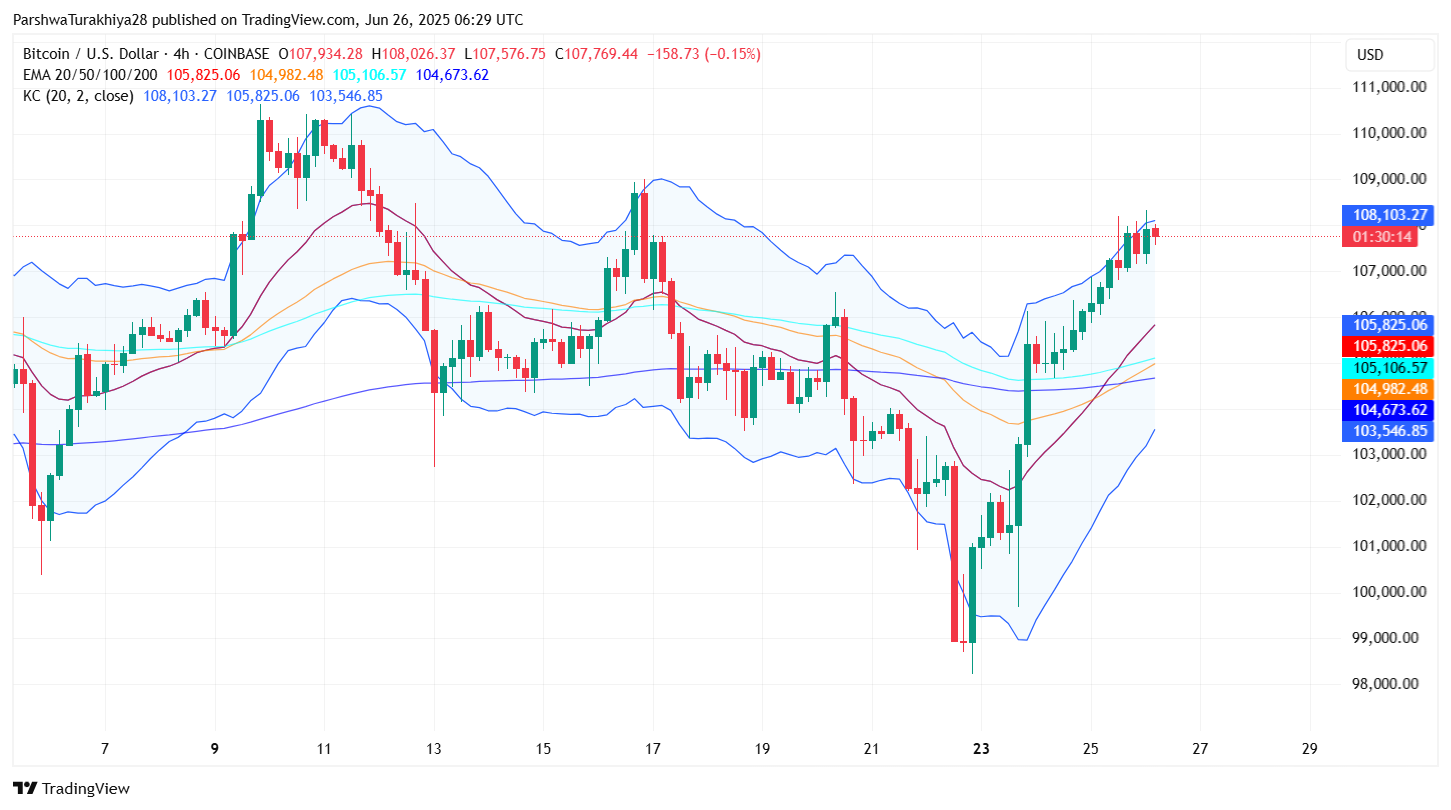
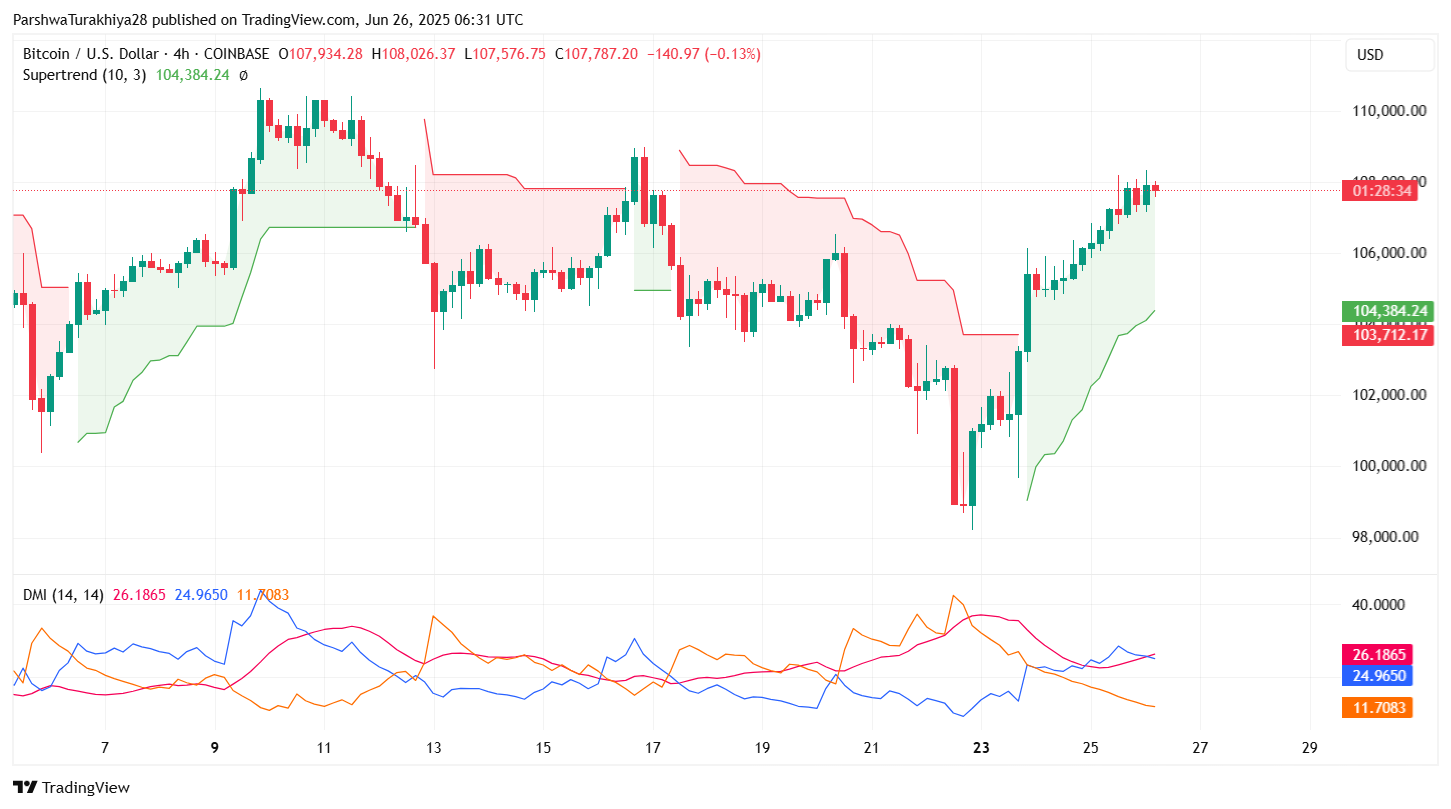
Simultaneously, BTC price broke above the 20/50/100 EMA cluster (around $105,000–$106,000), flipping this previously bearish alignment into support. The Supertrend indicator has flipped green on the 4-hour timeframe, while the Keltner Channel midline has started turning upward, suggesting healthy momentum.
Additionally, price reclaimed the Point of Control near $107,000, which was acting as resistance across the last two weeks. This bullish reclaim has led to increased interest from intraday buyers, especially those trading above VWAP, which now rests at $107,590.
Bitcoin Price Signals Show Momentum Fading Near Resistance
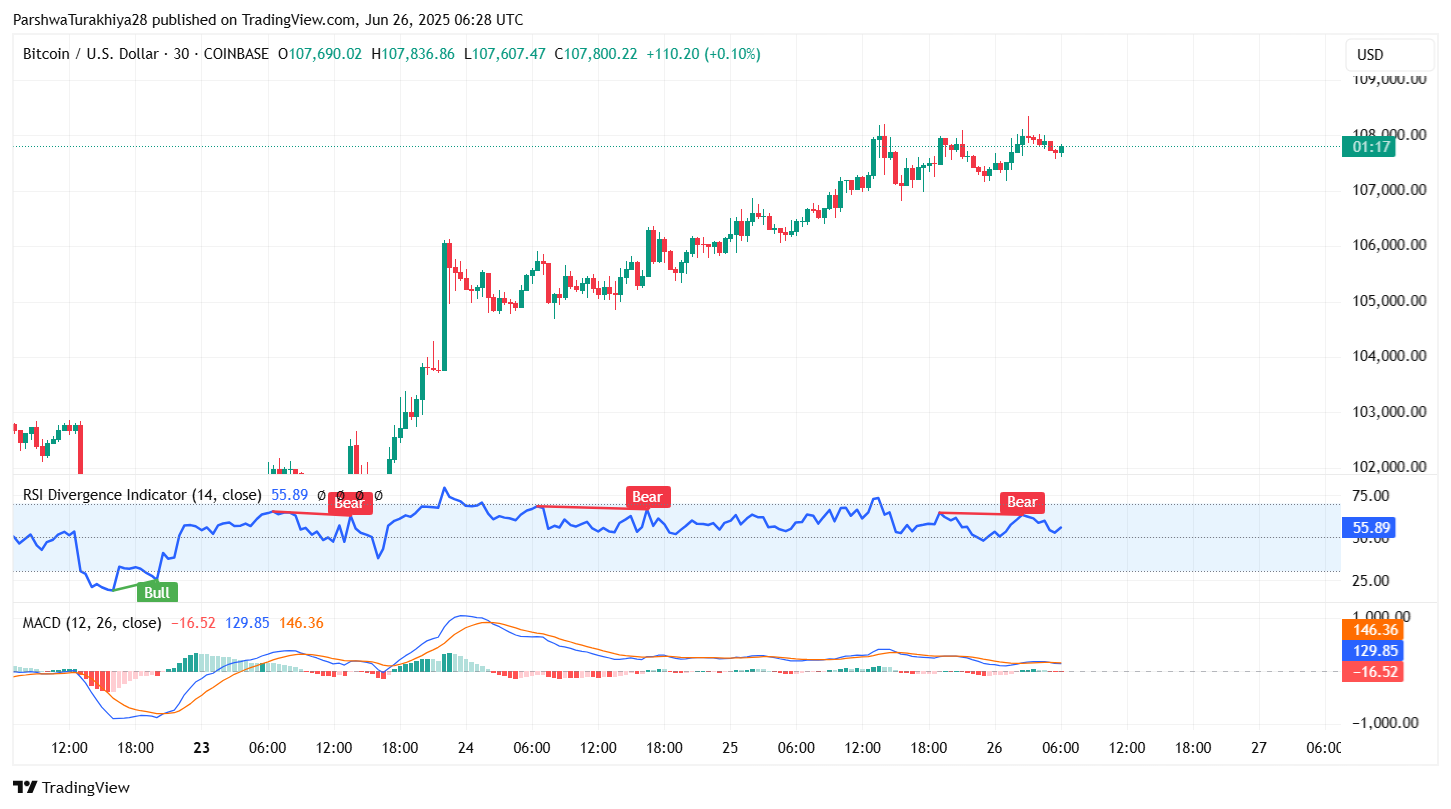
Momentum signals suggest that Bitcoin price volatility may spike soon as traders watch for a resolution. On the 30-minute chart, the RSI stands at 55.89 – a moderate reading, but with two confirmed bearish divergences (bear signals) already printed since June 25.
The MACD on the same chart is flattening after a strong bullish run, indicating a potential shift in intraday momentum. Meanwhile, Bollinger Bands on the 4-hour chart are starting to squeeze near the $108,000 mark – a sign that price is coiling ahead of its next move.
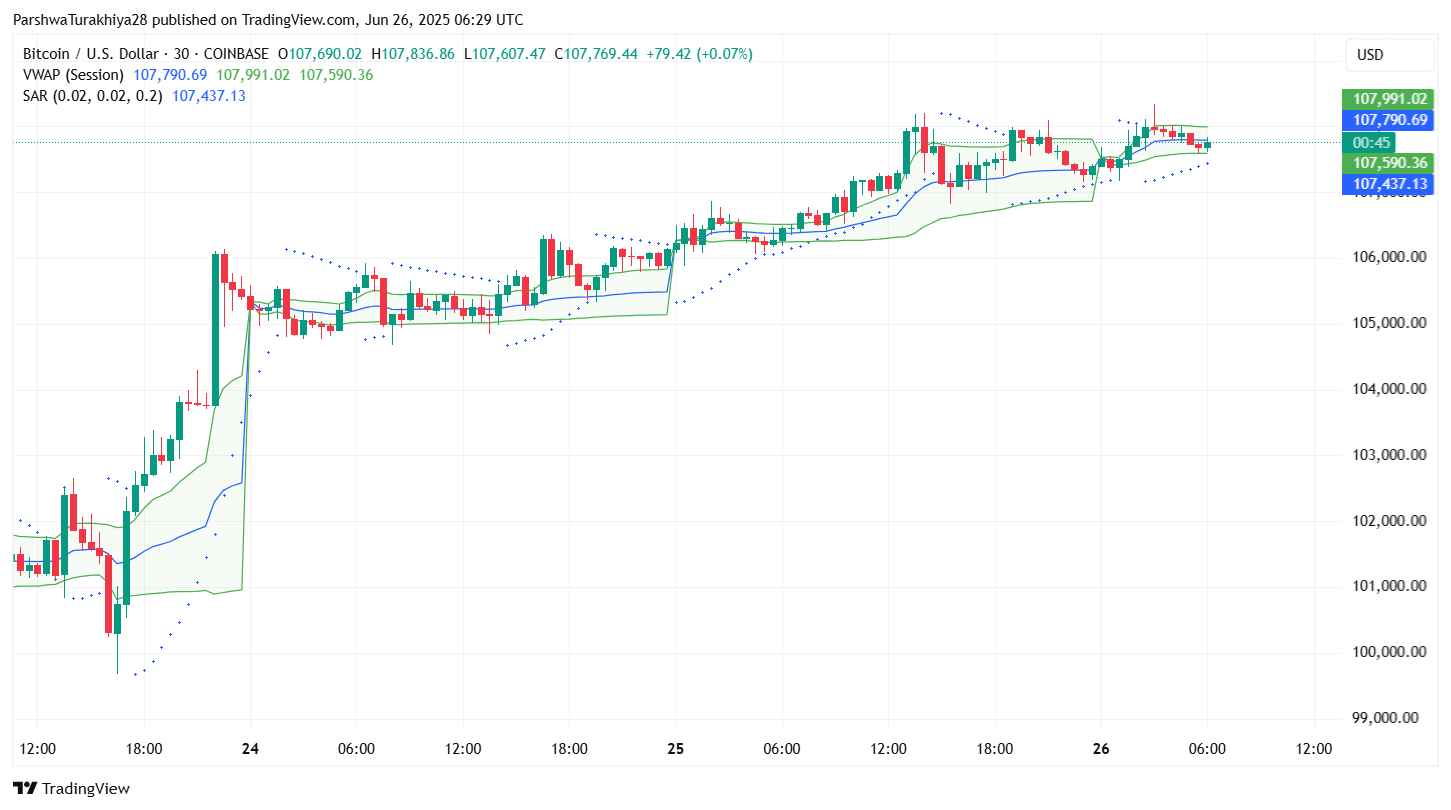
The Parabolic SAR dots have shifted below price but are tightening. If BTC price drops below the intraday trendline near $107,000, a breakdown toward $105,800 becomes plausible.
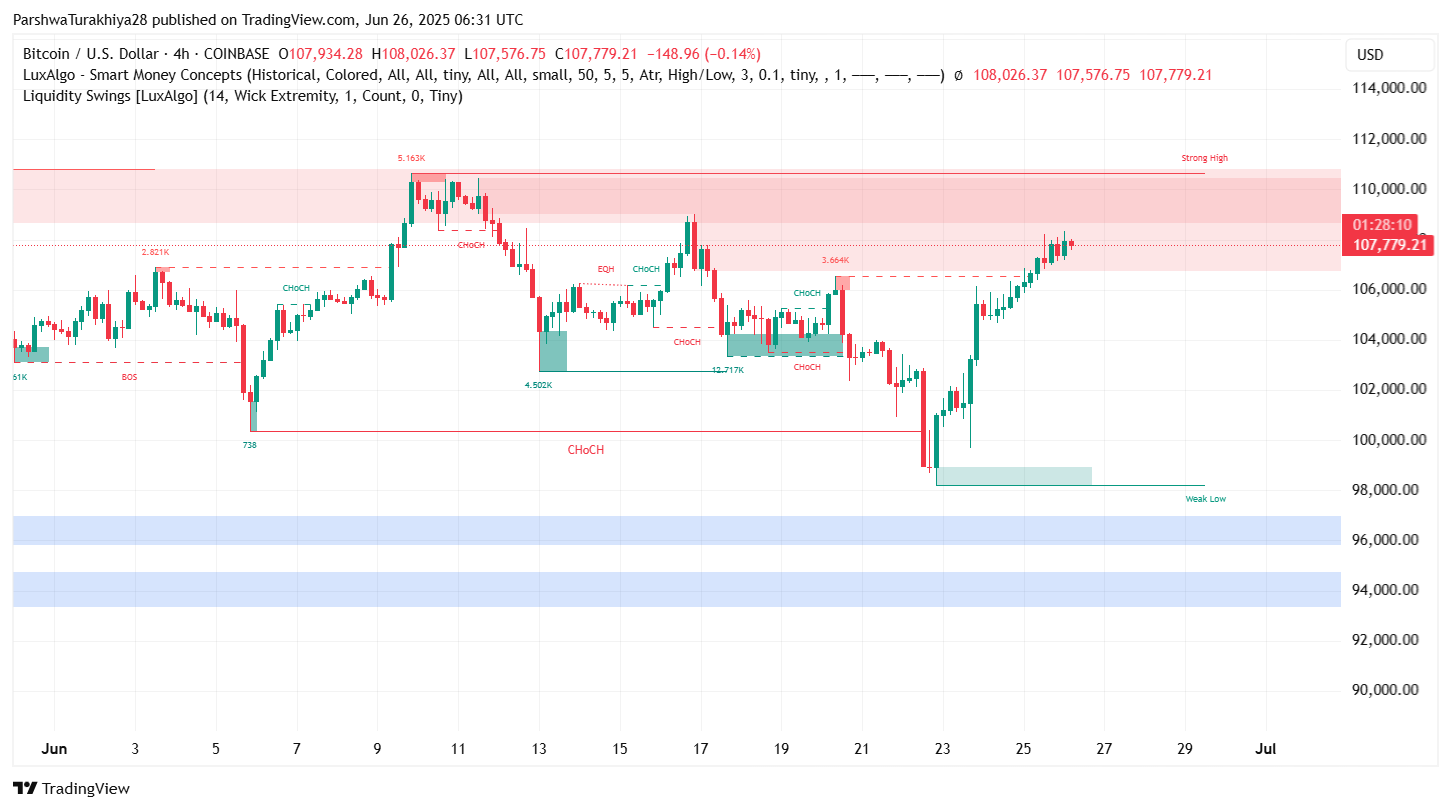
On the 4-hour Smart Money Concepts chart, BTC price is trading near a “Strong High” liquidity pocket where equal highs (EQH) were formed earlier this month. If this level is rejected again, a new Change of Character (CHoCH) could trigger profit-taking.
BTC Price Prediction: Short-Term Outlook (24h)
For June 27, the market is closely watching whether Bitcoin price spikes above $108,200 with strong volume. A confirmed breakout from the supply zone could expose $109,600 and $111,000 as the next resistance levels.
On the flip side, any intraday close below $107,000 increases the chance of a move down toward $105,500–$104,800, where the EMA confluence and Supertrend baseline lie.
Directional Movement Index (DMI) readings show +DI and -DI still crossing with ADX at ~11.7 — suggesting trend strength is still building, but not yet dominant. This keeps the short-term bias cautiously bullish unless BTC fails to defend the rising trendline support.
Bitcoin Price Forecast Table: June 27, 2025
| Indicator / Zone | Level (USD) | Signal |
| Bitcoin price today | $107,800 | Consolidating near supply zone |
| Resistance 1 | $108,200 | Key breakout level |
| Resistance 2 | $109,600 | Next upside target |
| Support 1 | $107,000 | Intraday trendline & VWAP |
| Support 2 | $105,500 | EMA and Supertrend confluence |
| RSI (30-min) | 55.89 | Neutral with bearish divergence |
| MACD (30-min) | Flattening | Momentum fading |
| Supertrend (4H) | Bullish Above $104,384 | Trend confirmed |
| VWAP | $107,590 | Neutral bias if above |
| Liquidity Zone | $108,000–$110,000 | Historic rejection region |
| Volatility Outlook | Moderate | Compression forming |
Disclaimer: The information presented in this article is for informational and educational purposes only. The article does not constitute financial advice or advice of any kind. Coin Edition is not responsible for any losses incurred as a result of the utilization of content, products, or services mentioned. Readers are advised to exercise caution before taking any action related to the company.
 Price Prediction 2025, 2026, 2027, 2028-2030")


