
 Price Prediction For July 2025")

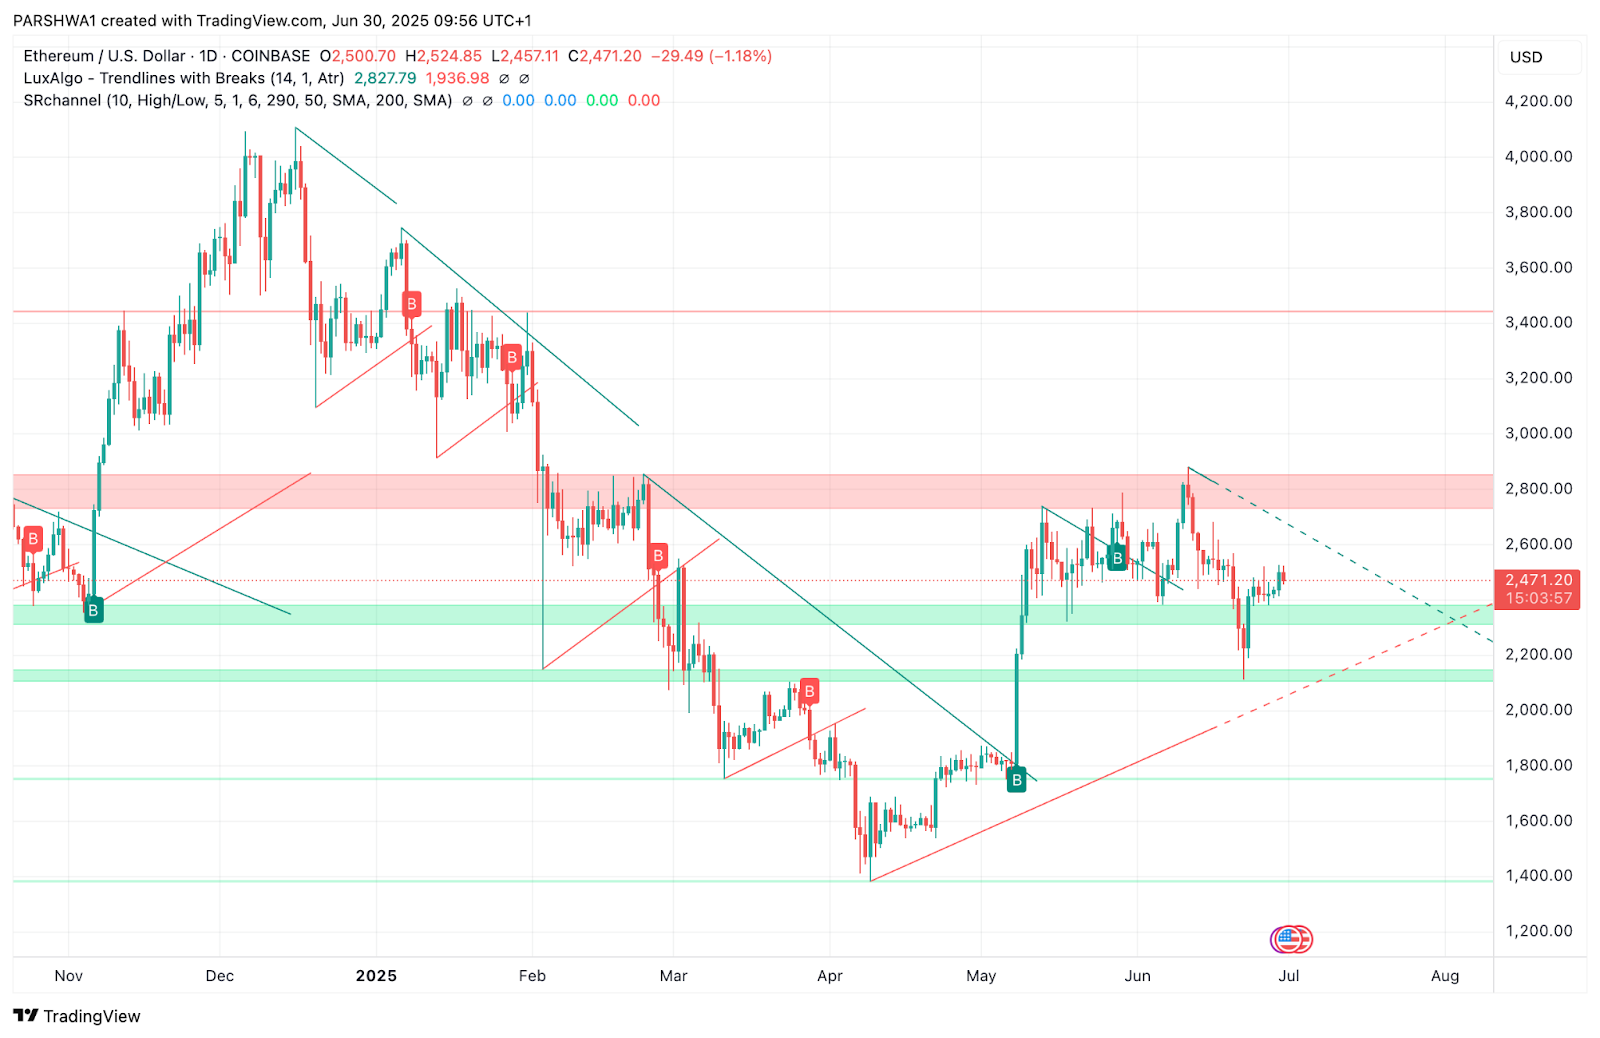
After closing June near the $2,470 mark, Ethereum price action heads into July compressing beneath a descending resistance line and a visible supply zone. The broader technical picture shows neutral momentum, with price attempting to stabilize above the 20-day EMA while liquidity buildup suggests a larger move is likely this month.
Ethereum Price Prediction for July 2025
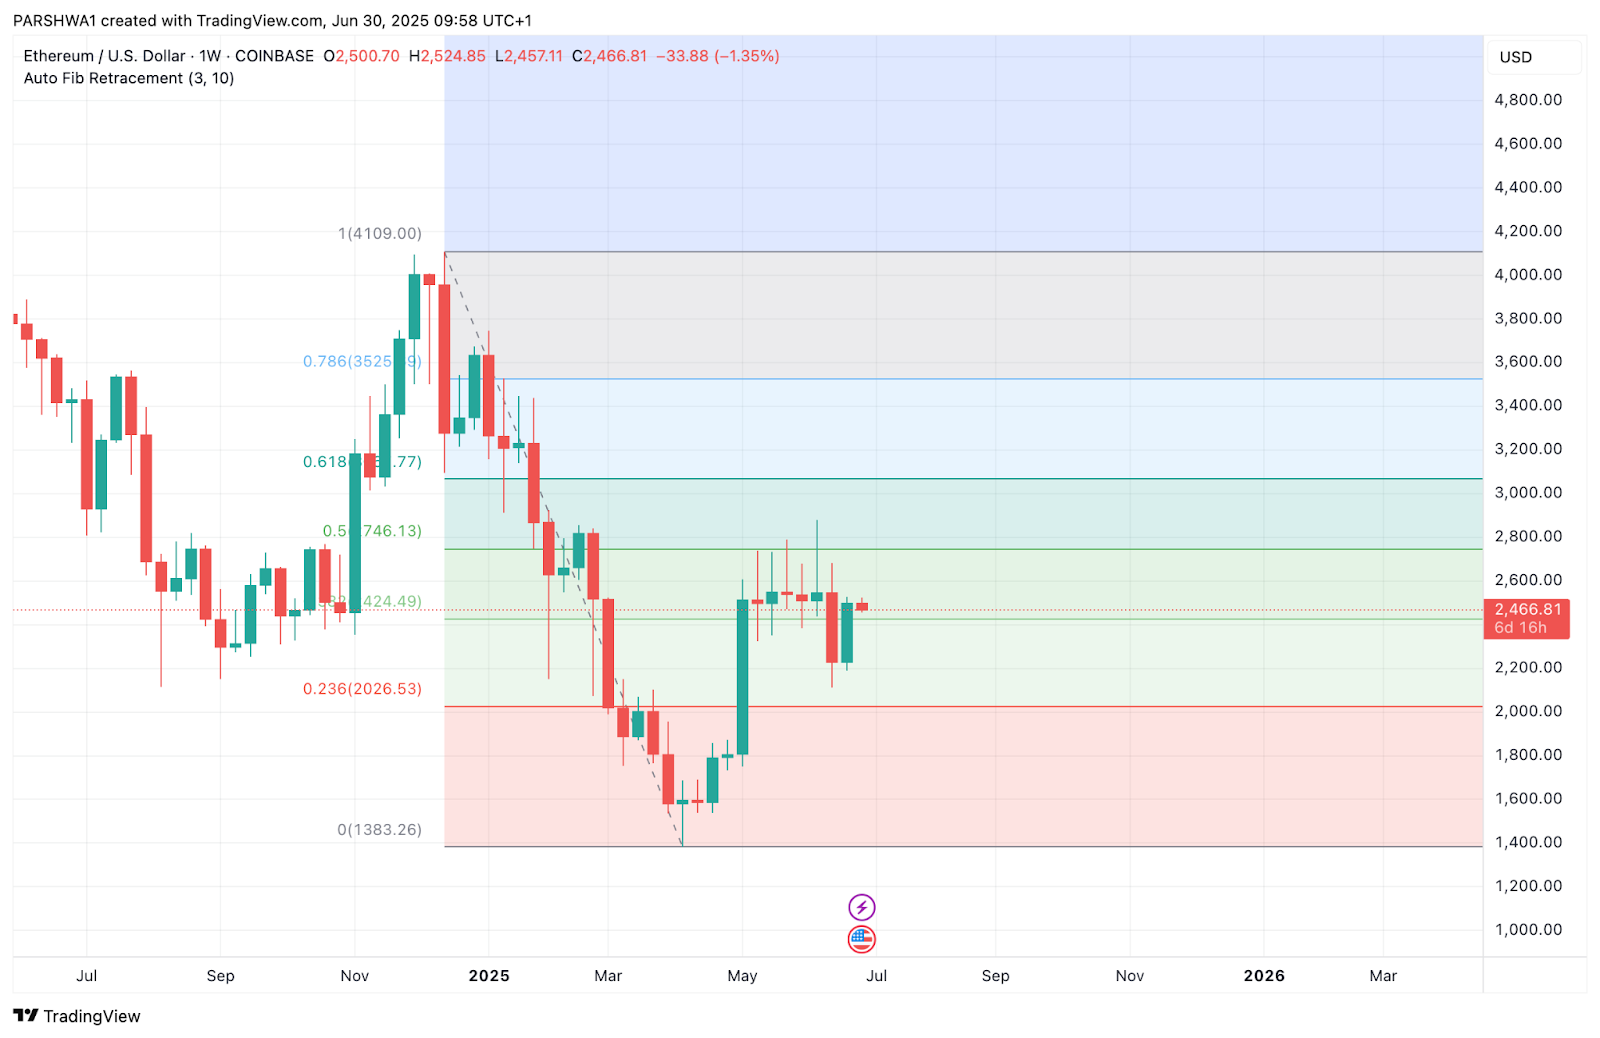
Ethereum is trading just below a critical resistance region between $2,500 and $2,600, which overlaps with the 0.382 Fibonacci retracement from the November 2024 swing high to the April 2025 low. The current structure remains rangebound between $2,300 and $2,600, with price forming lower highs under a descending trendline that has capped previous rallies since June 15.
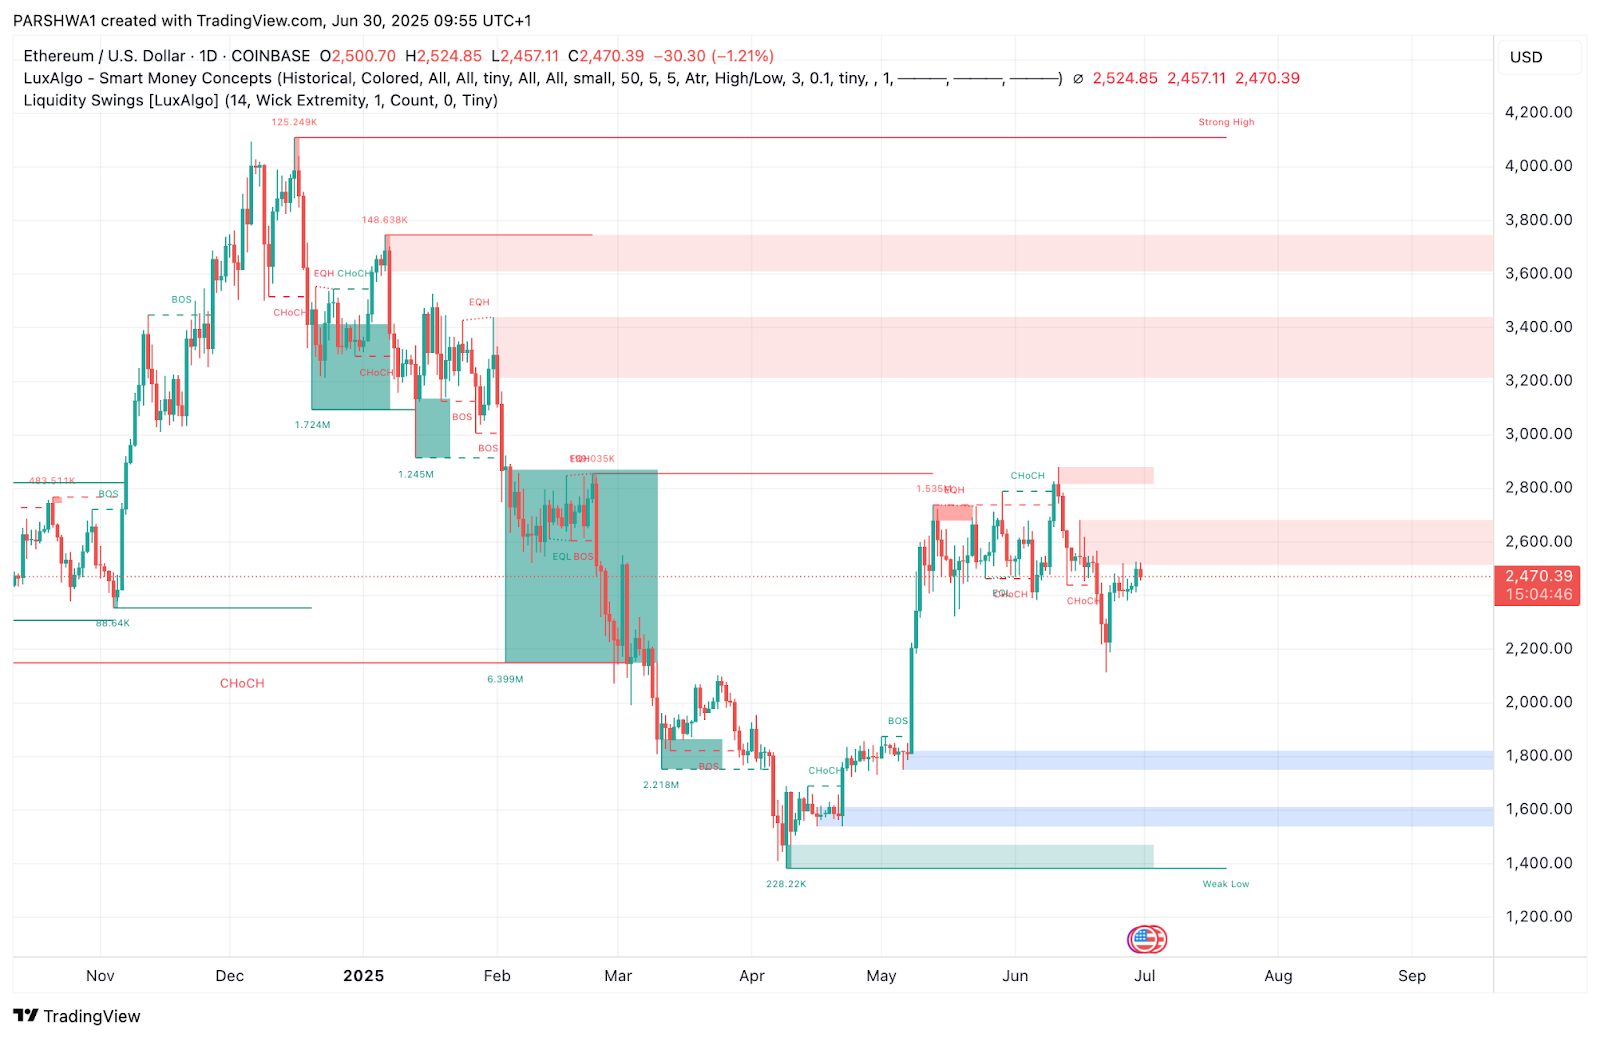
The smart money concepts (SMC) chart shows multiple CHoCH and BOS points near $2,250–$2,500, indicating active liquidity engineering. There is a visible order block around $2,600 that must be breached to validate a sustained bullish breakout, while a failure to hold above $2,400 could invite revisits to the June lows near $2,200 or lower into the demand cluster at $2,050.
Ethereum’s trajectory will largely hinge on whether bulls can push above the triangle resistance, reclaiming $2,600 and targeting the next Fibonacci level around $2,746.
ETH Price Indicators, Signals, and Charts (1M)
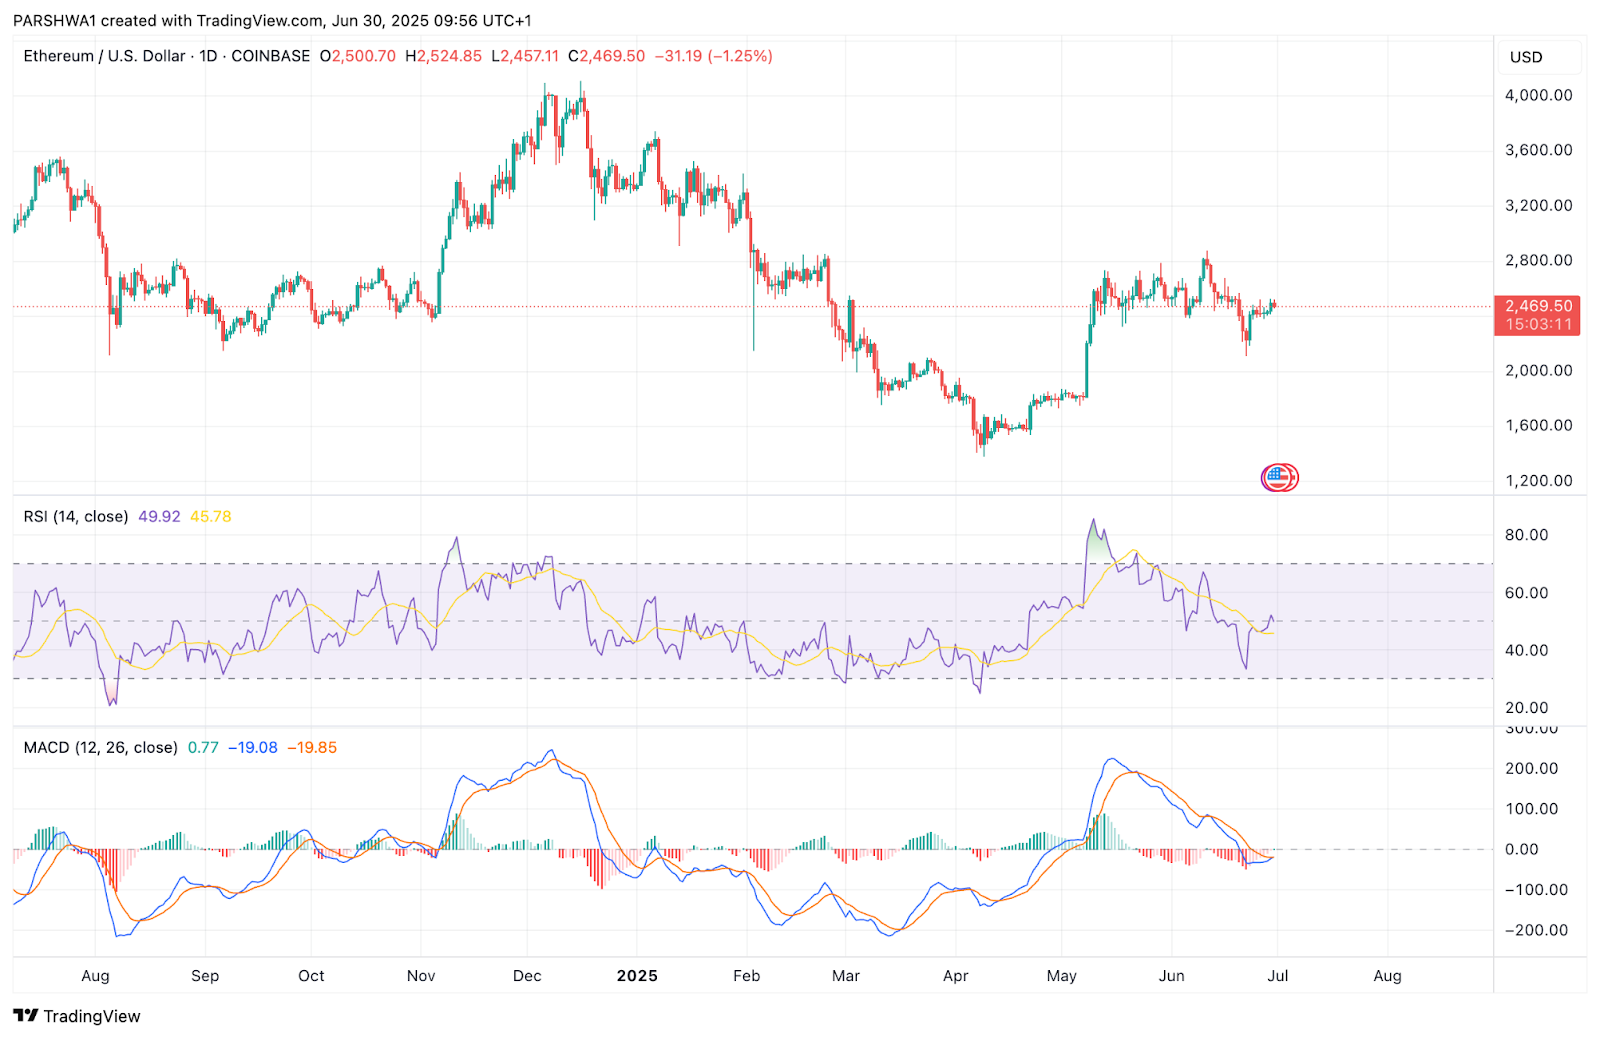
RSI (14) is currently at 49.92, hovering near the midpoint and signaling indecision after recovering from oversold conditions. Momentum remains neutral but leans bullish with the RSI trending upward from a late-June low.
MACD (12, 26) is showing early bullish divergence, with the histogram printing higher lows and the MACD line attempting to cross above the signal line. While confirmation is pending, this setup suggests the potential for momentum to shift toward the upside if buying pressure increases in early July.
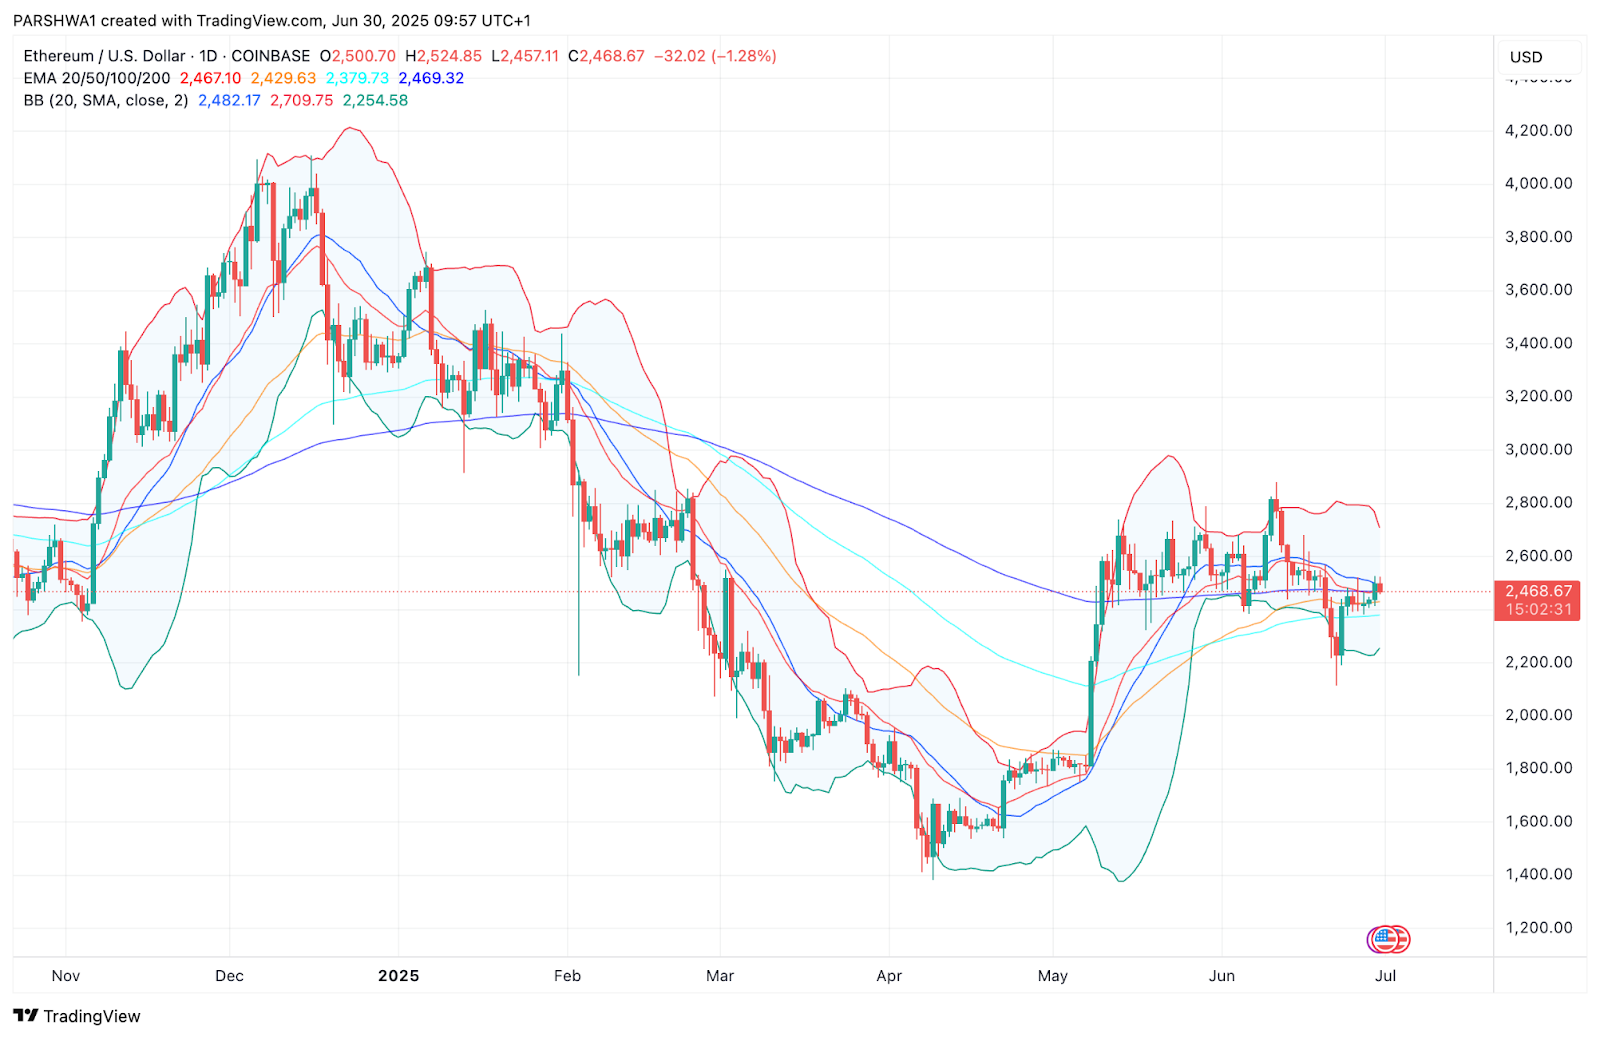
The Bollinger Bands are narrowing, indicating a low volatility environment. Price is sitting just below the mid-band (~$2,470), with the upper band near $2,709 and lower band around $2,254. Any breakout beyond these limits could trigger sharp directional movement.
EMA levels are tightly clustered. ETH is now trading above the 20-day EMA ($2,467) and slightly below the 50-EMA ($2,479). The 100-EMA ($2,379) and 200-EMA ($2,469) are serving as deeper trend supports. A confirmed daily close above the 50-EMA may invite renewed bullish momentum.
What to Expect From Ethereum Price This Month
July 2025 could be a decisive month for Ethereum as the price coils within a descending triangle pattern. A breakout above the $2,600 barrier could spark a fresh rally toward the $2,746 Fibonacci level and potentially the 0.618 retracement zone near $3,000 if broader market conditions support bullish continuation.
However, if Ethereum fails to reclaim the $2,500–$2,600 supply zone early in the month, bears may regain control, dragging price toward the ascending support trendline near $2,250. A breakdown from there could target the major demand zone at $2,026, the 0.236 Fibonacci level, and even the $1,850–$1,600 cluster if sentiment worsens.
Overall, Ethereum is approaching a key decision point. Consolidation is nearing maturity, and volume analysis shows growing accumulation near the current range low.
Can Ethereum Price Hit $2,750 This Month?
Ethereum has a realistic path to $2,750 if buyers can sustain pressure above the $2,600 resistance line. This level not only marks the top of the descending structure but also sits near the 0.5 Fib retracement. A clean break above it could drive momentum toward $2,746 and even challenge the $3,000 psychological barrier.
However, this scenario would likely require Bitcoin to remain strong above $105,000–$110,000 and altcoin flows to rotate in Ethereum’s favor. On the contrary, weakness below $2,400 could invalidate the bullish outlook and push ETH back toward the lower demand zones highlighted earlier.
Conclusion
Ethereum’s price prediction for July 2025 reflects a market on the edge of a breakout. Indicators are neutral but supportive of volatility expansion, while price structure is compressing within a descending triangle just beneath a key supply zone. A confirmed move above $2,600 could trigger a run to $2,750 and beyond, but failure to hold $2,400 may lead to deeper retests toward $2,200 or $2,026. Traders should watch for decisive price action early in the month to determine whether bulls or bears take control.
Disclaimer: The information presented in this article is for informational and educational purposes only. The article does not constitute financial advice or advice of any kind. Coin Edition is not responsible for any losses incurred as a result of the utilization of content, products, or services mentioned. Readers are advised to exercise caution before taking any action related to the company.
 Price Prediction 2025, 2026, 2027–2030")
 Price Prediction for August 19")
 Price Prediction for August 19")
 Price Prediction for August 19")
 Price Prediction for August 19")
