
 Price Prediction for July 3")

After sliding from highs near $156 earlier this week, the Solana price today is consolidating around $149.21. The latest rebound from a confluence of moving averages and trendline support has given bulls renewed hope of retesting the $155–$157 resistance zone. However, the upside remains capped by key technical and option-driven ceilings.
What’s Happening With Solana’s Price?
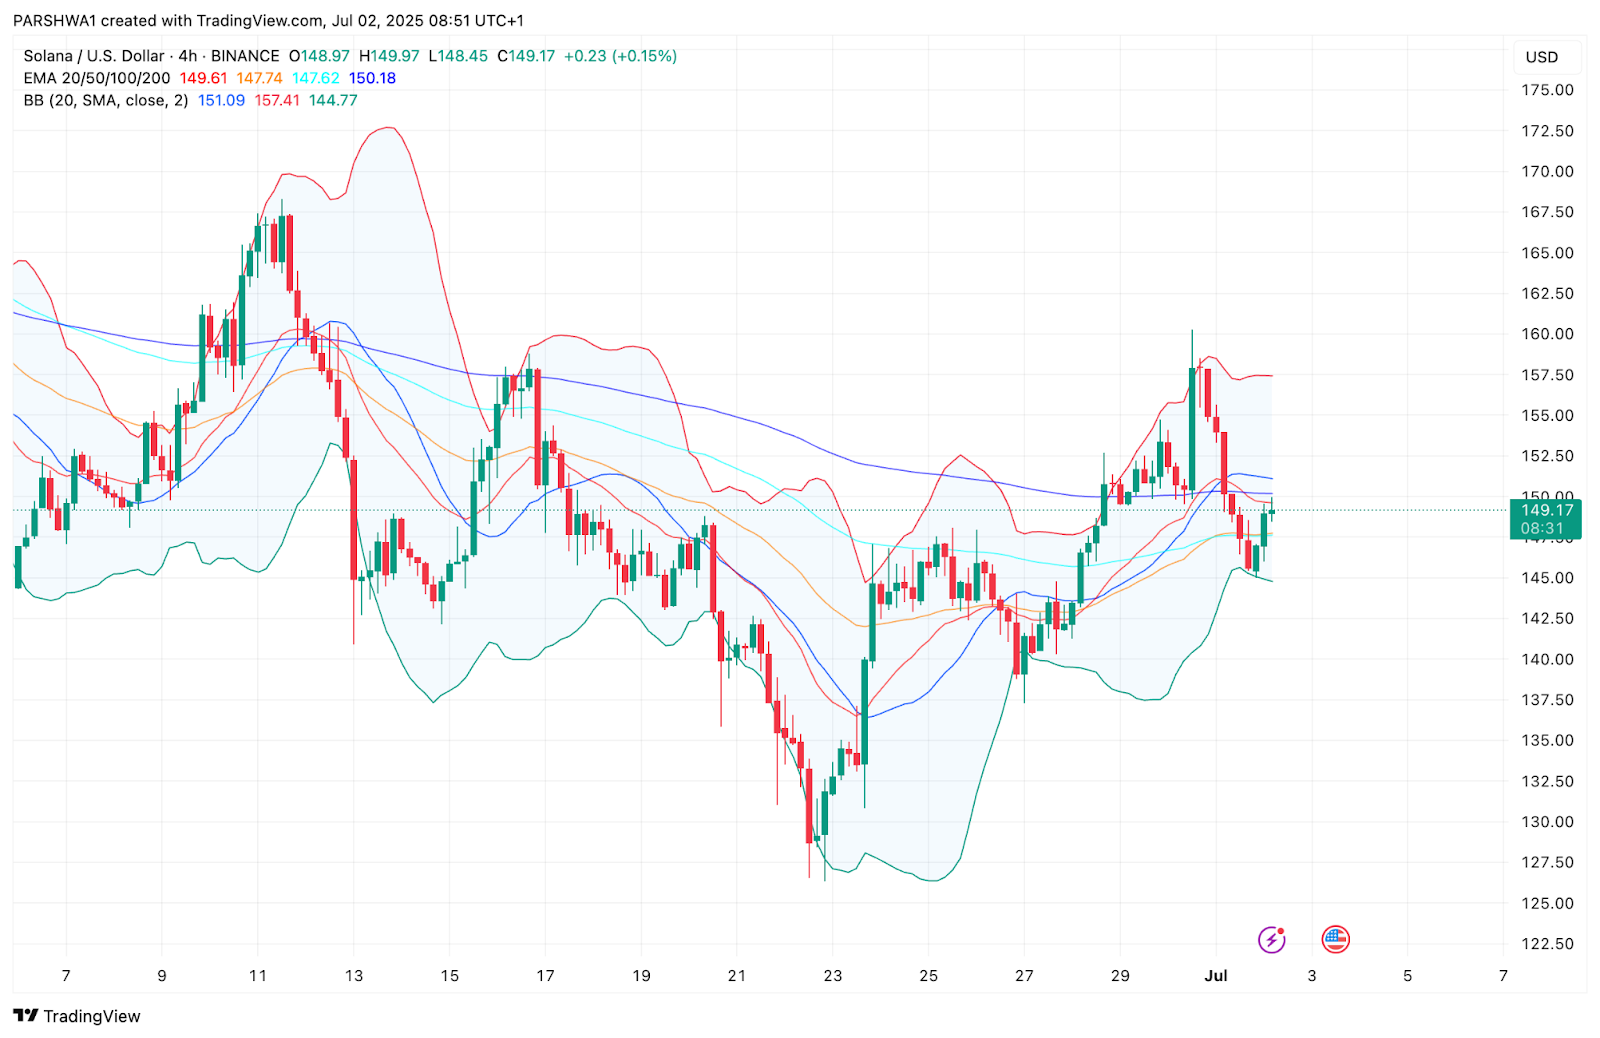
On the 4-hour chart, Solana price has recovered from the $144–$145 demand zone, bouncing back toward the $149 handle. The structure resembles a bullish flag breakout followed by a corrective dip and recent retest of breakout support. Price is currently hovering above the EMA 20/50/100 cluster, while EMA 200 remains a short-term ceiling at $150.18.
Volume profile and liquidity analysis show a BOS (break of structure) near $146.50 and another CHoCH (change of character) around $150. The current rebound confirms a reclaim of minor liquidity pockets below $147, with price now pressing into an order block stretching from $150 to $154.
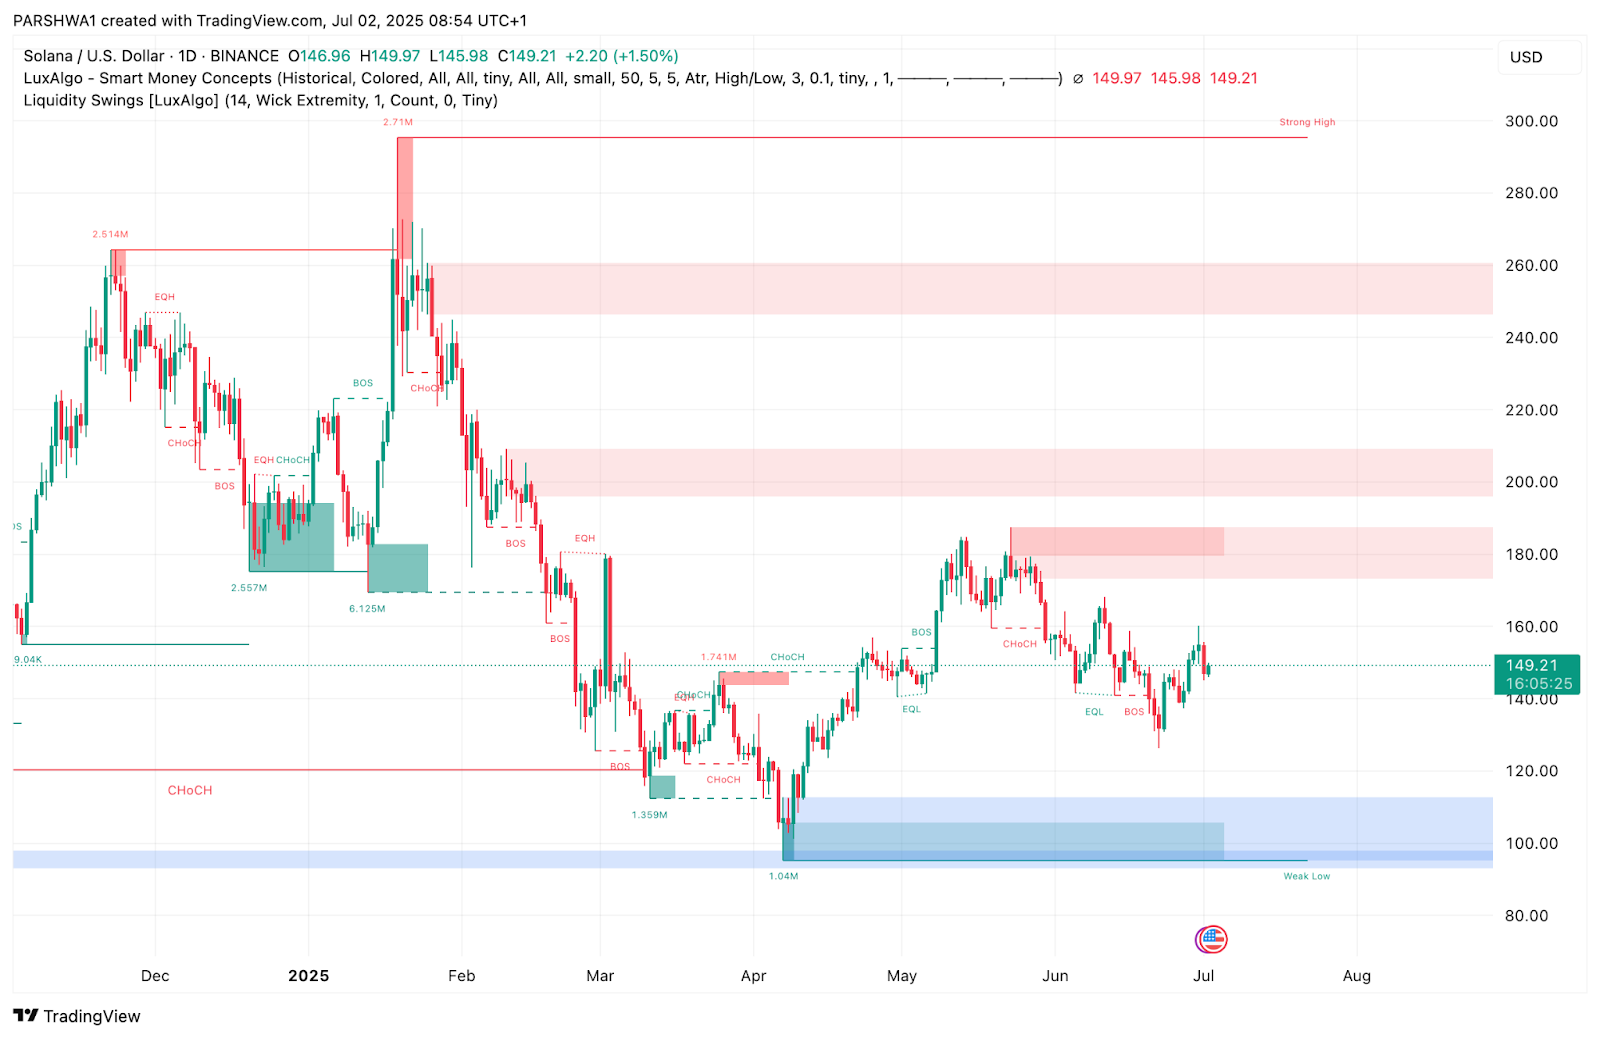
The daily Smart Money Concepts chart also shows SOL attempting to break through overlapping resistance near $149–$152. However, broader market sentiment and breakout follow-through remain critical for sustained upside.
Why Is the Solana Price Going Up Today?
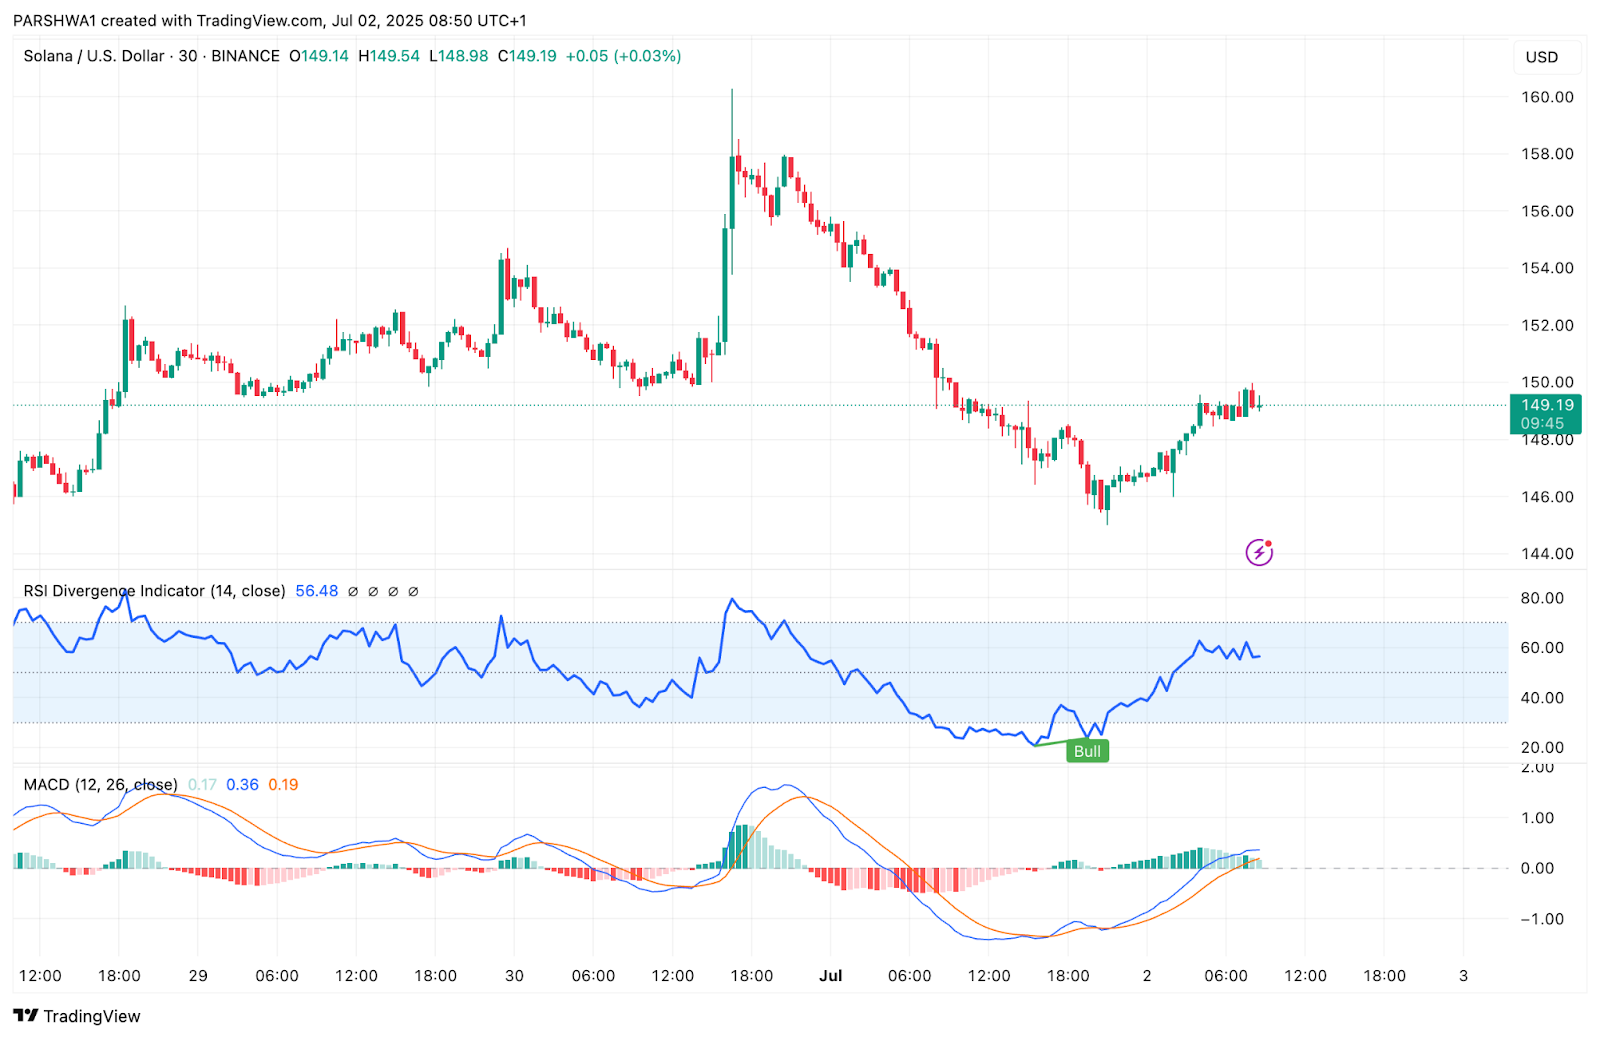
Intraday indicators are showing a moderate bullish shift. On the 30-minute chart, RSI divergence confirmed a hidden bullish divergence around $145, followed by a move back above the 50 mark. RSI currently stands at 56.48, reflecting increasing momentum.
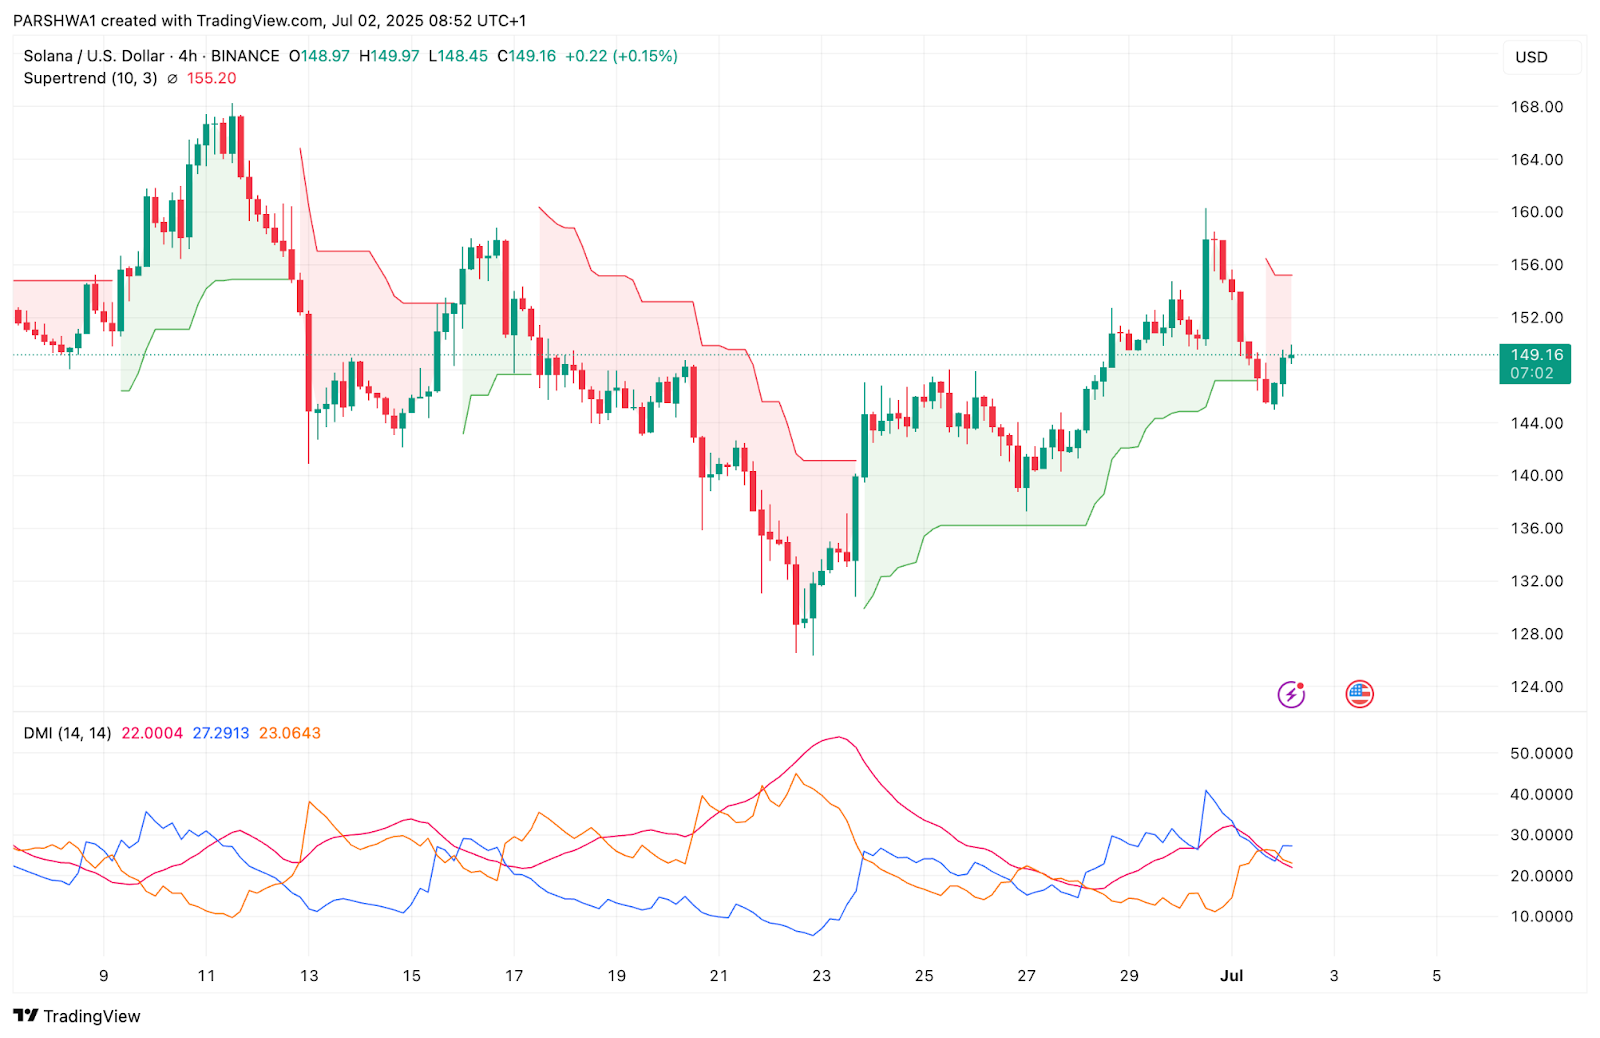
The MACD has printed a clean bullish crossover with widening histograms, suggesting continued upward energy. Meanwhile, the Supertrend on the 4-hour chart remains bullish, although the signal flip zone around $155 is yet to be conquered. The DMI lines show the +DI now slightly above the -DI, but ADX remains subdued, implying a need for more directional strength.
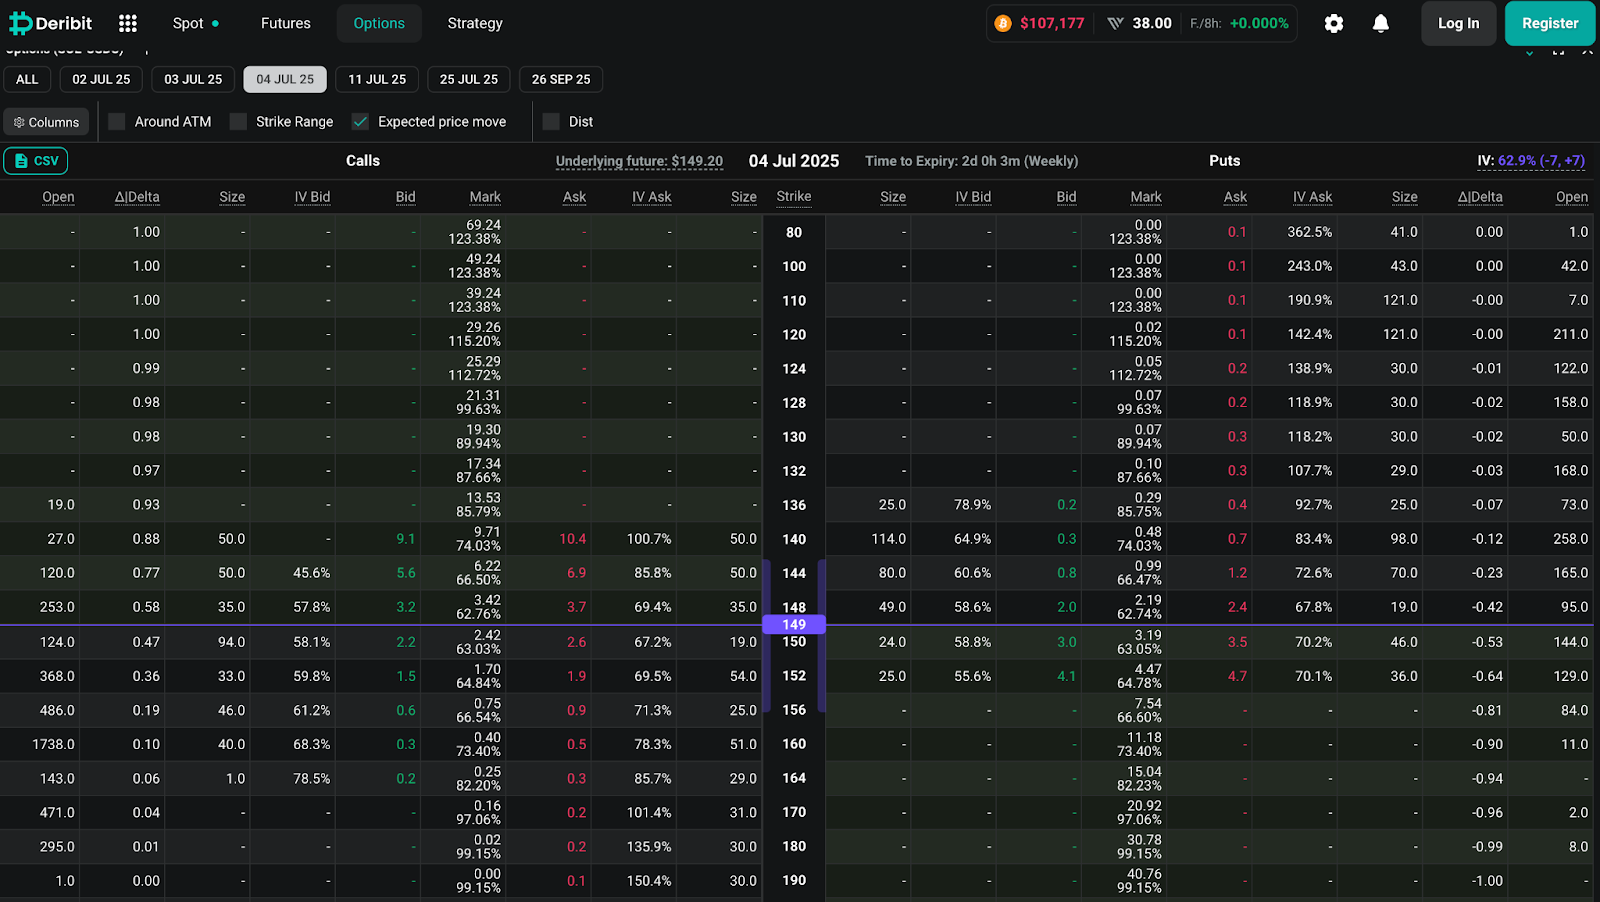
The options market supports this hesitation. Deribit data shows the 4 July expiry has high open interest around the $152 and $155 strikes. Implied volatility is dropping, indicating that the market does not expect a major breakout in the next 24–48 hours. This further confirms the likelihood of range-bound action below $155 unless volume surges.
Solana Price Indicators, Signals and Charts (24h)
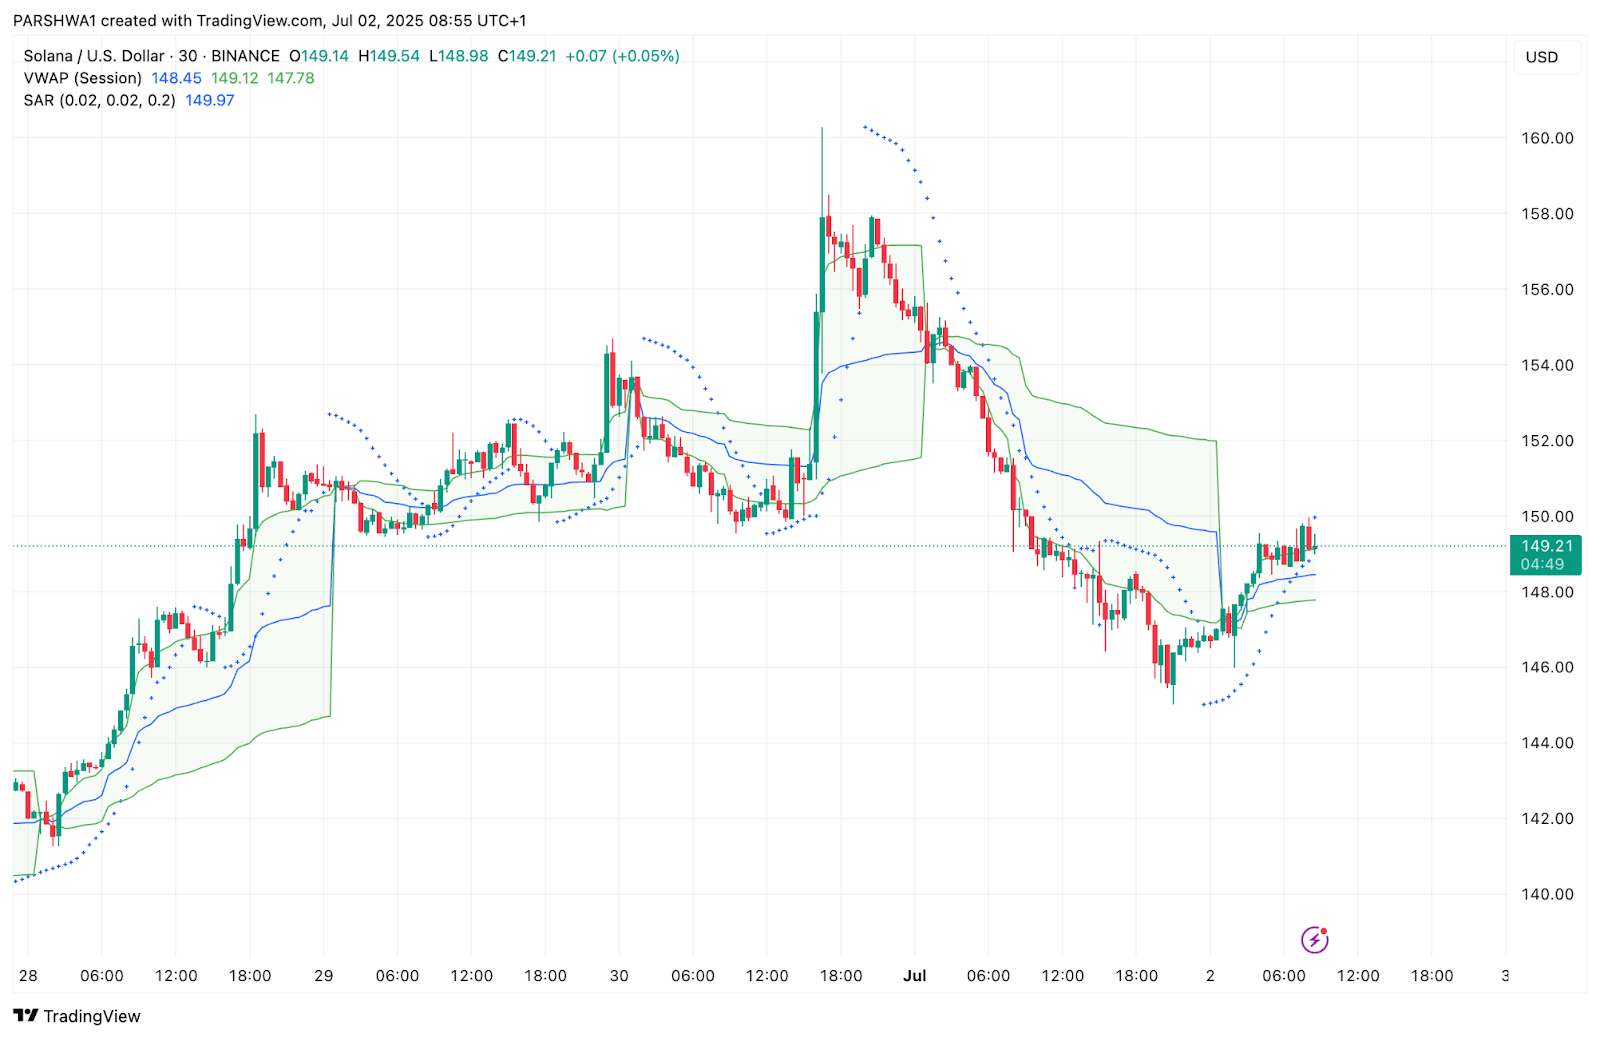
Bollinger Bands on the 4-hour chart are starting to widen after a compression phase. Solana is now approaching the upper band resistance at $151.09. The Parabolic SAR dots have flipped below the price, reinforcing the short-term uptrend.
The VWAP and price have now aligned at the $149 zone on the 30-minute chart, showing that price has returned to equilibrium after a low-volume dip. As long as price remains above the VWAP zone and below $152, Solana is likely to range with an upward skew.
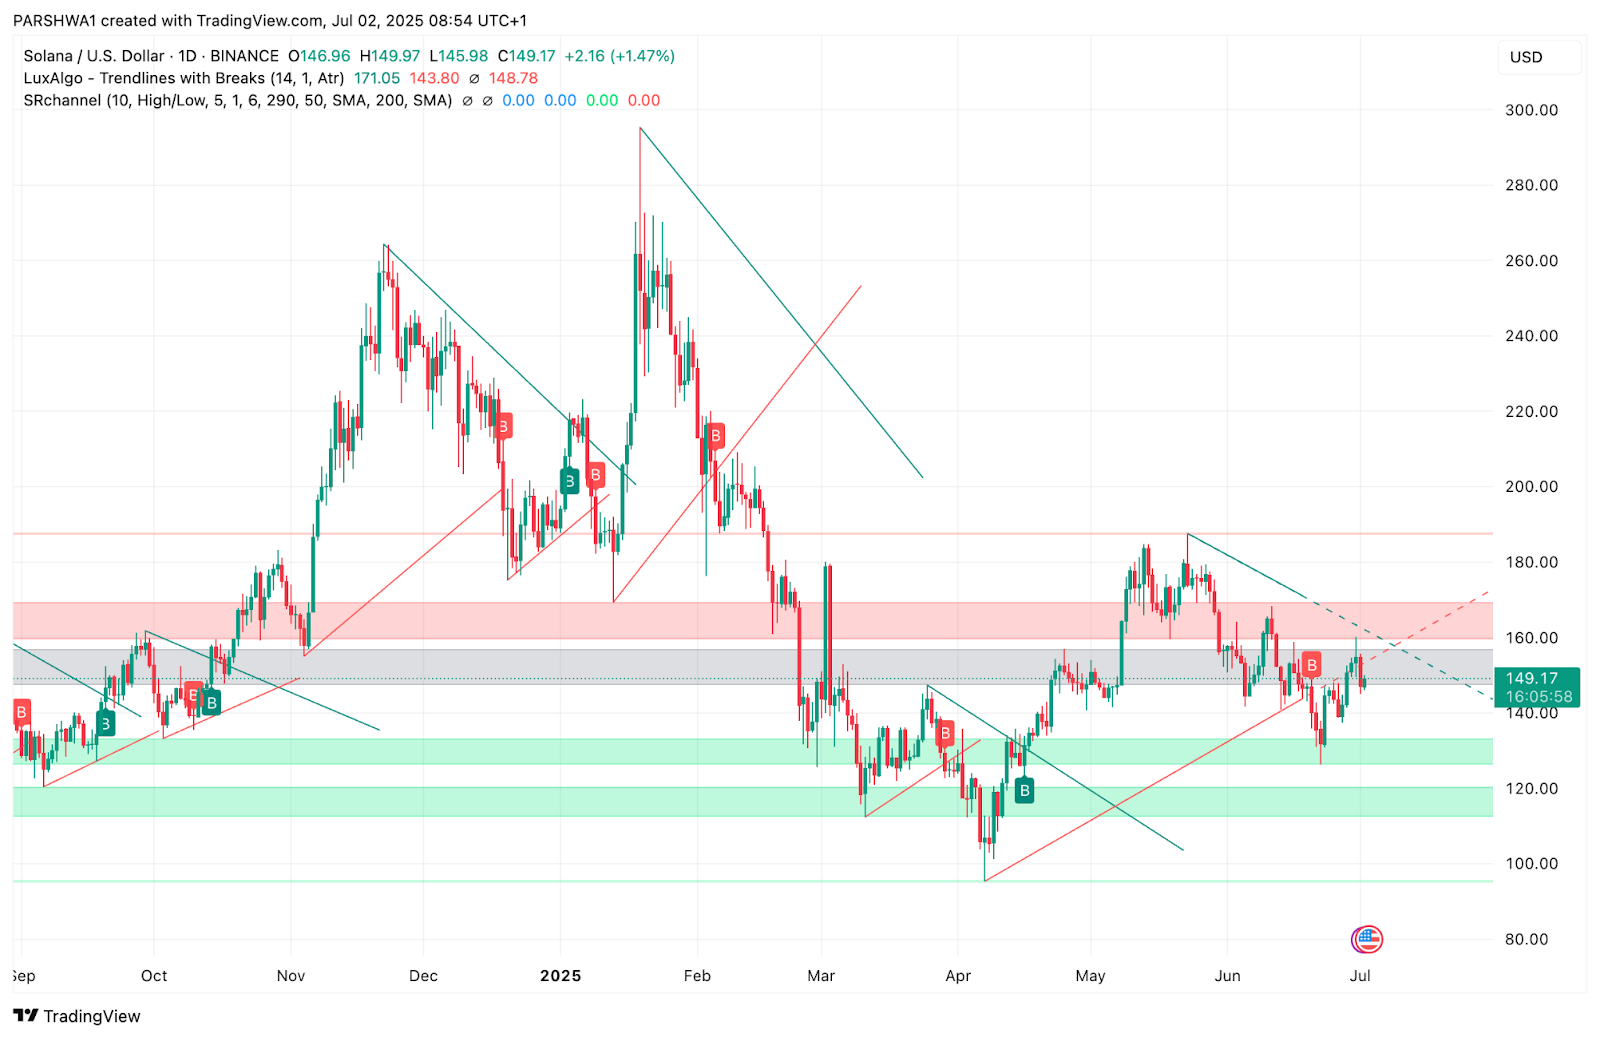
Daily structure analysis shows a longer-term descending trendline crossing at $160. For any meaningful rally to develop, SOL must clear the $155–$160 rejection zone with momentum and volume confirmation.
SOL Price Prediction: Short-Term Outlook (24h)
As it stands, Solana is entering a squeeze zone between $147 support and $151 resistance. If bulls manage a breakout above $152 backed by volume, the next upside targets lie at $155 and $160. On the downside, a failure to break $150 cleanly could send SOL back toward the $145 and $142.20 support range.
While trend momentum has shifted slightly bullish, the technical breakout must be validated by volume confirmation and option unwinding. Without these, Solana could revisit lower consolidation levels heading into the weekend.
Solana Price Forecast Table: July 3, 2025
| Indicator / Level | Value / Signal |
| Solana price today | $149.21 |
| Immediate Resistance | $151 / $152 / $155 |
| Key Support Levels | $147 / $145 / $142.20 |
| Supertrend (4H) | Bullish above $145 |
| RSI (30-min) | 56.48 (bullish momentum) |
| MACD (30-min) | Bullish crossover active |
| DMI (14) | +DI > -DI, weak ADX |
| SAR (30-min) | Bullish (dots below price) |
| VWAP Alignment | $149.12 (price near fair value) |
| Bollinger Bands (4H) | Widening, upper band at $151 |
| Options OI (July 4) | Clustered at $152–$155 strikes |
Disclaimer: The information presented in this article is for informational and educational purposes only. The article does not constitute financial advice or advice of any kind. Coin Edition is not responsible for any losses incurred as a result of the utilization of content, products, or services mentioned. Readers are advised to exercise caution before taking any action related to the company.
 Price Prediction 2025, 2026, 2027, 2028-2030")
 Price Prediction for July 3")

 Price Prediction for July 3")
 Price Prediction 2025, 2026, 2027, 2028–2030")
