
 Price Prediction for July 4")

Cardano’s sharp recovery from the $0.53 zone has lifted Cardano price today above the $0.60 mark, a critical psychological level. After weeks of sustained selling pressure, ADA price has staged a short-term reversal, breaking multiple intraday trendlines and reclaiming a key support structure. However, signs of buyer exhaustion are beginning to emerge near resistance around $0.613.
What’s Happening With Cardano’s Price?
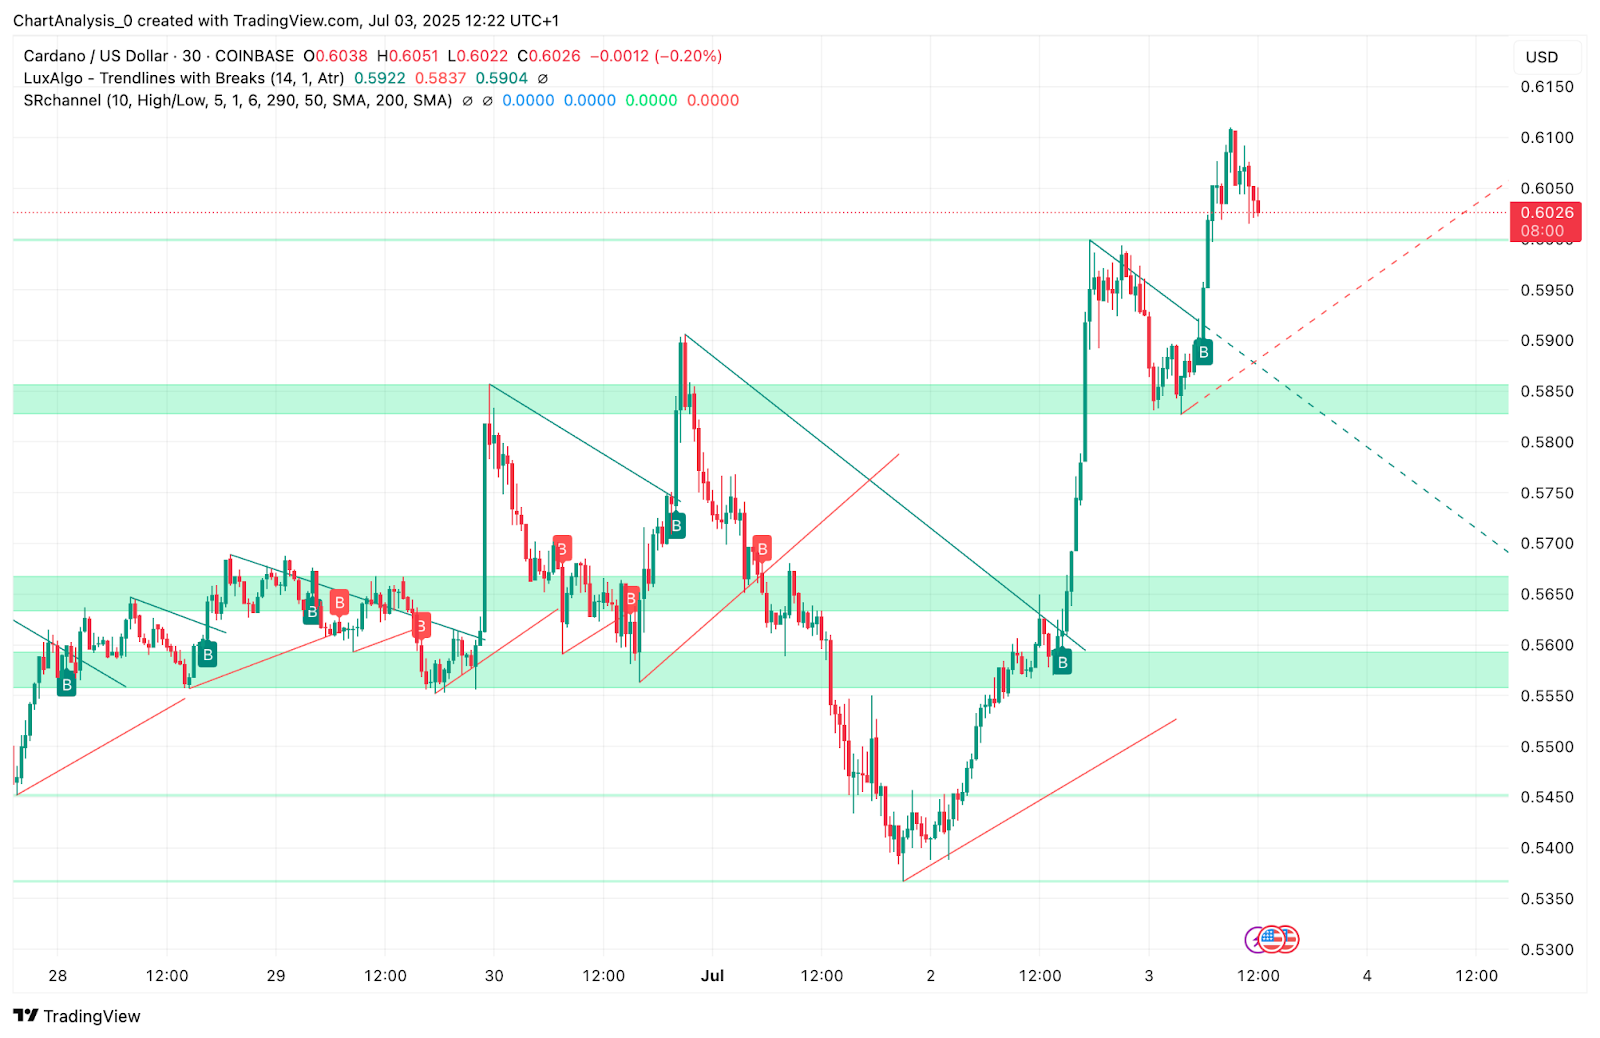
The 30-minute chart reveals a vertical rally that initiated from the $0.545 region on July 2, following a failed breakdown and liquidity sweep below the $0.555 support band. This move broke a major descending trendline and flipped multiple supply zones into support, most notably the $0.582–$0.590 region.
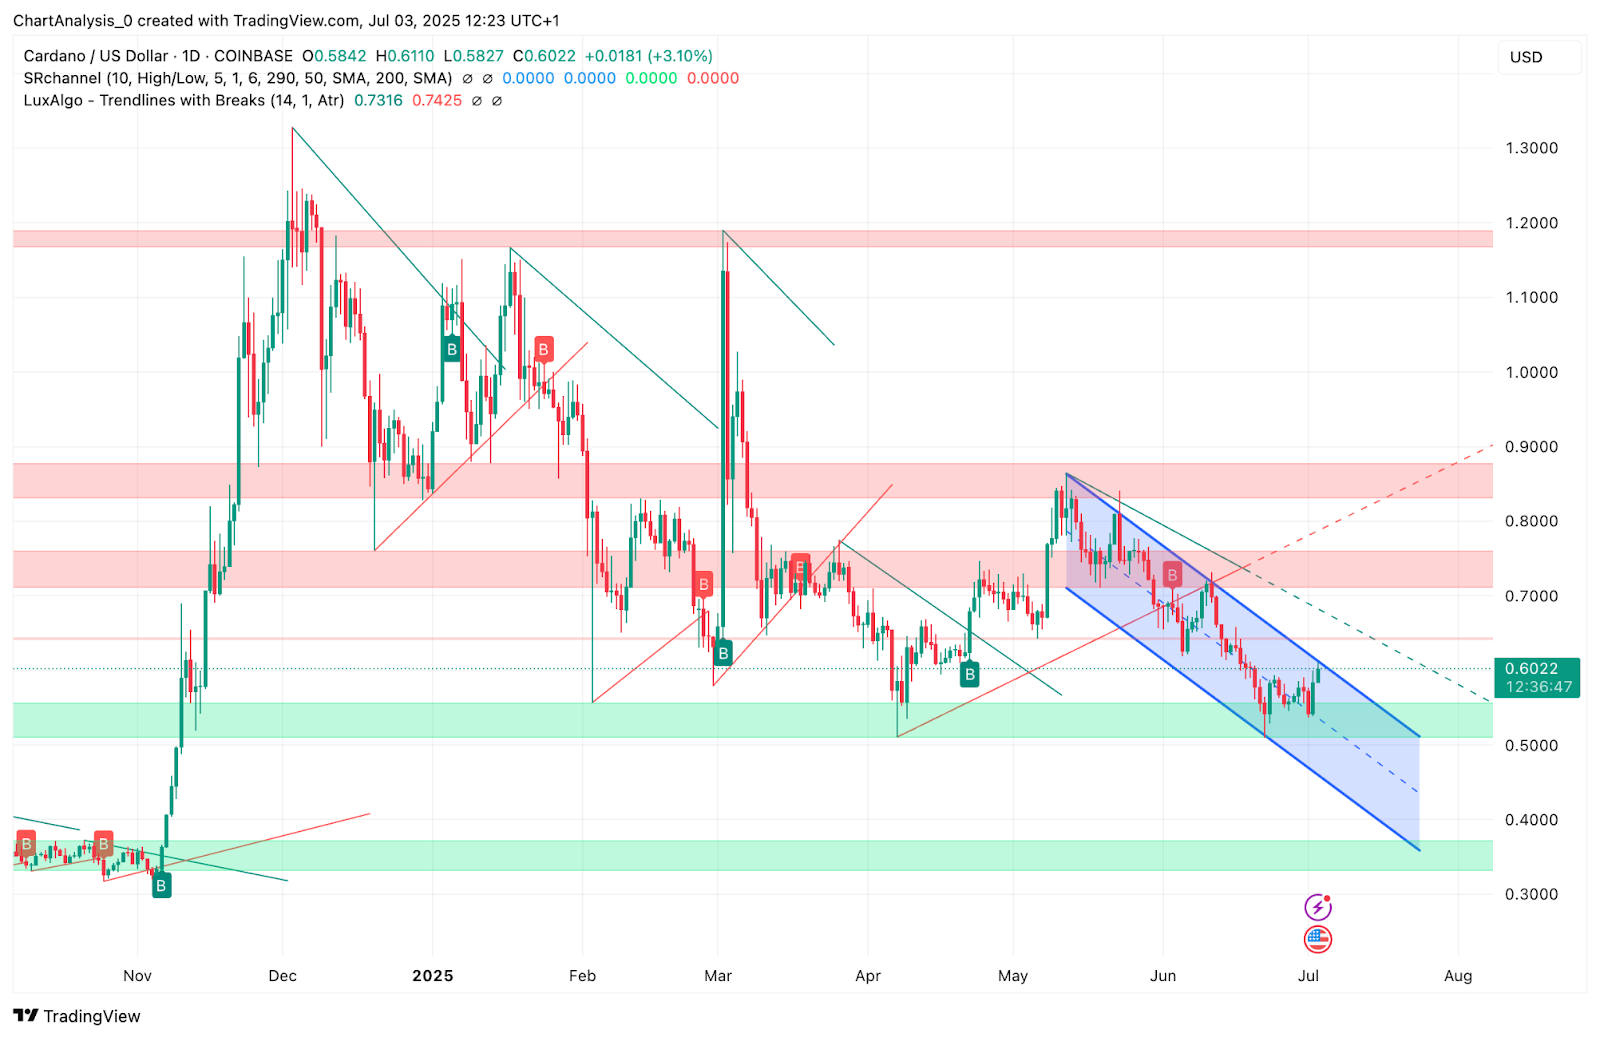
On the daily chart, Cardano price action shows ADA attempting to exit a falling channel that has trapped it since May. A bullish candle close above the upper bound of this channel would confirm a breakout and expose higher resistance levels at $0.648 and $0.679 (R4 and R5 pivot points). Still, ADA needs to hold $0.590 on retests to avoid falling back into the channel range.
Market structure shows bullish BOS (break of structure) confirmation, with the RSI on lower timeframes nearing 56.5, suggesting bullish momentum but also hinting at potential short-term exhaustion if price fails to push past $0.613.
Why Is the Cardano Price Going Up Today?
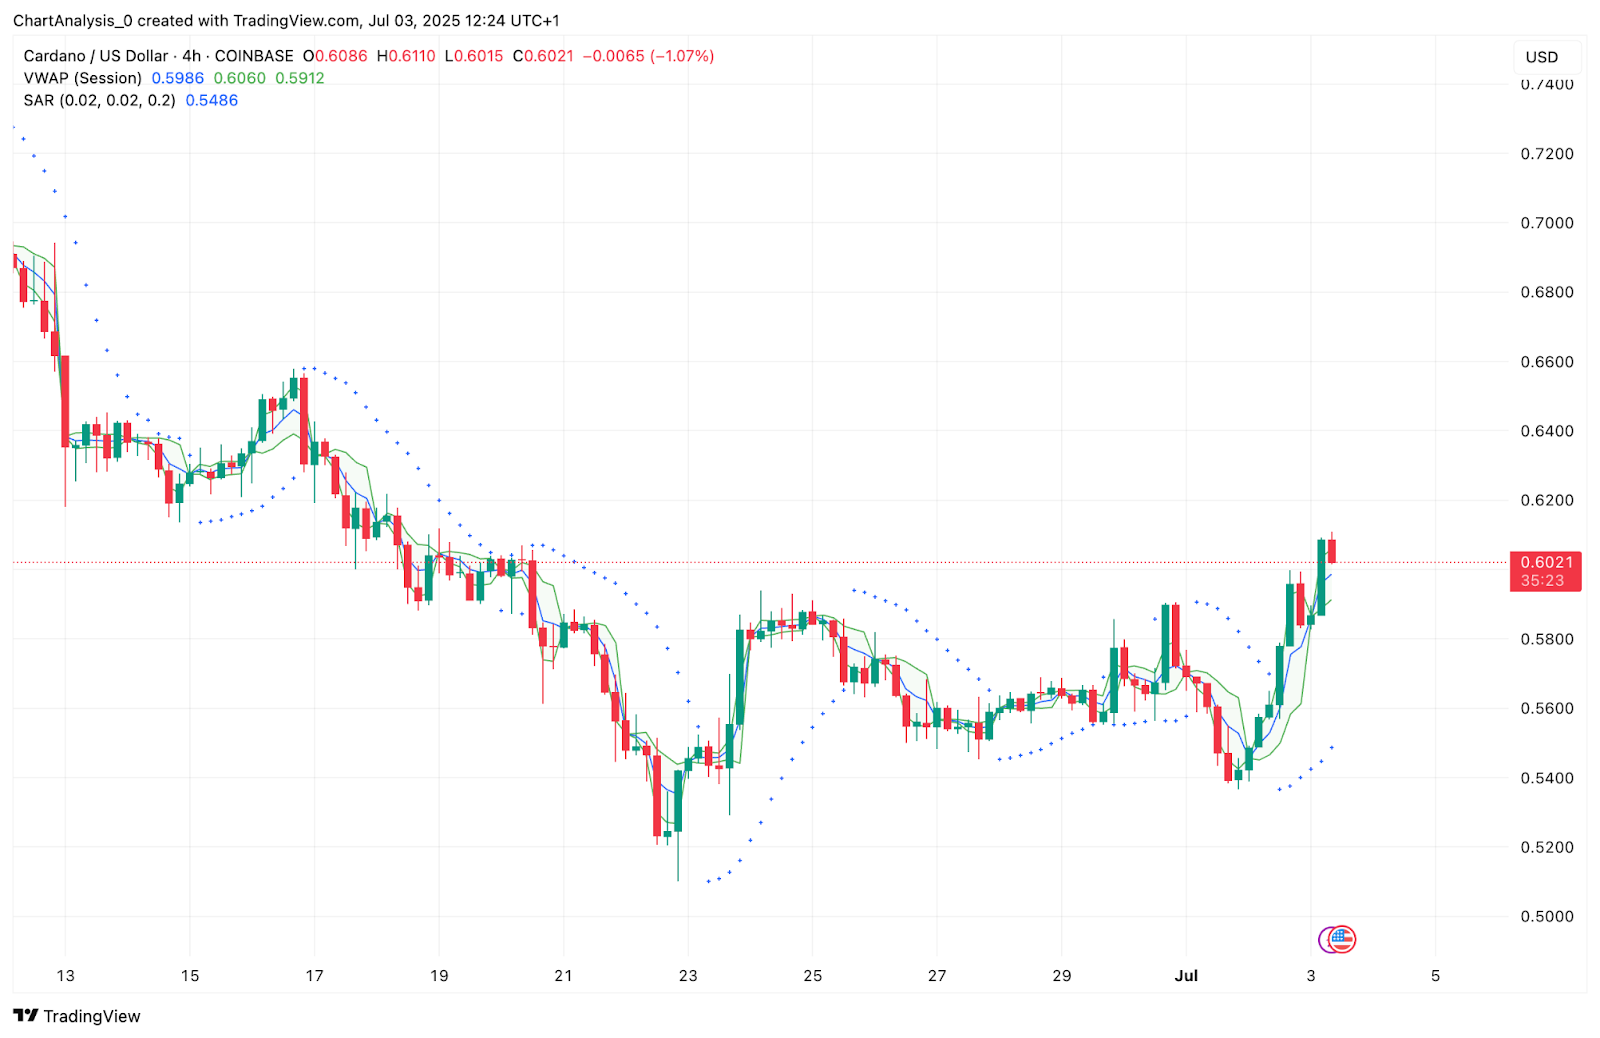
Why Cardano price going up today can be traced to a clear shift in short-term sentiment, backed by both on-chain data and technical confirmation. The Parabolic SAR has flipped below price on the 4-hour chart, signaling trend continuation. Meanwhile, the VWAP shows ADA trading above both session averages and intraday volume zones, a bullish signal often seen before continuation moves.
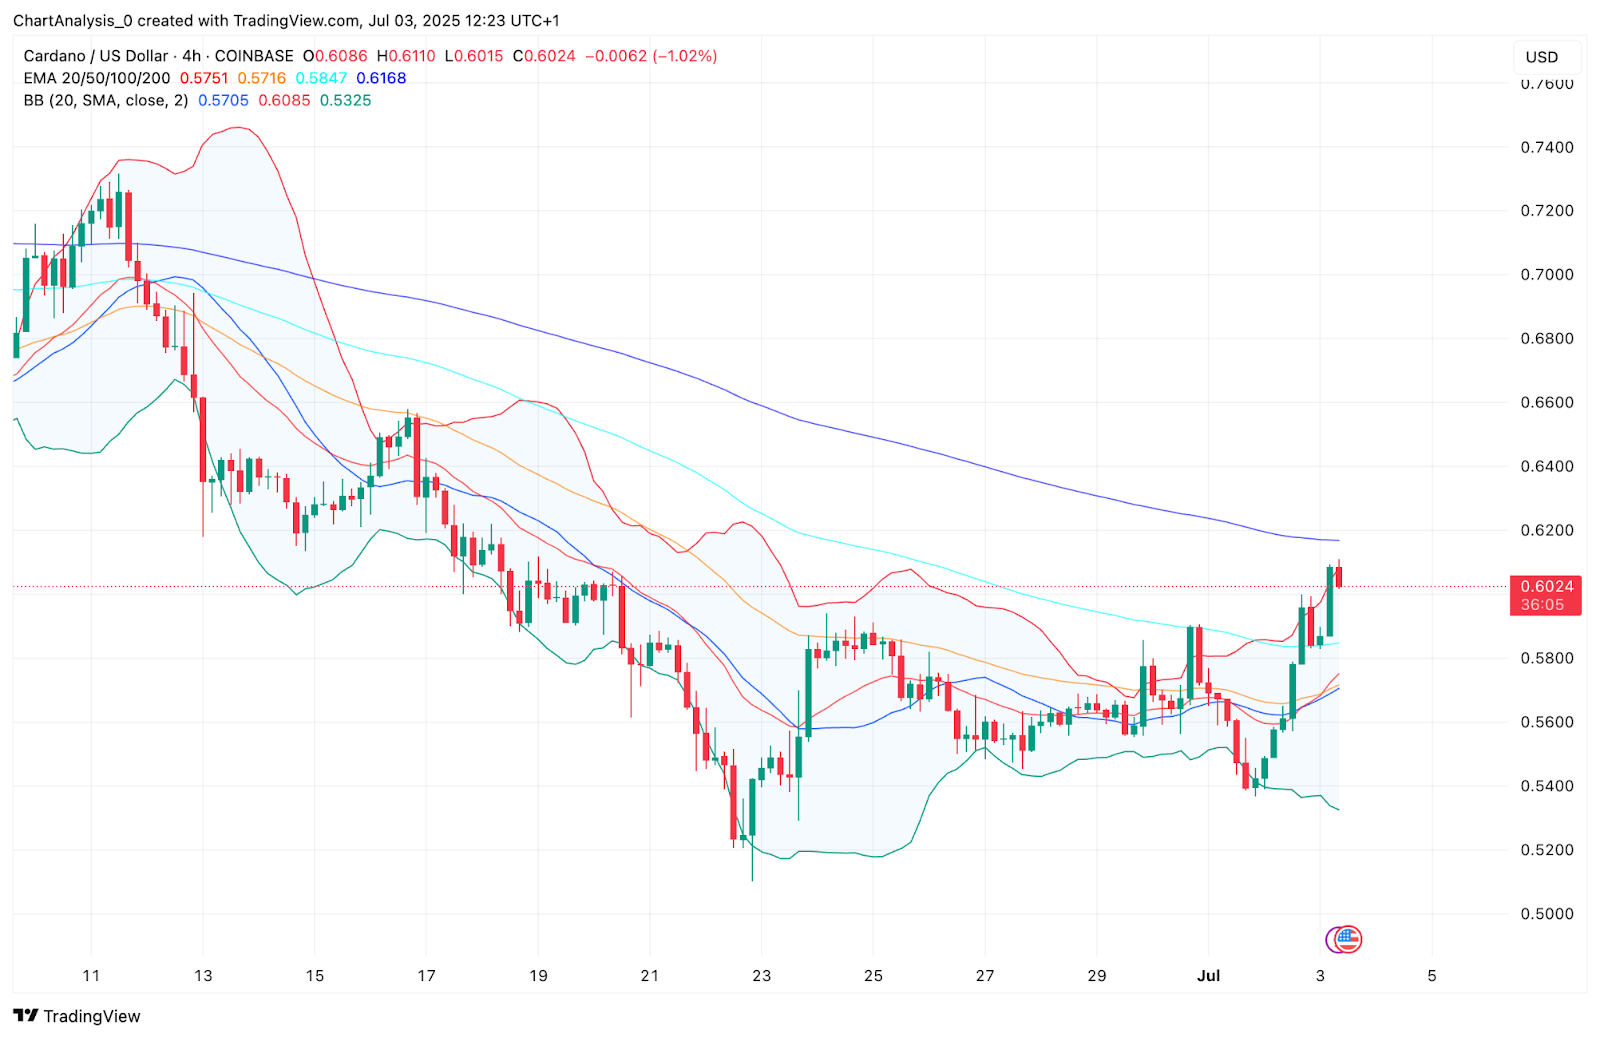
Additionally, Bollinger Bands on the 4-hour chart have expanded, with price testing the upper band near $0.610. This volatility expansion follows a multi-day compression, adding to the probability of a directional trend continuation.
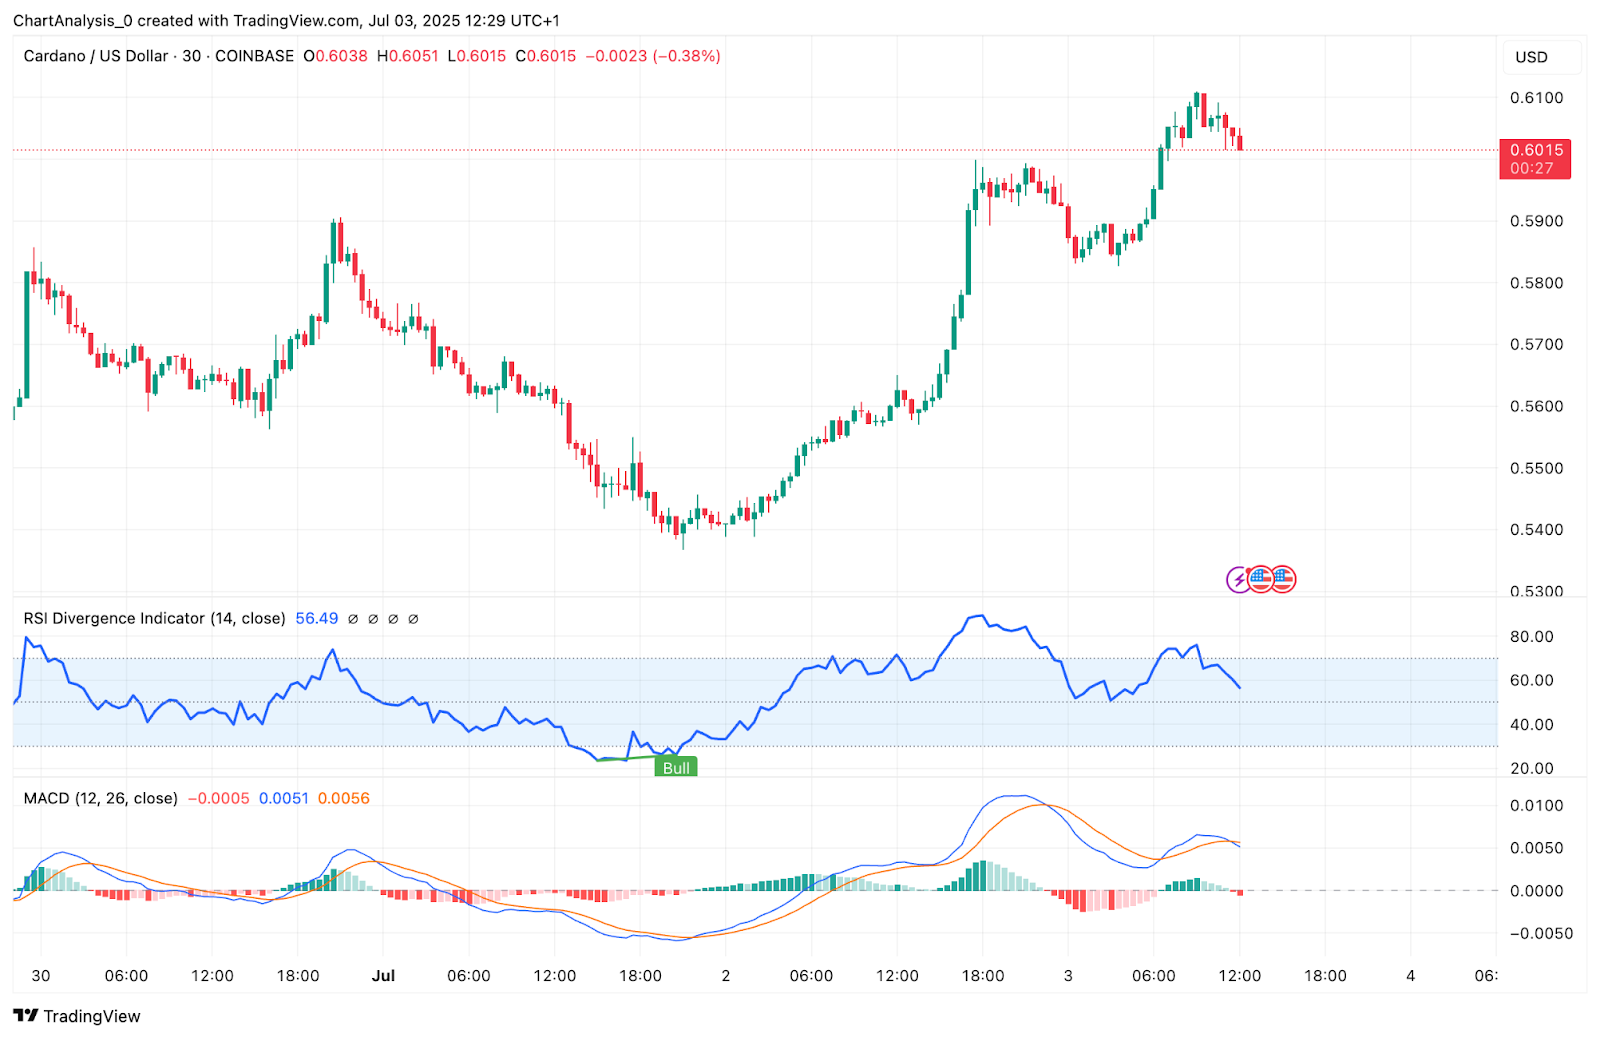
From a momentum perspective, MACD has flipped positive with the histogram turning green, and the RSI remains elevated. However, the RSI has started to slightly curve down, suggesting that immediate upside could be limited without consolidation.
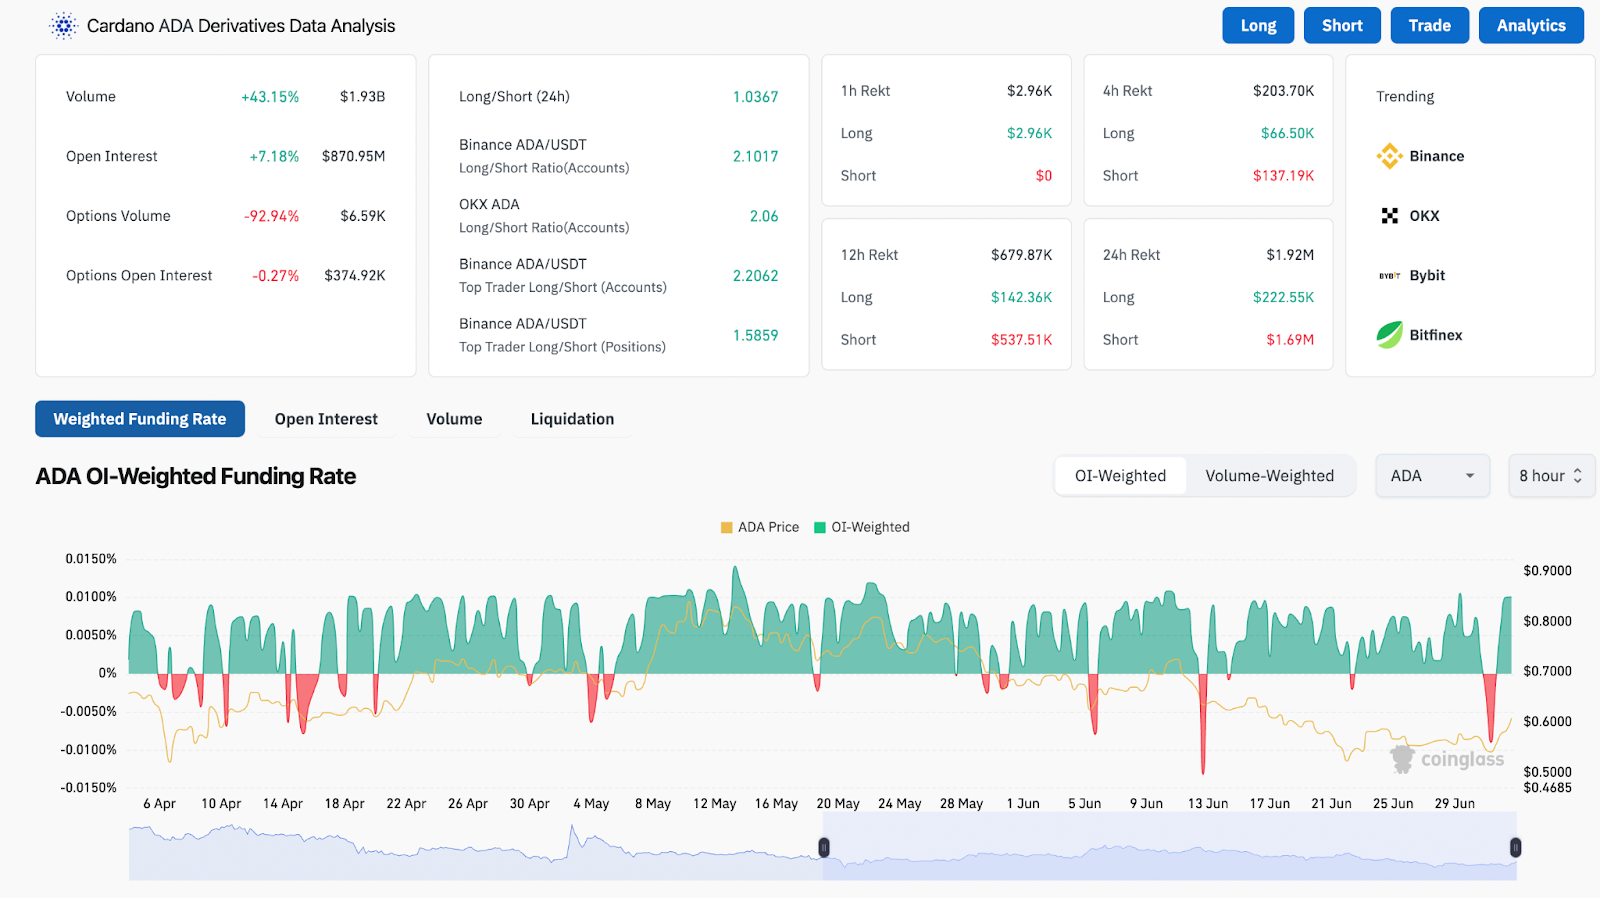
On the derivatives side, open interest surged by over 7% alongside a 43% increase in 24h trading volume. The funding rate remains positive, reflecting bullish expectations. Long/short ratios across Binance and OKX show more than 2:1 long dominance, further reinforcing the upside bias in speculative positioning.
Cardano Price Action Tests Key Confluence of Indicators
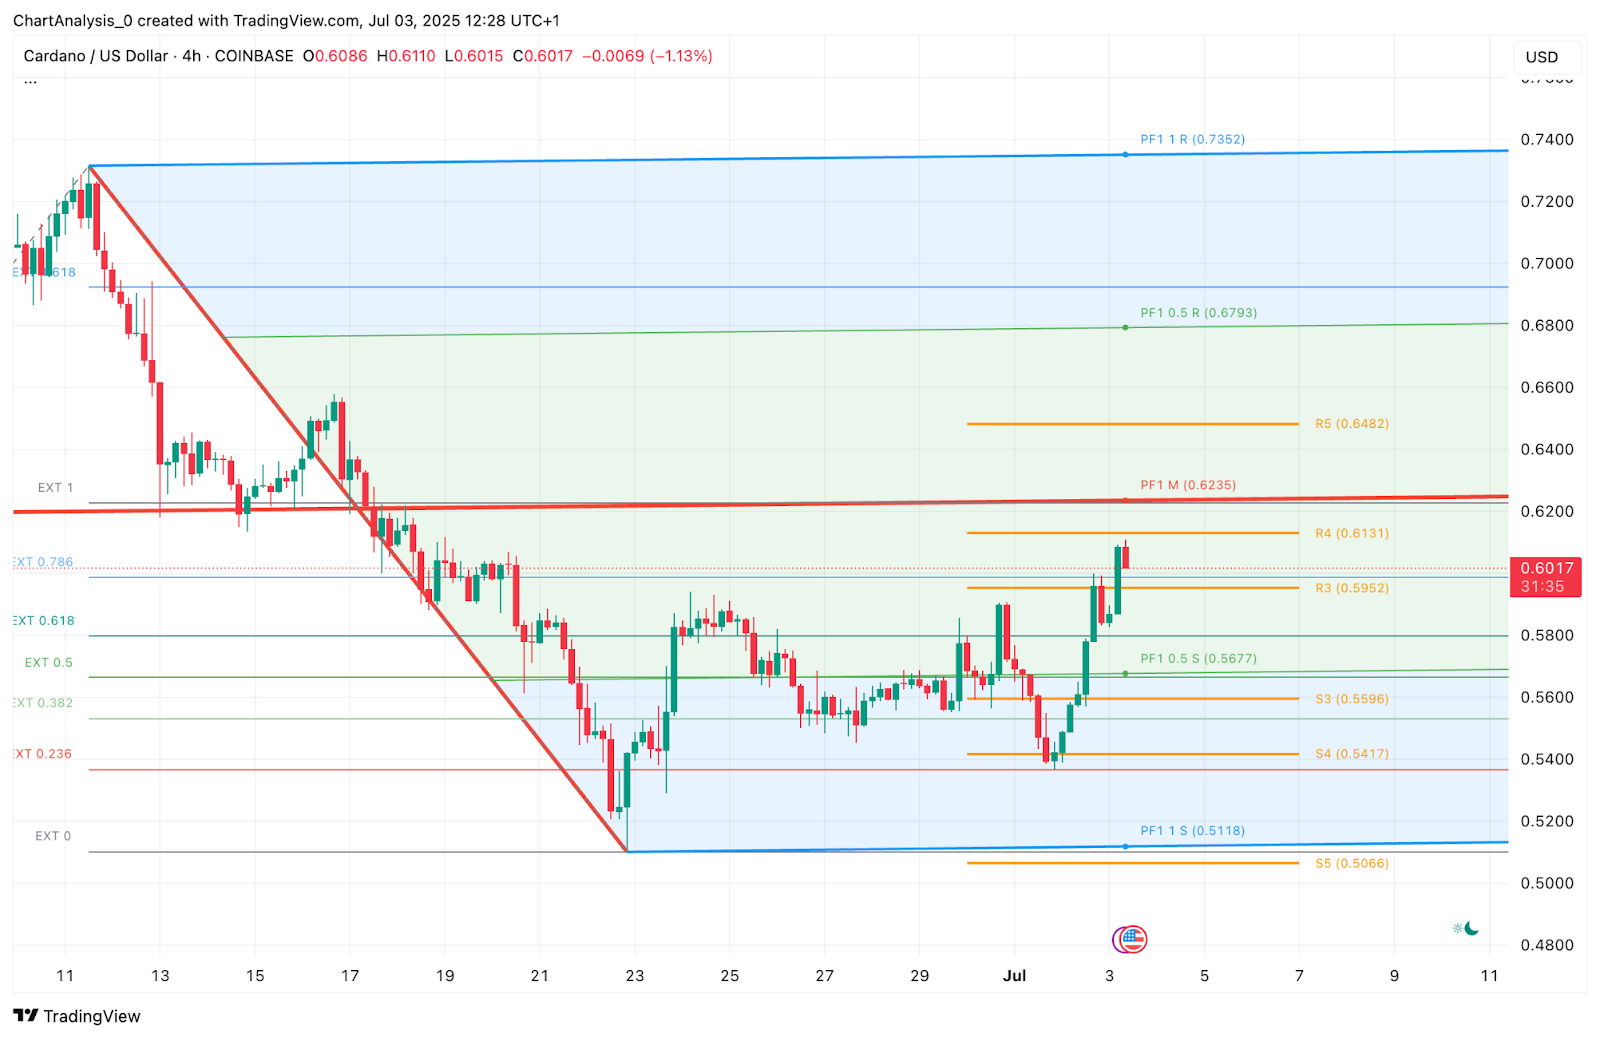
ADA is currently stalling at the R4 pivot level near $0.613, which also aligns with a local supply zone seen on the 4-hour chart. This zone previously acted as a breakdown level in late June, and unless buyers push through with volume, a rejection and retest of lower supports around $0.590 or $0.567 becomes likely.
The Fibonacci retracement plotted from the $0.735 high to the $0.505 low shows that ADA has reached the 38.2% zone, which often serves as a temporary rejection point. A clean break above this would open up the 50% and 61.8% levels at $0.620 and $0.648 respectively, but only if buyers defend current levels.
With the 100 and 200 EMA (on the 4H chart) still above at $0.616 and $0.635, ADA remains in a broader bearish context unless these are reclaimed. Short-term bulls must treat the current push as a recovery phase within a larger downtrend until proven otherwise.
ADA Price Prediction: Short-Term Outlook (24h)
Cardano price volatility is expected to remain high going into July 4. If bulls can defend the $0.590–$0.595 zone, the next push could retest $0.620 and then challenge the high-volume resistance near $0.648. However, failure to hold above $0.590 may pull price back toward the $0.567 support pivot.
The MACD remains supportive for now, but traders should closely monitor for bearish crossover signals and any breakdown of VWAP or SAR confirmations.
Cardano Price Forecast Table: July 4, 2025
| Indicator / Level | Value / Signal | Notes |
| Cardano price today | $0.602 | Retesting $0.613 resistance |
| Resistance 1 | $0.613 | Pivot R4 + supply zone |
| Resistance 2 | $0.648 | Fibonacci 0.618 + R5 |
| Support 1 | $0.590 | Retest zone + local demand |
| Support 2 | $0.567 | Pivot support + EMA50 |
| RSI (30-min) | 56.5 | Bullish, but nearing overbought |
| MACD (4H) | Bullish crossover | Momentum still positive |
| Bollinger Bands (4H) | Expanding | Suggesting volatility breakout |
| Parabolic SAR | Bullish | Dots below price |
| VWAP | $0.598 | Price trading above VWAP |
| Open Interest | +7.18% | Bullish rise in participation |
| Long/Short Ratio (Binance) | 2.10 | Bullish leverage positioning |
Disclaimer: The information presented in this article is for informational and educational purposes only. The article does not constitute financial advice or advice of any kind. Coin Edition is not responsible for any losses incurred as a result of the utilization of content, products, or services mentioned. Readers are advised to exercise caution before taking any action related to the company.


 Price Prediction for July 4")

 Price Prediction for July 4")
