
 Price Prediction for July 5")

After failing to sustain above the $154 resistance level, Solana price today has pulled back toward the $150.50 region. Despite last week’s bullish breakout above descending trendline resistance, momentum is now fading as traders reassess risk in a low-volume environment. At the time of writing, SOL is down 1.2% on the day, hovering near $150.65.
What’s Happening With Solana’s Price?
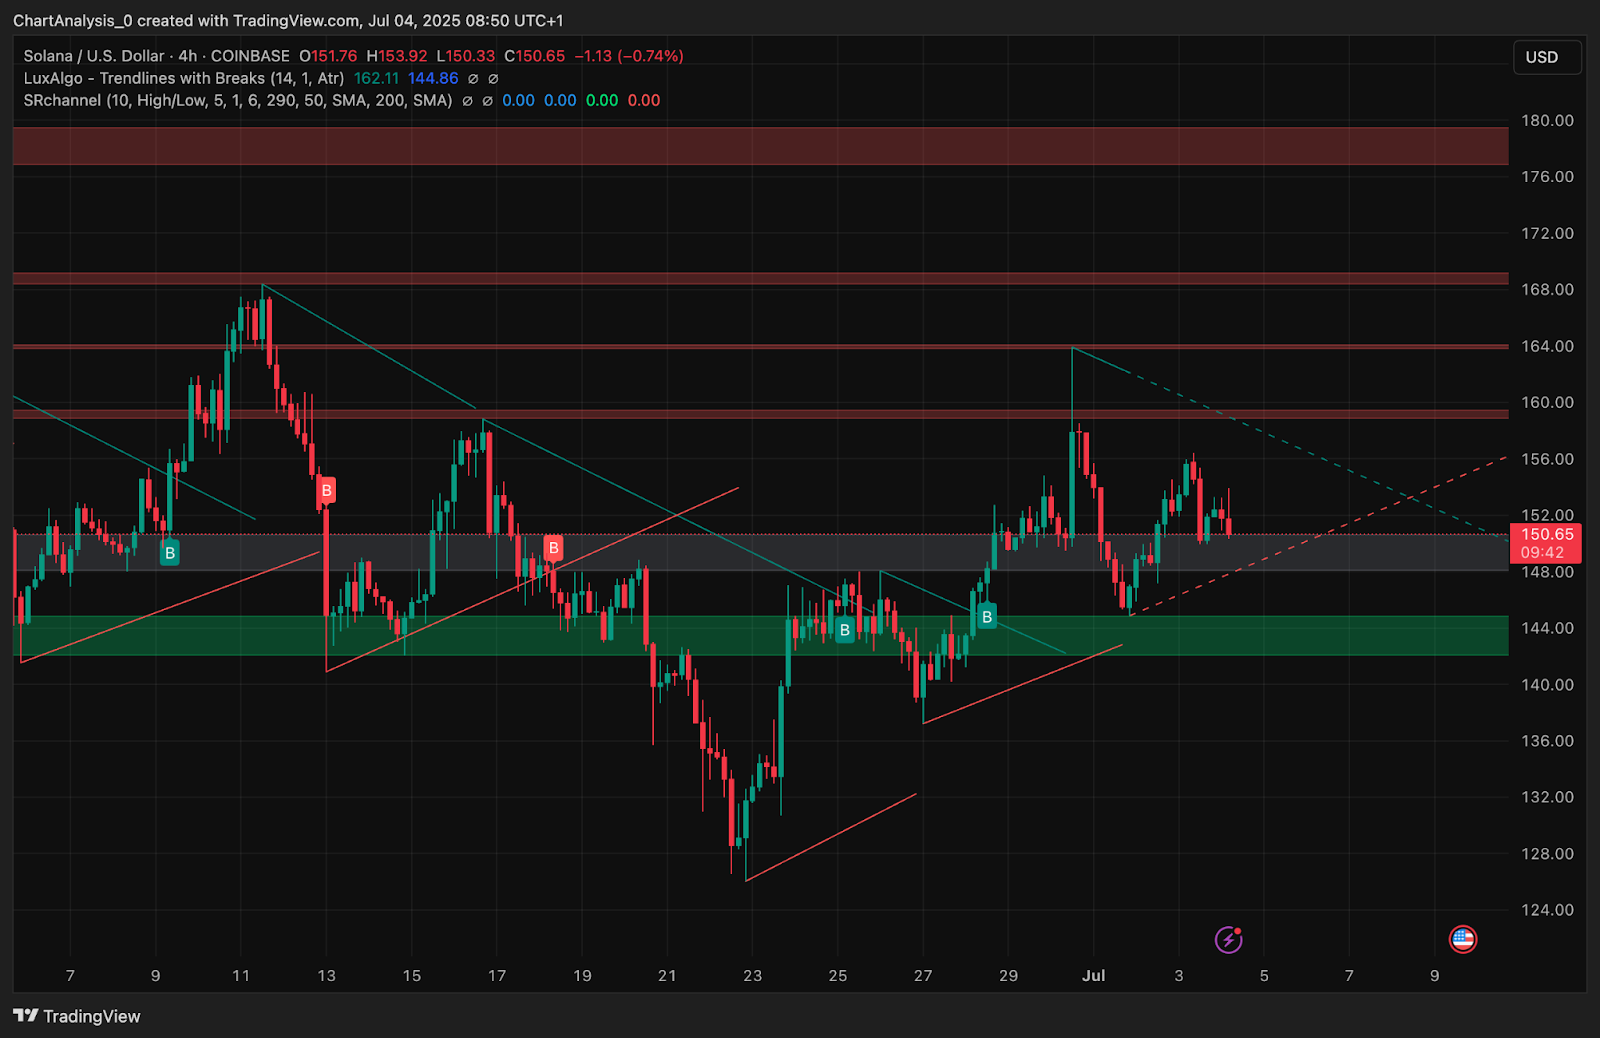
Solana price action has entered a key compression zone. On the 4-hour chart, SOL broke above the June descending wedge but has since rejected the $154.20–$157.50 resistance cluster. This area also corresponds with a volume node and the upper boundary of the descending triangle that has capped price action since April.
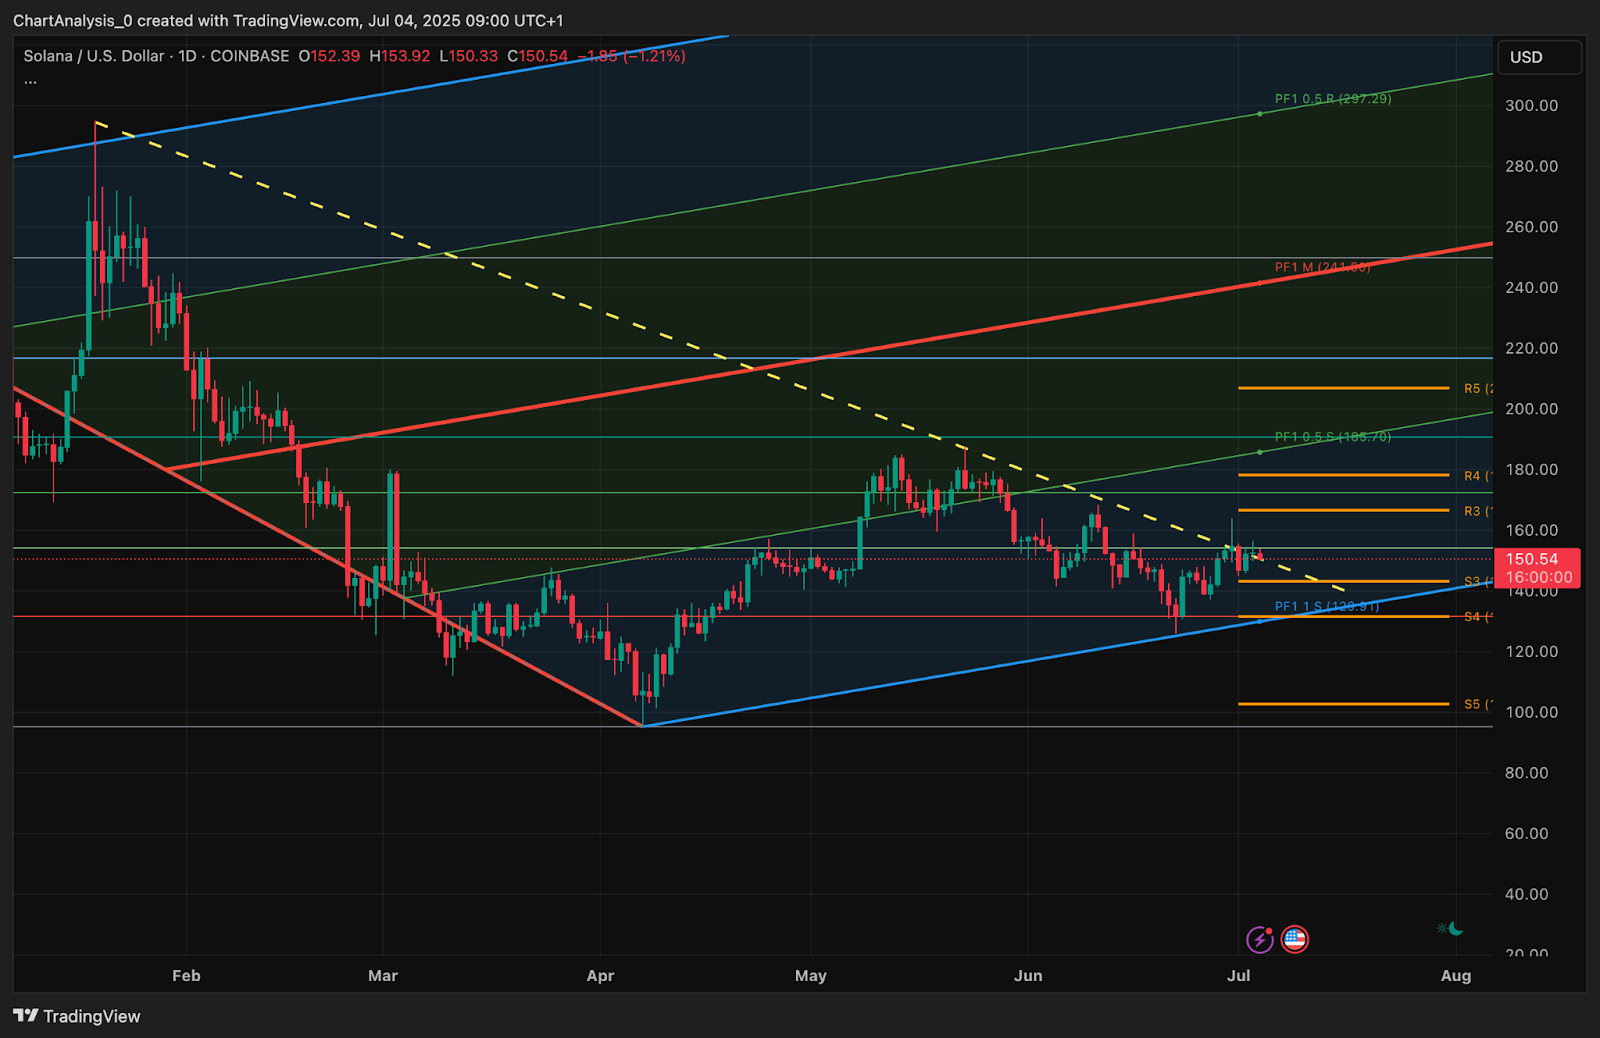
The 1D chart shows SOL is nearing the apex of a longer-term symmetrical triangle, formed between the $144–$154 consolidation zone and broader diagonal resistances. If bulls fail to defend the current higher low structure near $148, SOL may revisit the lower support trendline near $142.
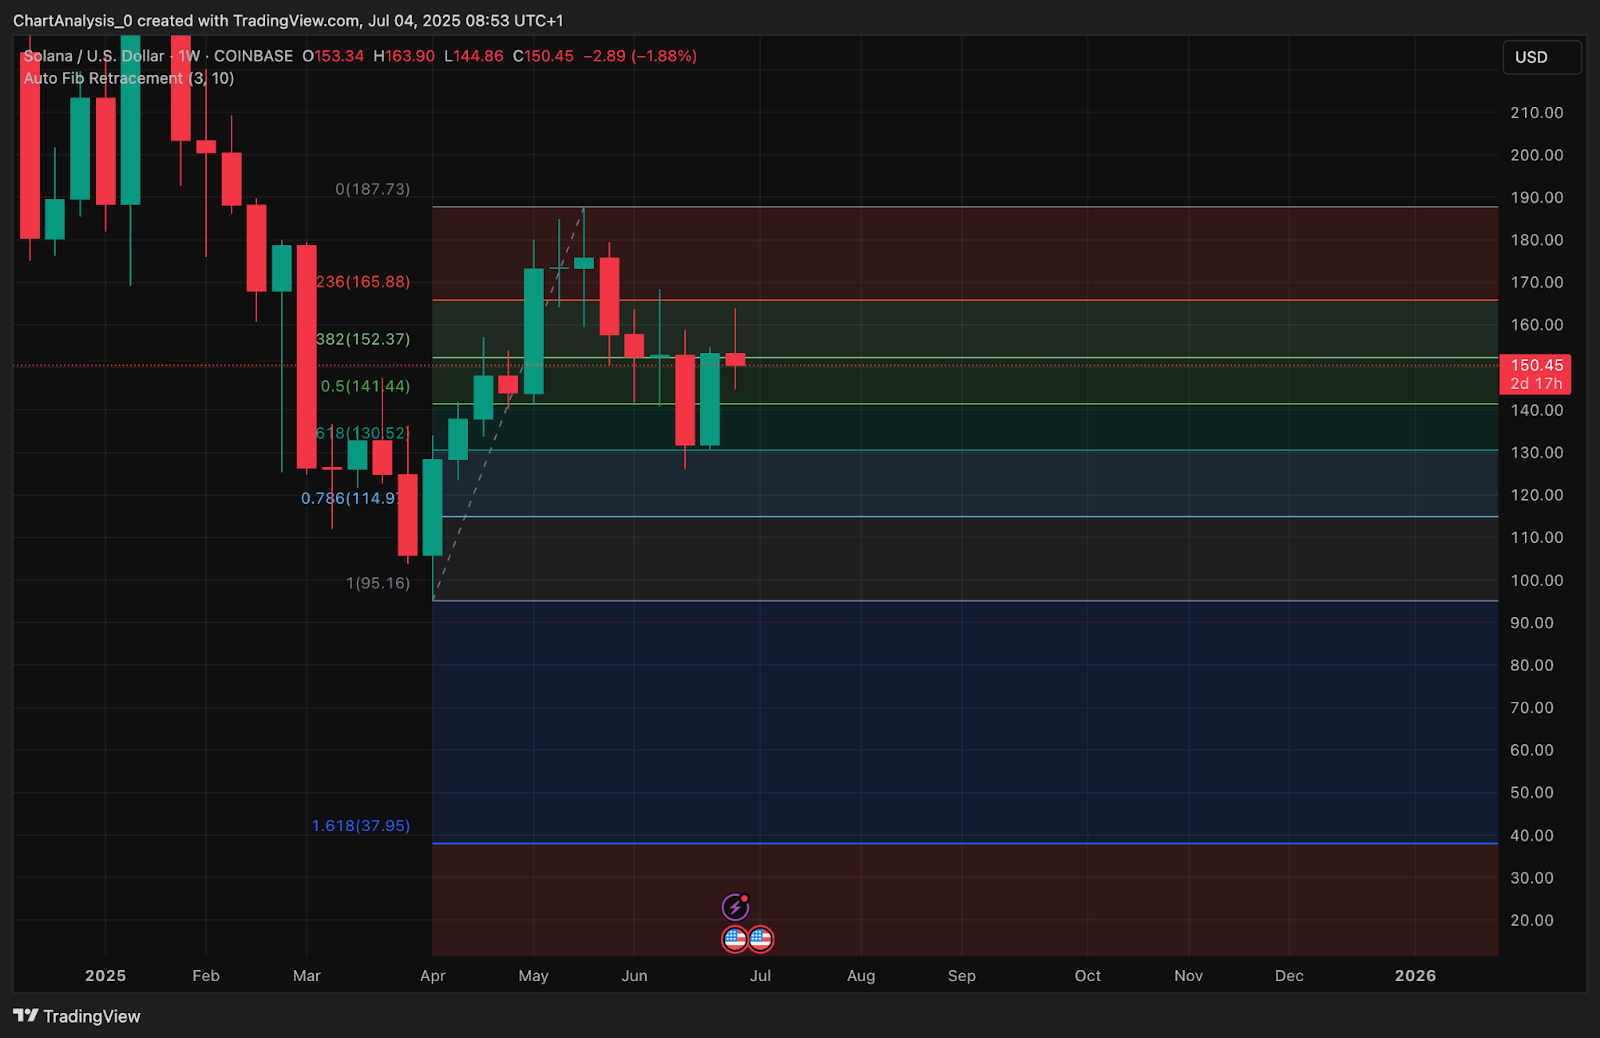
Weekly Fibonacci levels show that SOL is struggling just below the 0.382 retracement at $152.37. A failure to reclaim this level decisively would shift bias back toward the 0.5 zone at $141.44.
Why Is the Solana Price Going Down Today?
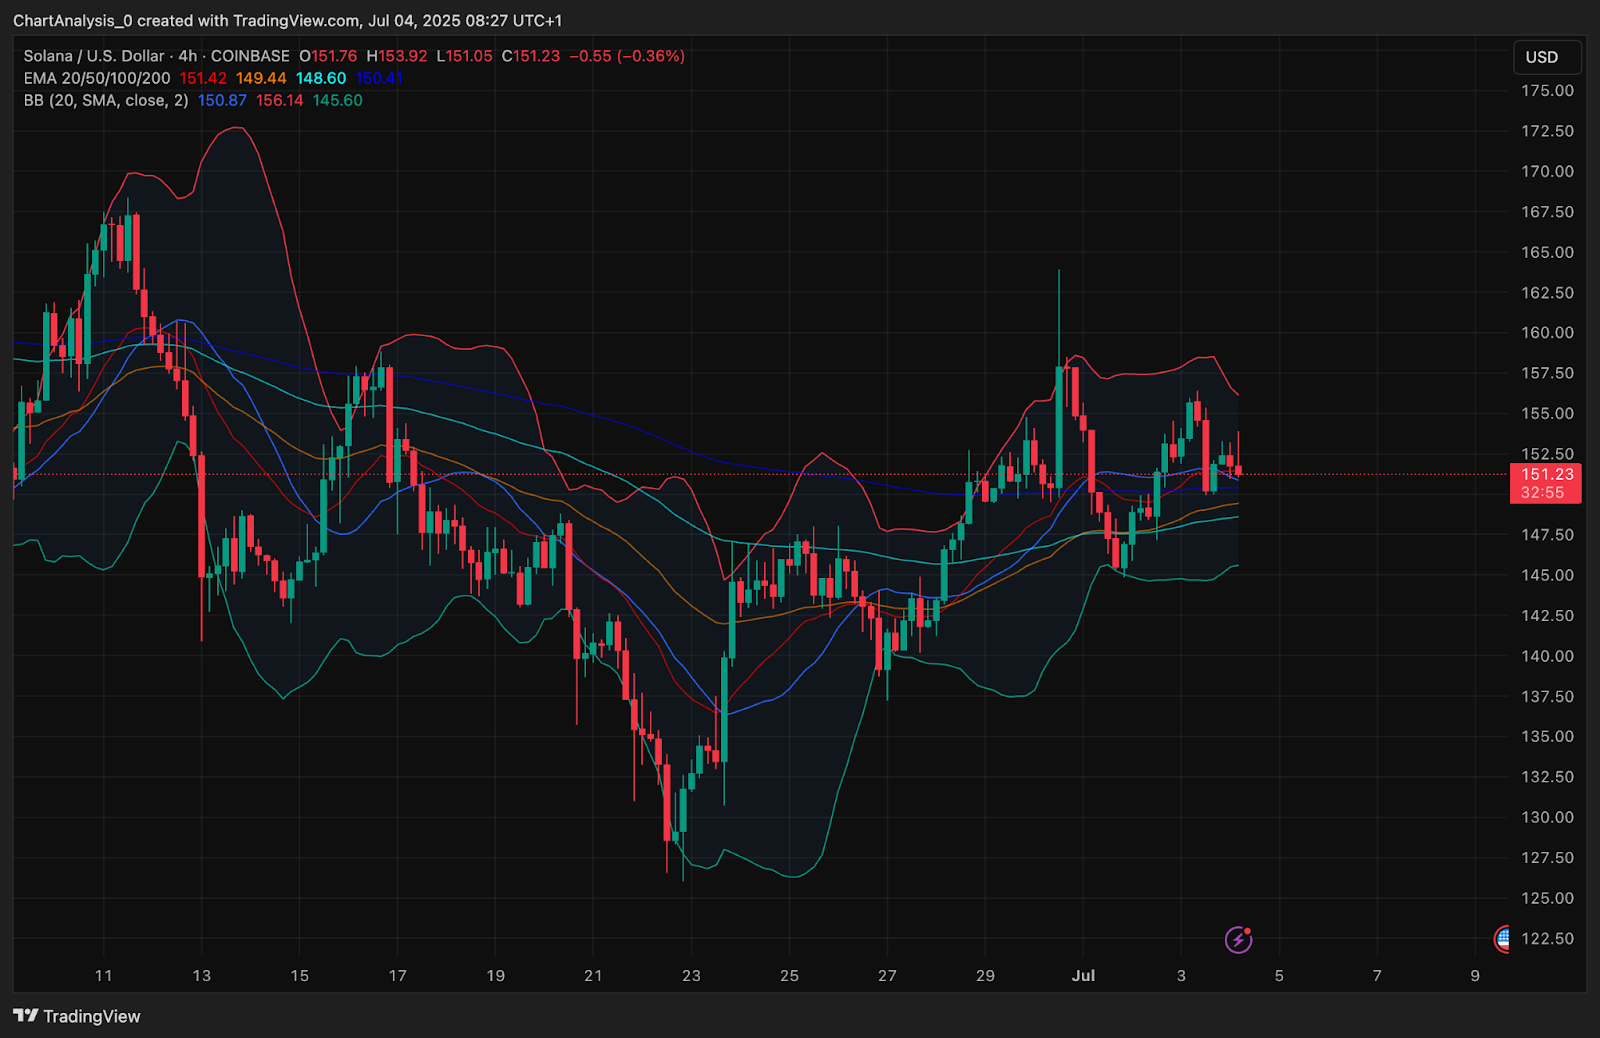
The answer to why Solana price going down today lies in weakening momentum and derivative market exhaustion. The 4-hour Bollinger Bands have started to narrow, while candles are beginning to pierce below the mid-band ($150.87), signaling bearish drift. At the same time, the EMA 20/50/100 cluster is coiling tightly between $149.44 and $151.42, indicating indecision and possible short-term volatility expansion.
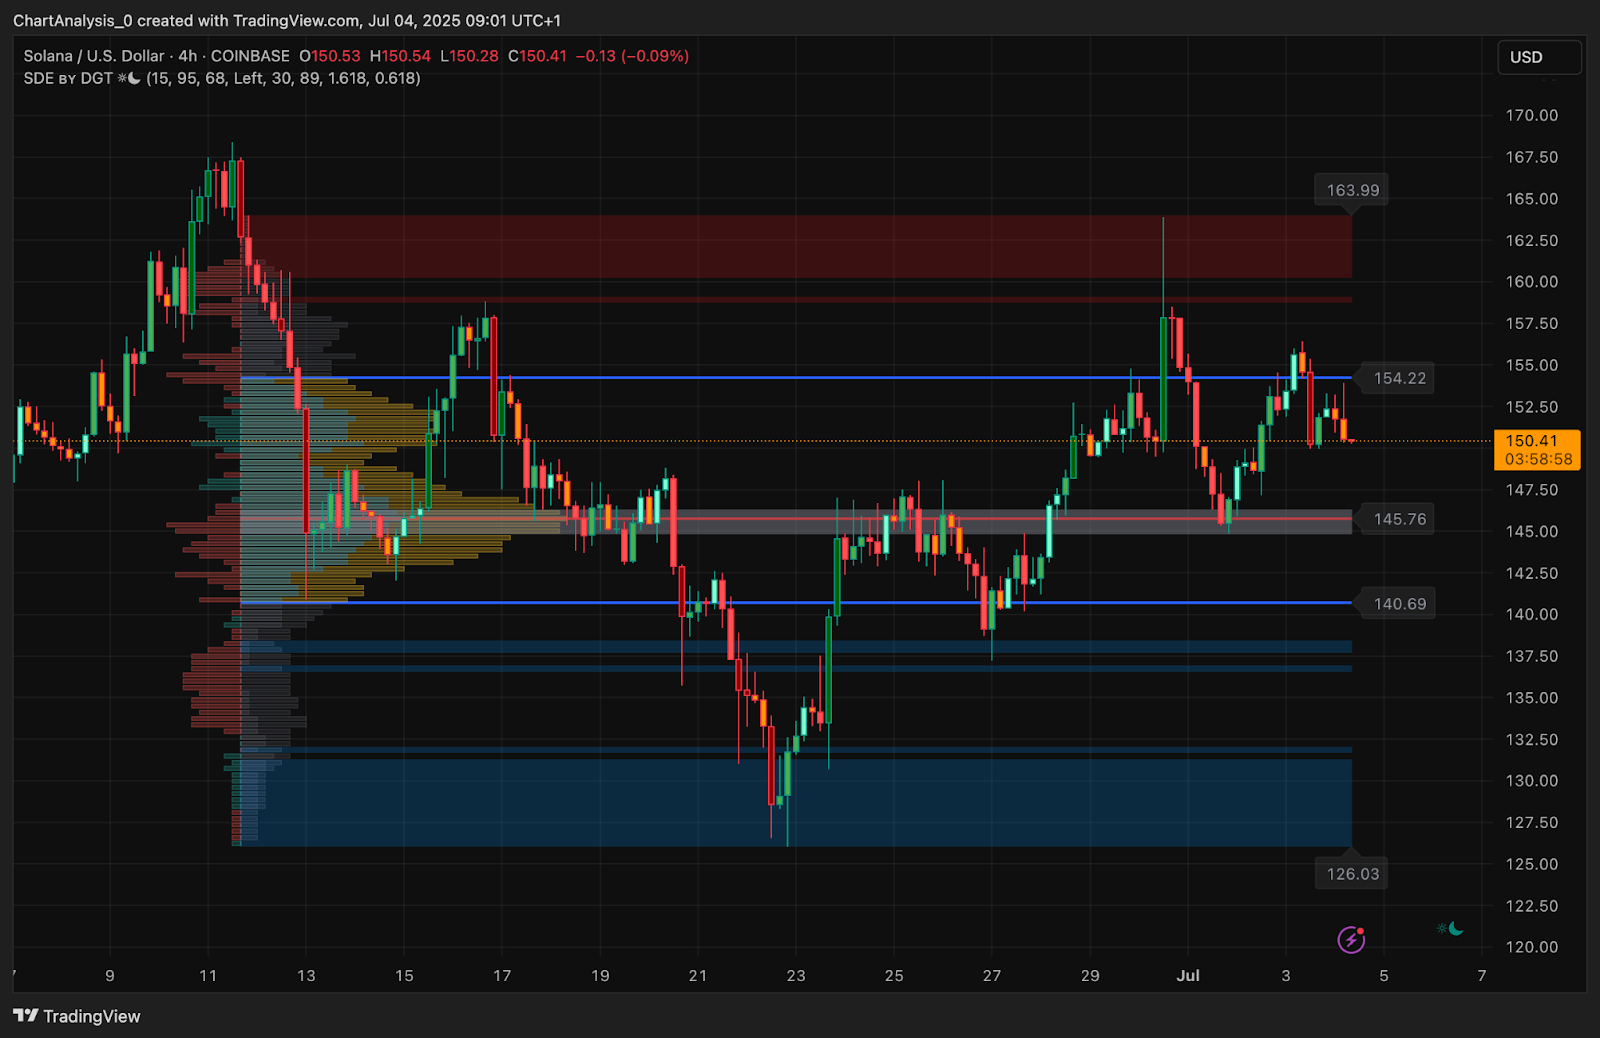
Volume profile data shows a high-volume node near $145.76, making it a likely demand zone on pullbacks. Meanwhile, SOL failed to flip the $154.22 level into support, which has since acted as a firm rejection zone. If SOL breaks below $148, this confluence will likely be tested quickly.
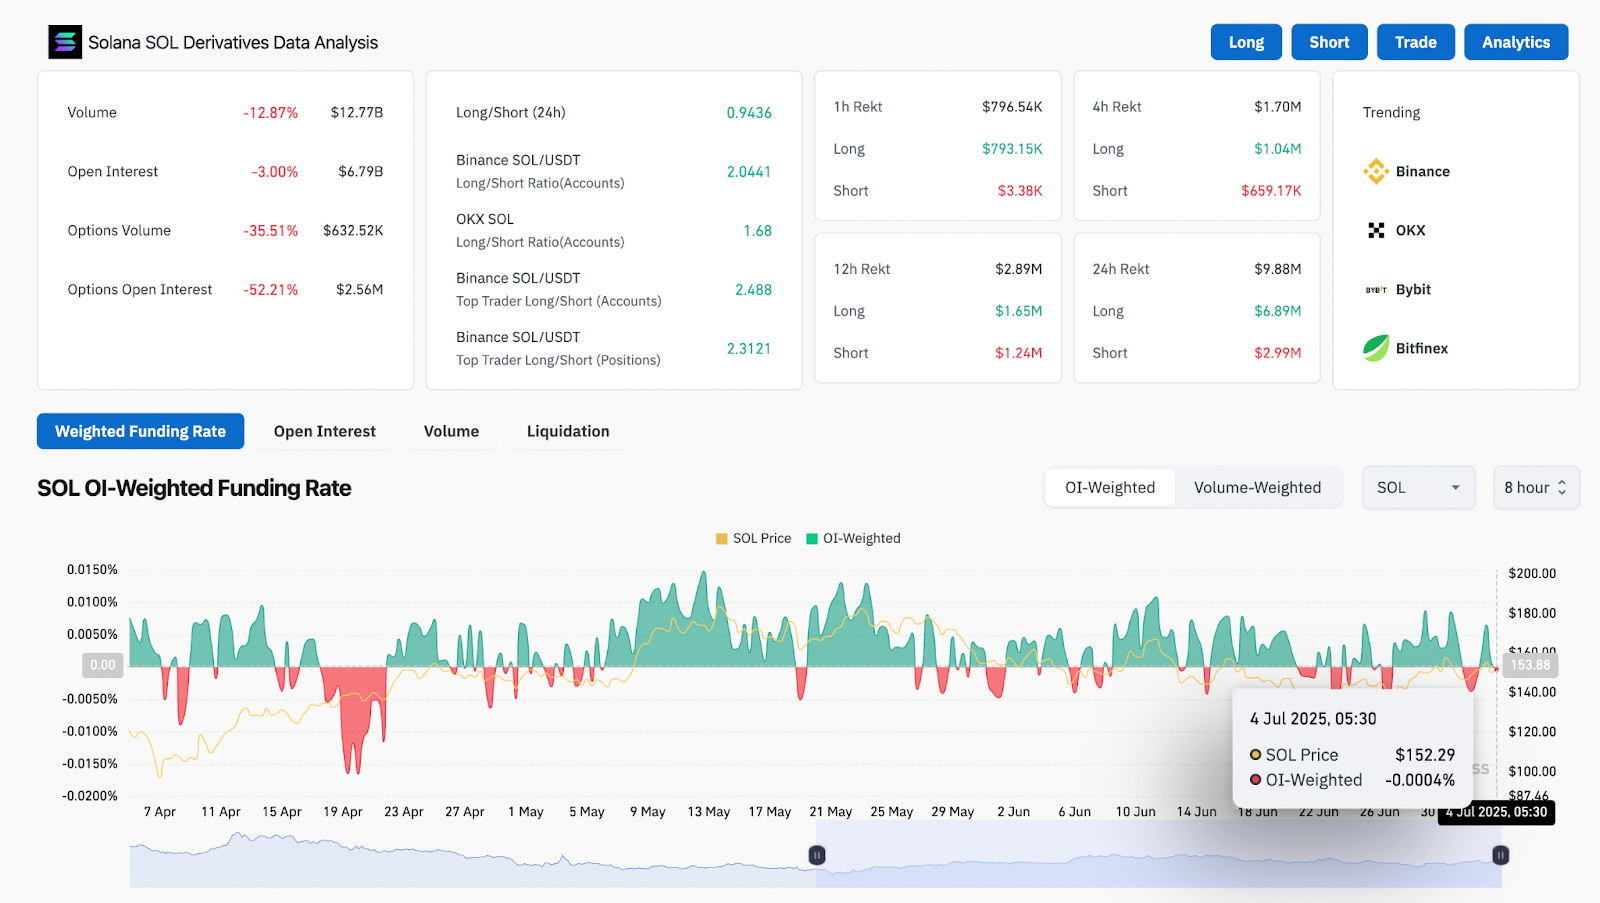
Derivatives data adds to bearish pressure: volume is down 12.87%, open interest has dropped 3%, and options volume has plunged 35.51%. Funding rates are now neutral to negative (-0.0004%) with long/short ratios above 2.0 on Binance, suggesting that overleveraged longs are vulnerable to liquidation in the current environment.
SOL Price Indicators, Signals, Graphs and Charts (24h)
The 4-hour Bollinger Bands show a tightening squeeze, and SOL has just closed a candle under the midline, indicating risk of downside expansion. The EMA alignment is beginning to tilt slightly bearish, with price now testing below the 100 EMA.
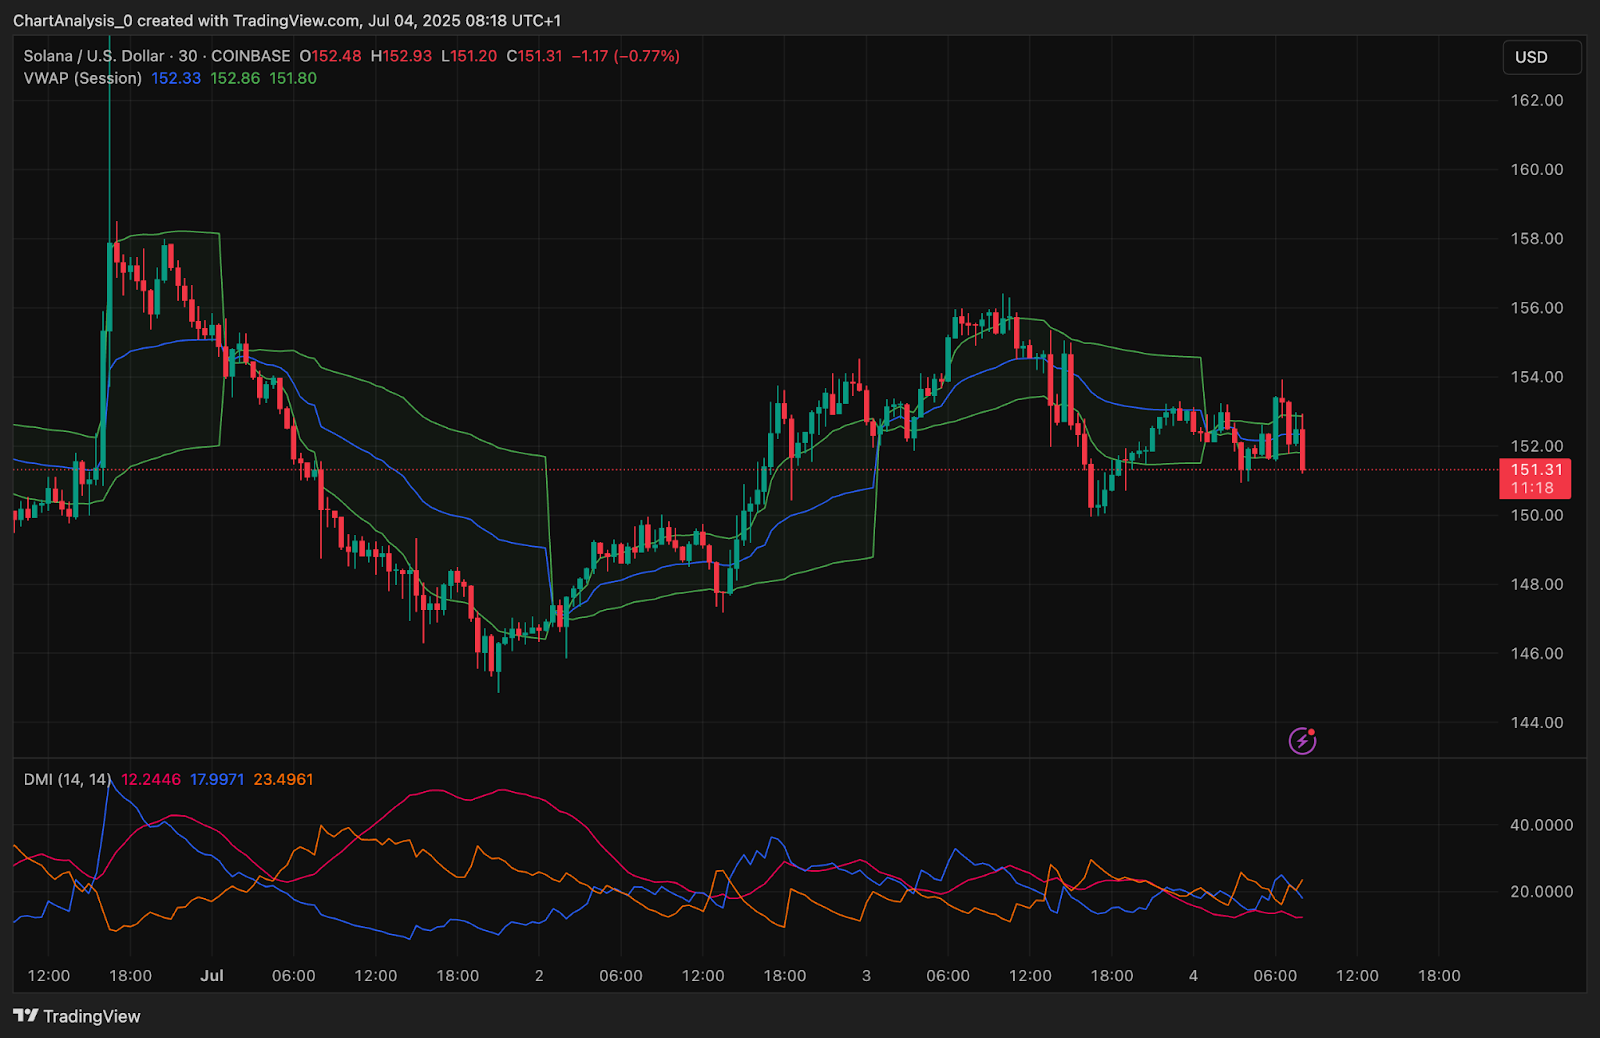
VWAP analysis shows that SOL is currently trading below its session average of $152.33, adding to the short-term bearish tilt.
The symmetrical triangle and Fib confluence around $150–$152 will likely define the next 24-hour breakout or breakdown move.
SOL Price Prediction: Short-Term Outlook (24h)
As long as SOL remains below $152.50, the near-term structure favors a retest of the $148–$145 support band. Below that, the next downside zone lies at $141.44, which is also the weekly 0.5 Fib level and the base of the larger triangle.
To shift momentum, bulls would need a clean breakout above $154.20, followed by a push toward $160. A reclaim of the 0.236 Fib at $165.88 would be needed to flip the macro structure bullish again.
Given current weakening indicators, traders should monitor for a liquidity sweep below $148 and possible bounce from the $145–$146 demand shelf.
Solana Price Forecast Table: July 5, 2025
| Indicator/Zone | Level (USD) | Signal/Comment |
| Resistance 1 | 154.22 | Rejection zone, prior support flipped |
| Resistance 2 | 165.88 | 0.236 Fib, macro breakout confirmation |
| Support 1 | 148.00 | Short-term trendline and Fib support |
| Support 2 | 145.75 | Volume POC and horizontal demand |
| RSI (4H) | Neutral | Drifting near midline |
| Bollinger Mid-Band (4H) | 150.87 | Price closing below mid-band |
| MACD (4H) | Neutral | Histogram flattening |
| VWAP (30-min) | 152.33 | Price below session average |
| Funding Rate | -0.0004% | Slight bearish skew |
| Long/Short Ratio (Binance) | 2.04 | Overcrowded longs, prone to squeeze |
Disclaimer: The information presented in this article is for informational and educational purposes only. The article does not constitute financial advice or advice of any kind. Coin Edition is not responsible for any losses incurred as a result of the utilization of content, products, or services mentioned. Readers are advised to exercise caution before taking any action related to the company.
 Price Prediction for July 5")
 Price Prediction for July 5")
 Price Prediction for July 5")
 Price Prediction for July 5")

