
 Price Prediction for July 10, 2025")

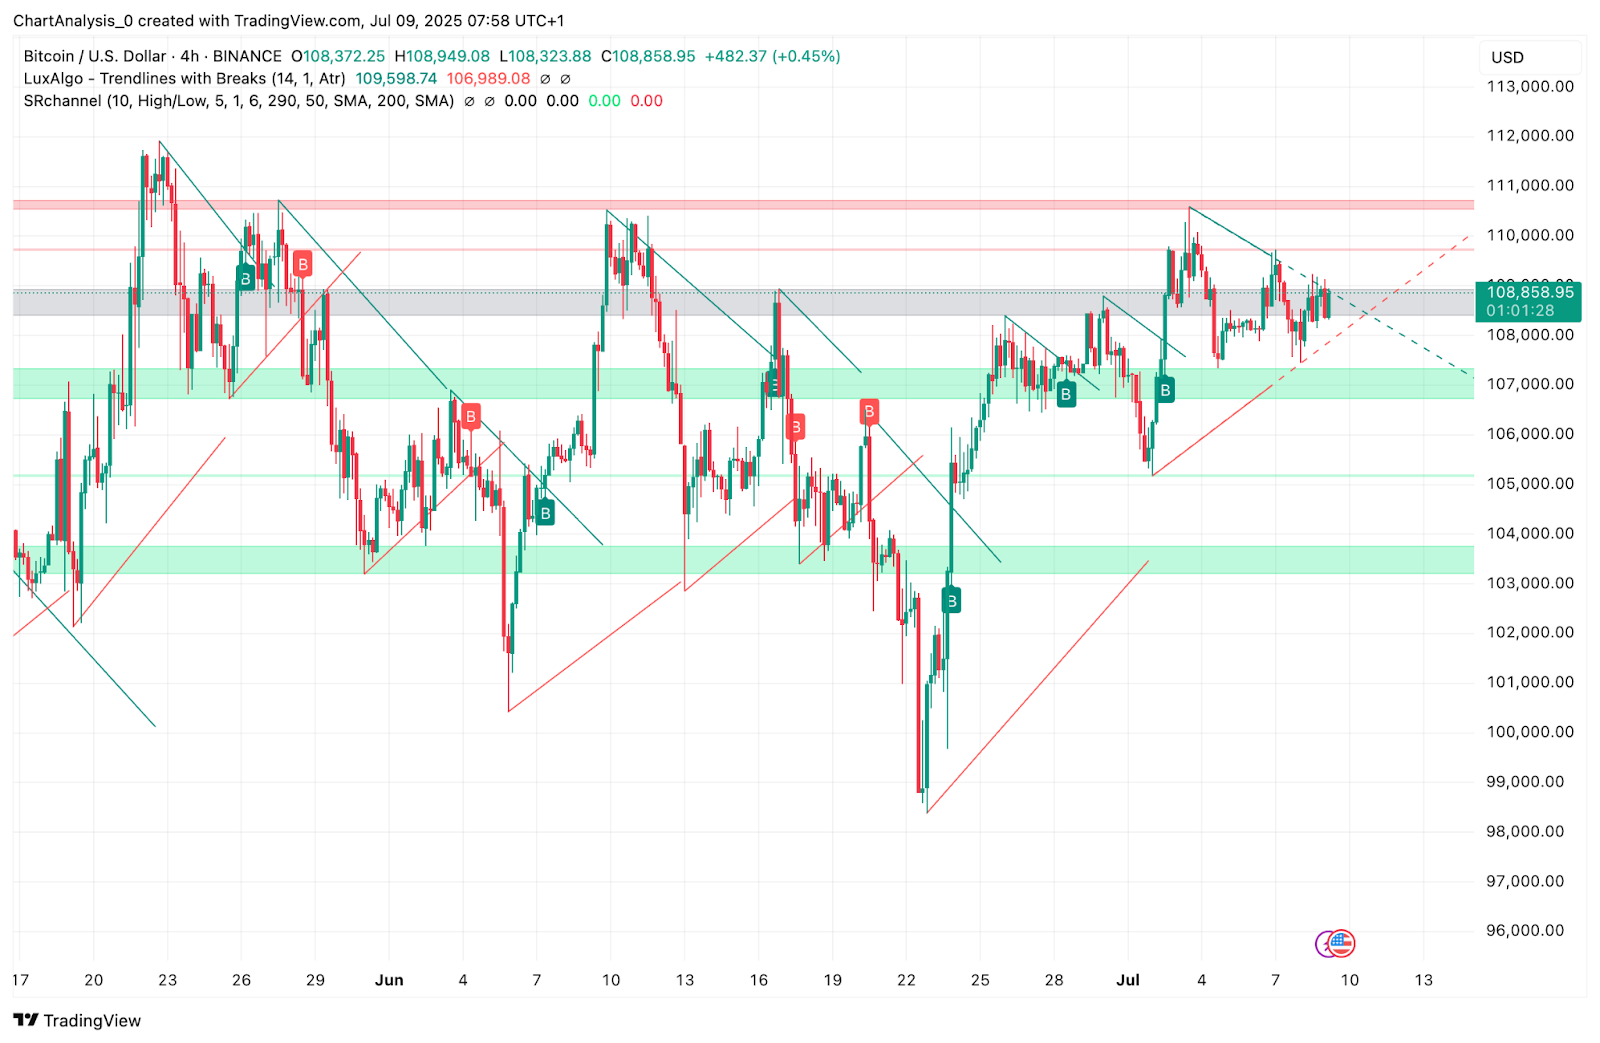
Bitcoin price today is trading near $108,865, maintaining a tight range between $108,200 and $109,200. The asset remains locked in a triangular structure as bulls attempt to hold above the short-term ascending trendline.
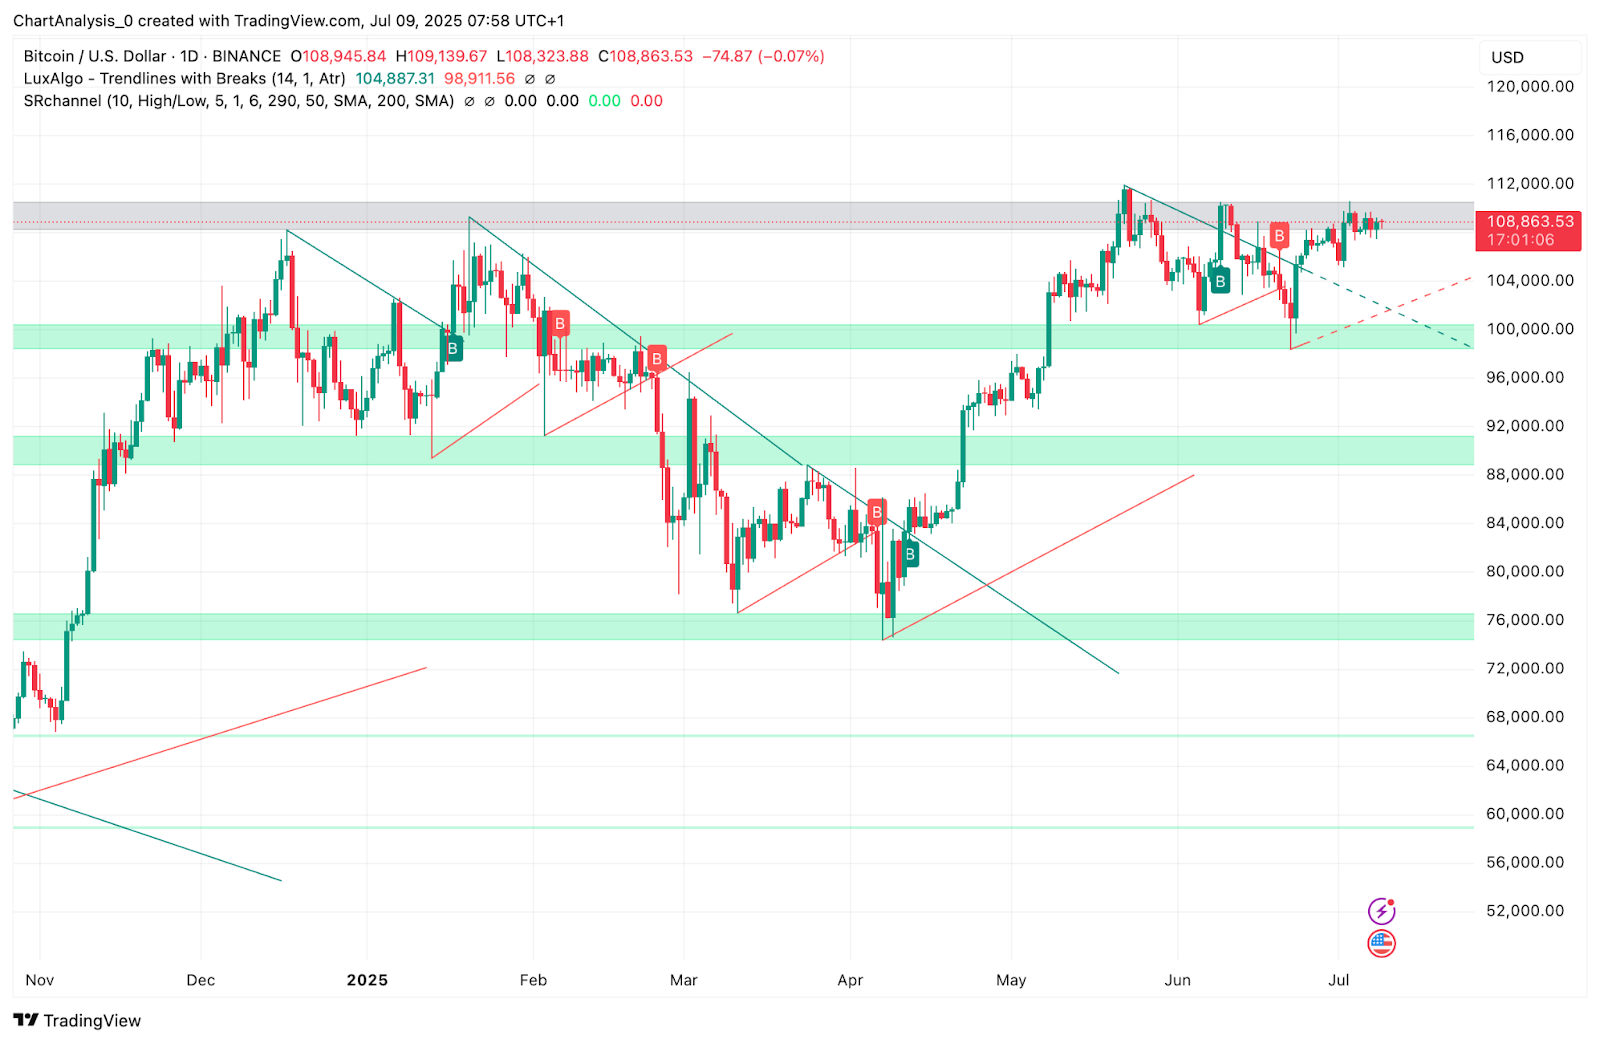
Despite several tests of the resistance zone just below $109,600, momentum has remained capped, as reflected by a cooling RSI and low directional movement. However, market structure across daily and 4-hour charts remains bullish unless $107,200 breaks decisively.
Bearish RSI Divergence Signals Exhaustion
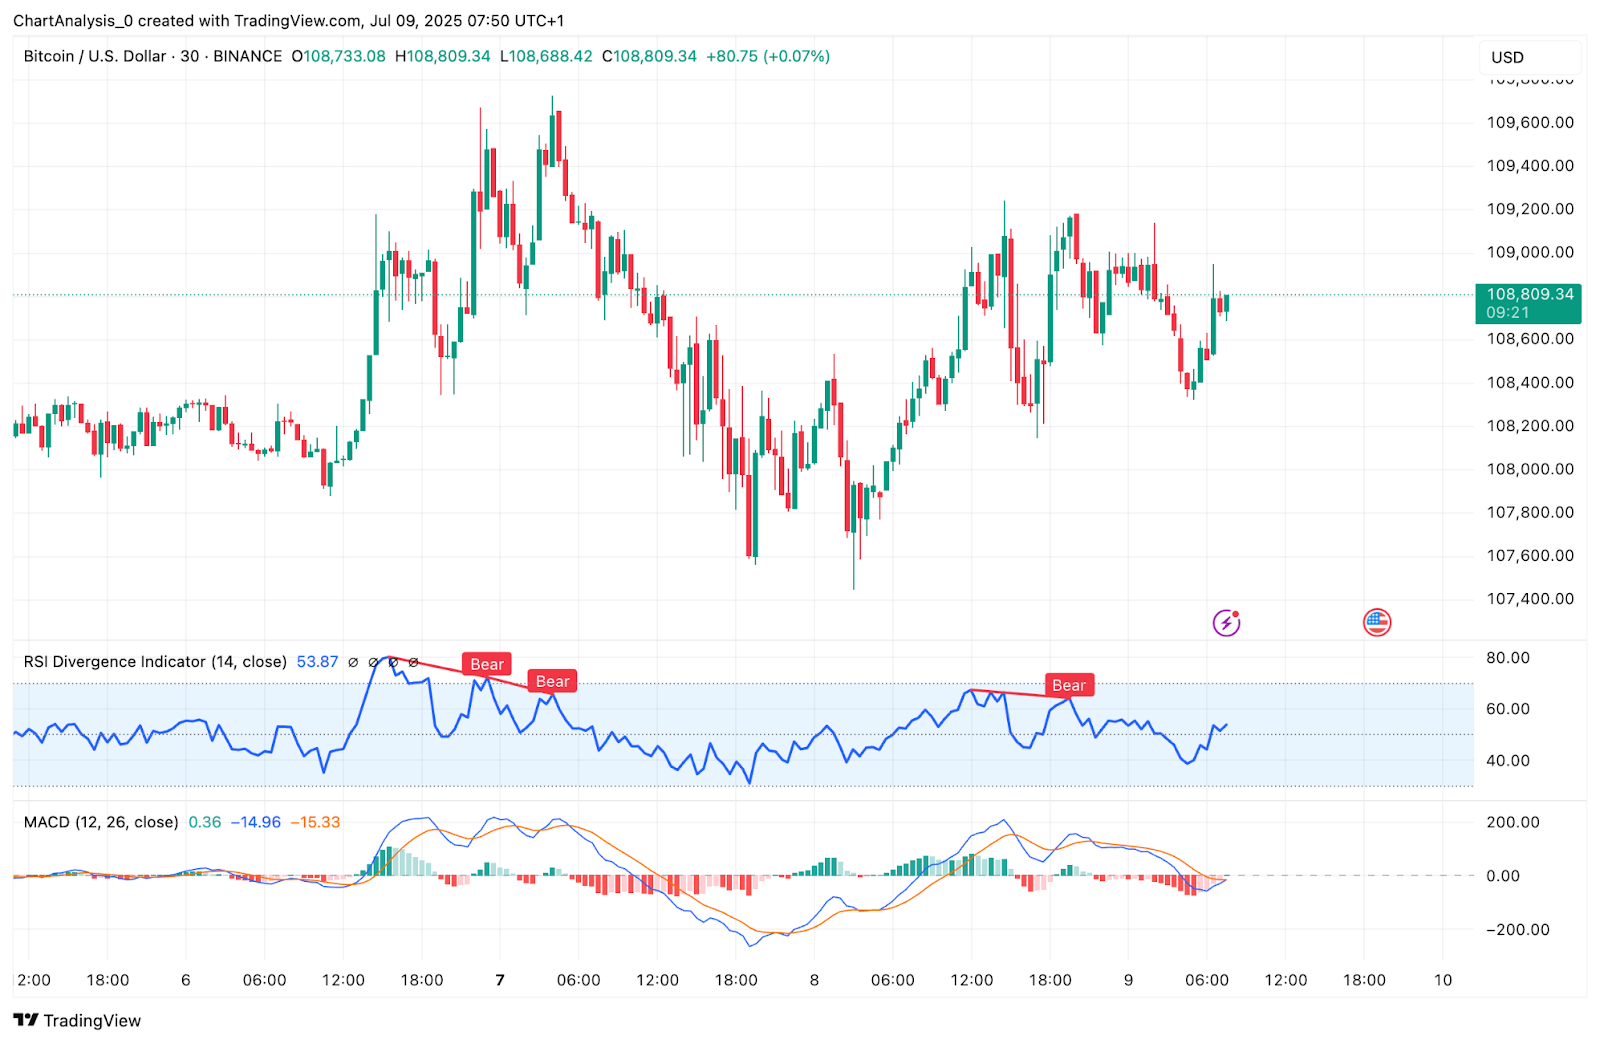
The 30-minute chart reveals a sequence of bearish RSI divergences, with price forming higher highs while the RSI steadily declines. This signals weakening upside momentum despite price pushes. The RSI has rebounded modestly to 53.8, but remains below bullish extremes.
Meanwhile, MACD lines have crossed slightly negative, with histogram bars reflecting muted bearish momentum. This lack of follow-through indicates a potential equilibrium phase rather than an impulsive drop.
Bitcoin Price: Bollinger Band Squeeze and EMA Support Hold
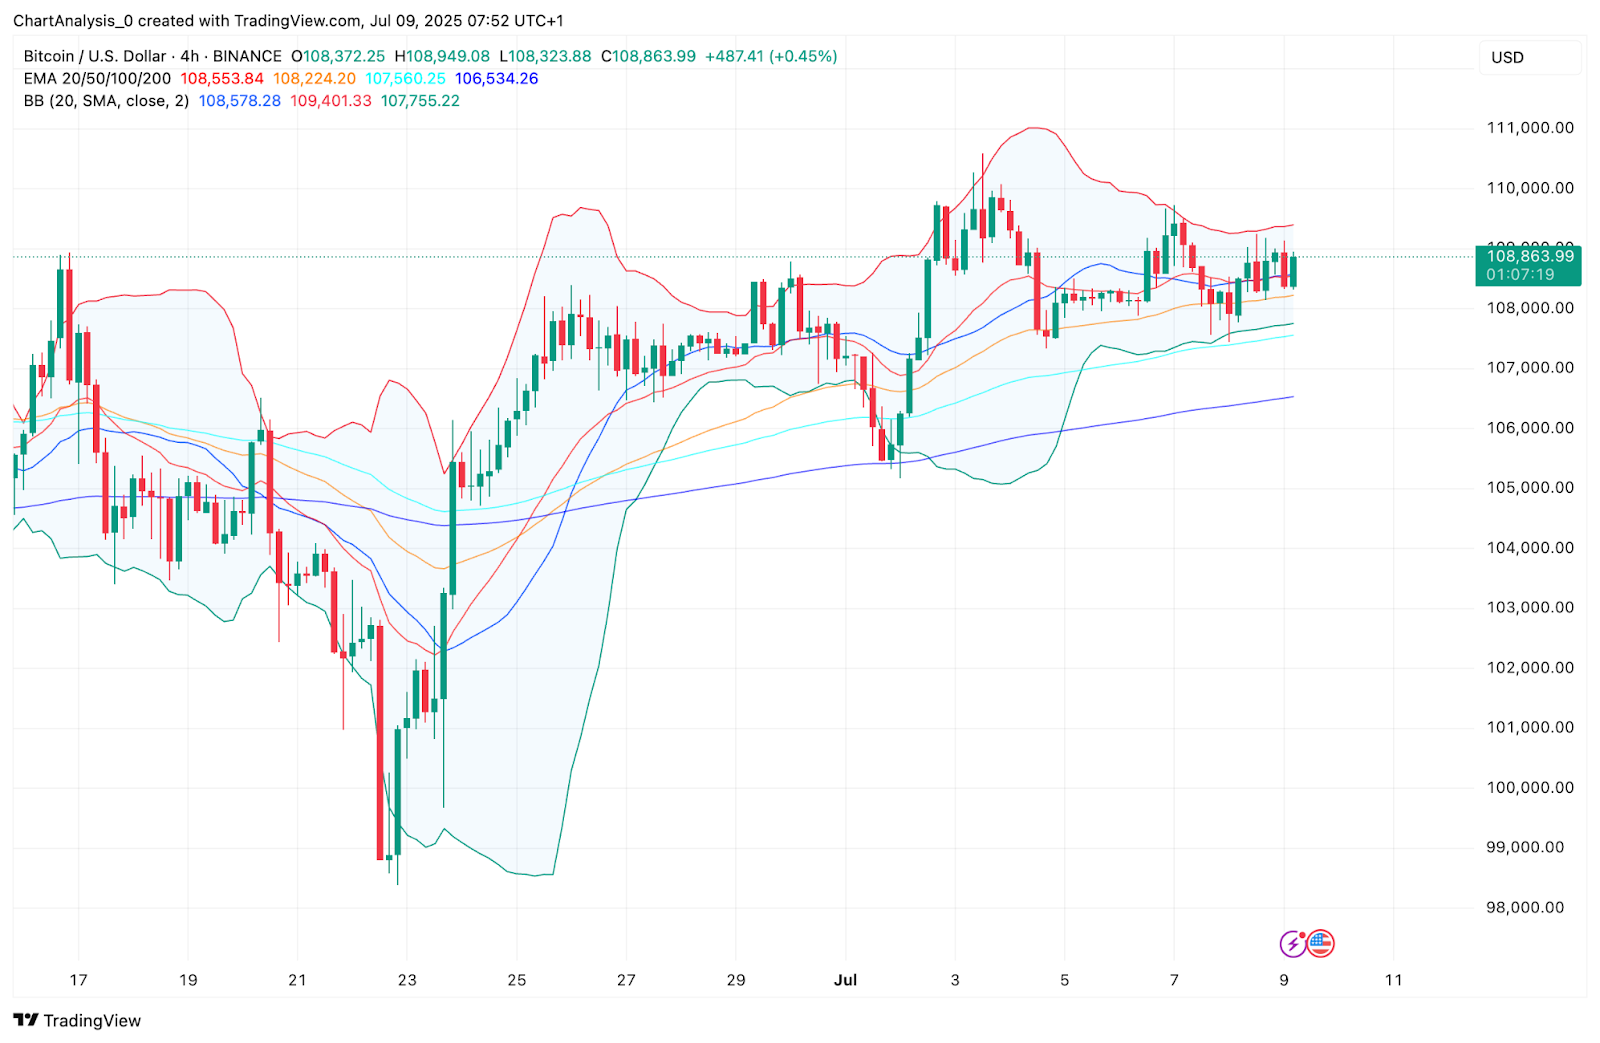
On the 4-hour chart, Bollinger Bands are beginning to contract again, with the price compressing between $108,200 and $109,000. The 20 and 50 EMA cluster around $108,200–108,550 is acting as dynamic support, while the upper band at $109,400 remains a ceiling for short-term upside.
Daily structure continues to respect the uptrend, with BTC trading above the 100 and 200 EMAs, and no signs of breakdown from major trendlines yet. This suggests buyers remain in control unless the price closes below $107,000 on high volume.
BTC Derivatives Data: Sentiment Neutral to Slightly Bullish
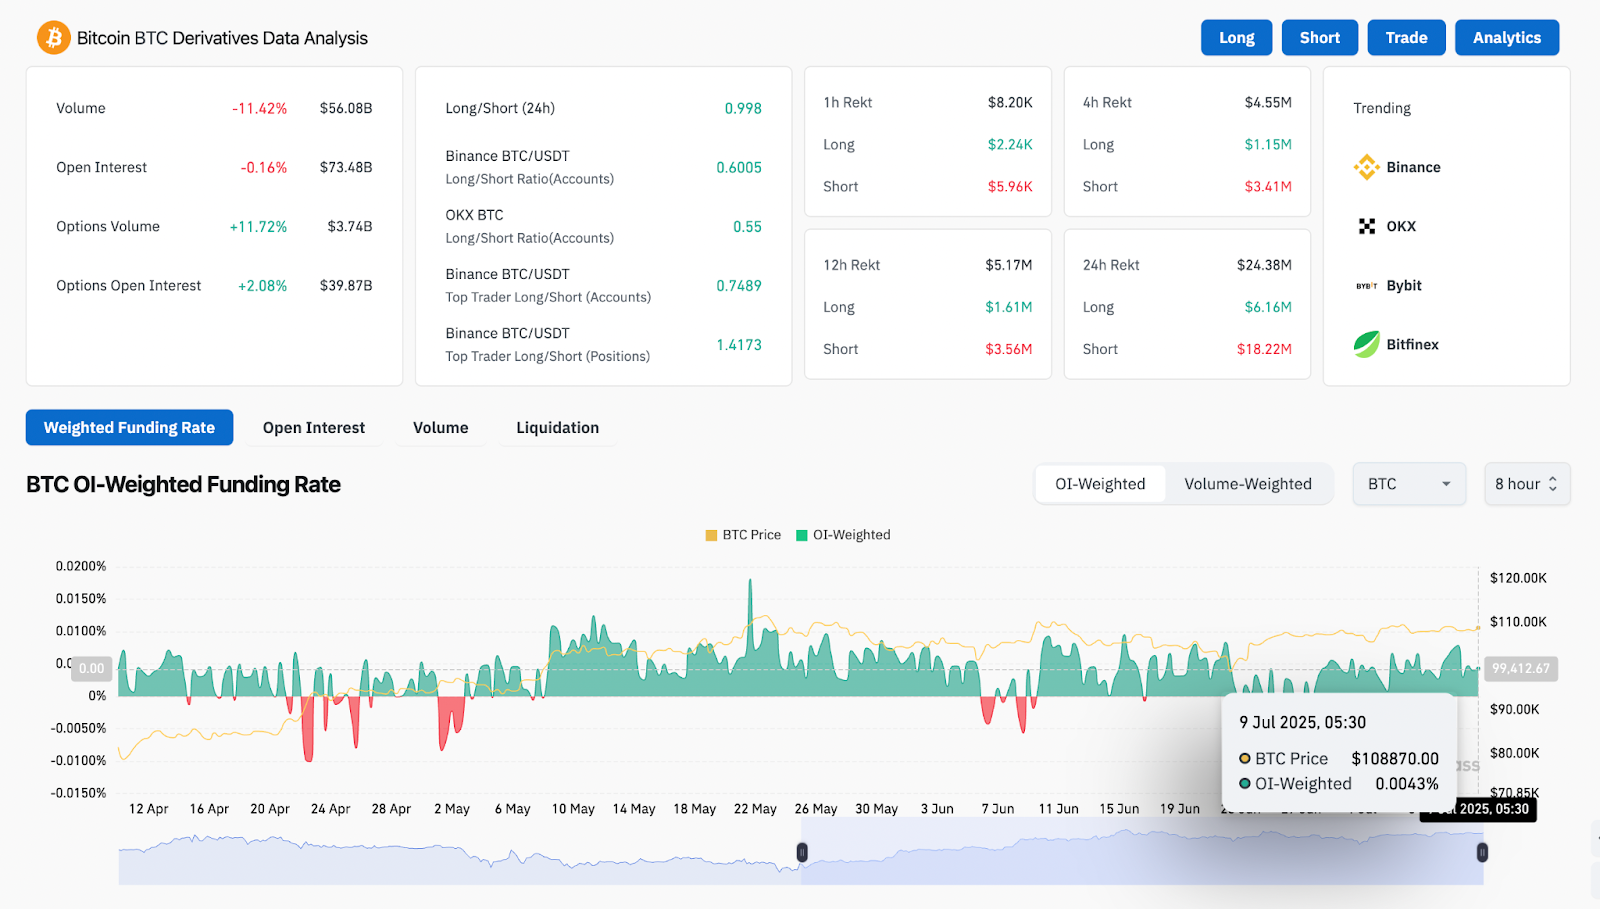
According to the latest BTC derivatives dashboard:
- Open Interest is slightly down by -0.16%, but Options Volume is up +11.72%.
- Funding rates are slightly positive at +0.0043%, indicating mild long bias without crowding.
- The 24-hour liquidation data shows $18.22M in short positions liquidated, compared to only $6.16M long, suggesting sellers are being squeezed out at current levels.
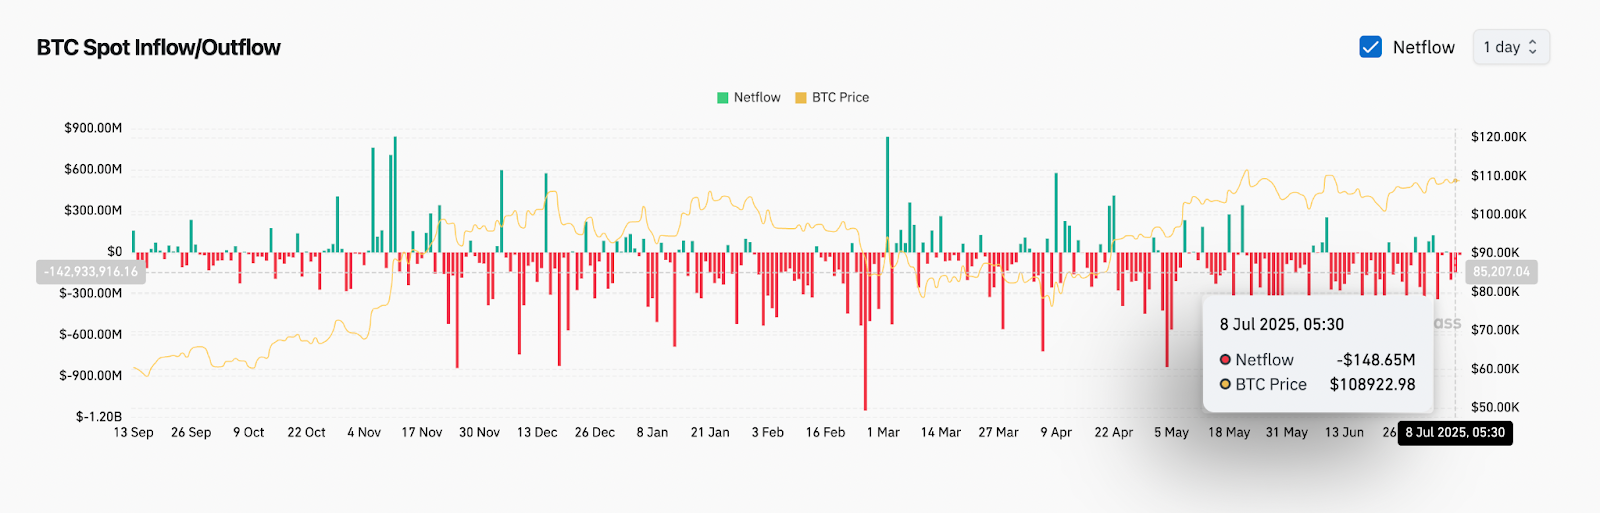
However, spot netflow remains negative, with $148.65M in outflows as of July 8, indicating profit-taking or rotation away from exchanges despite price support.
Bitcoin Price Outlook and Key Levels to Watch
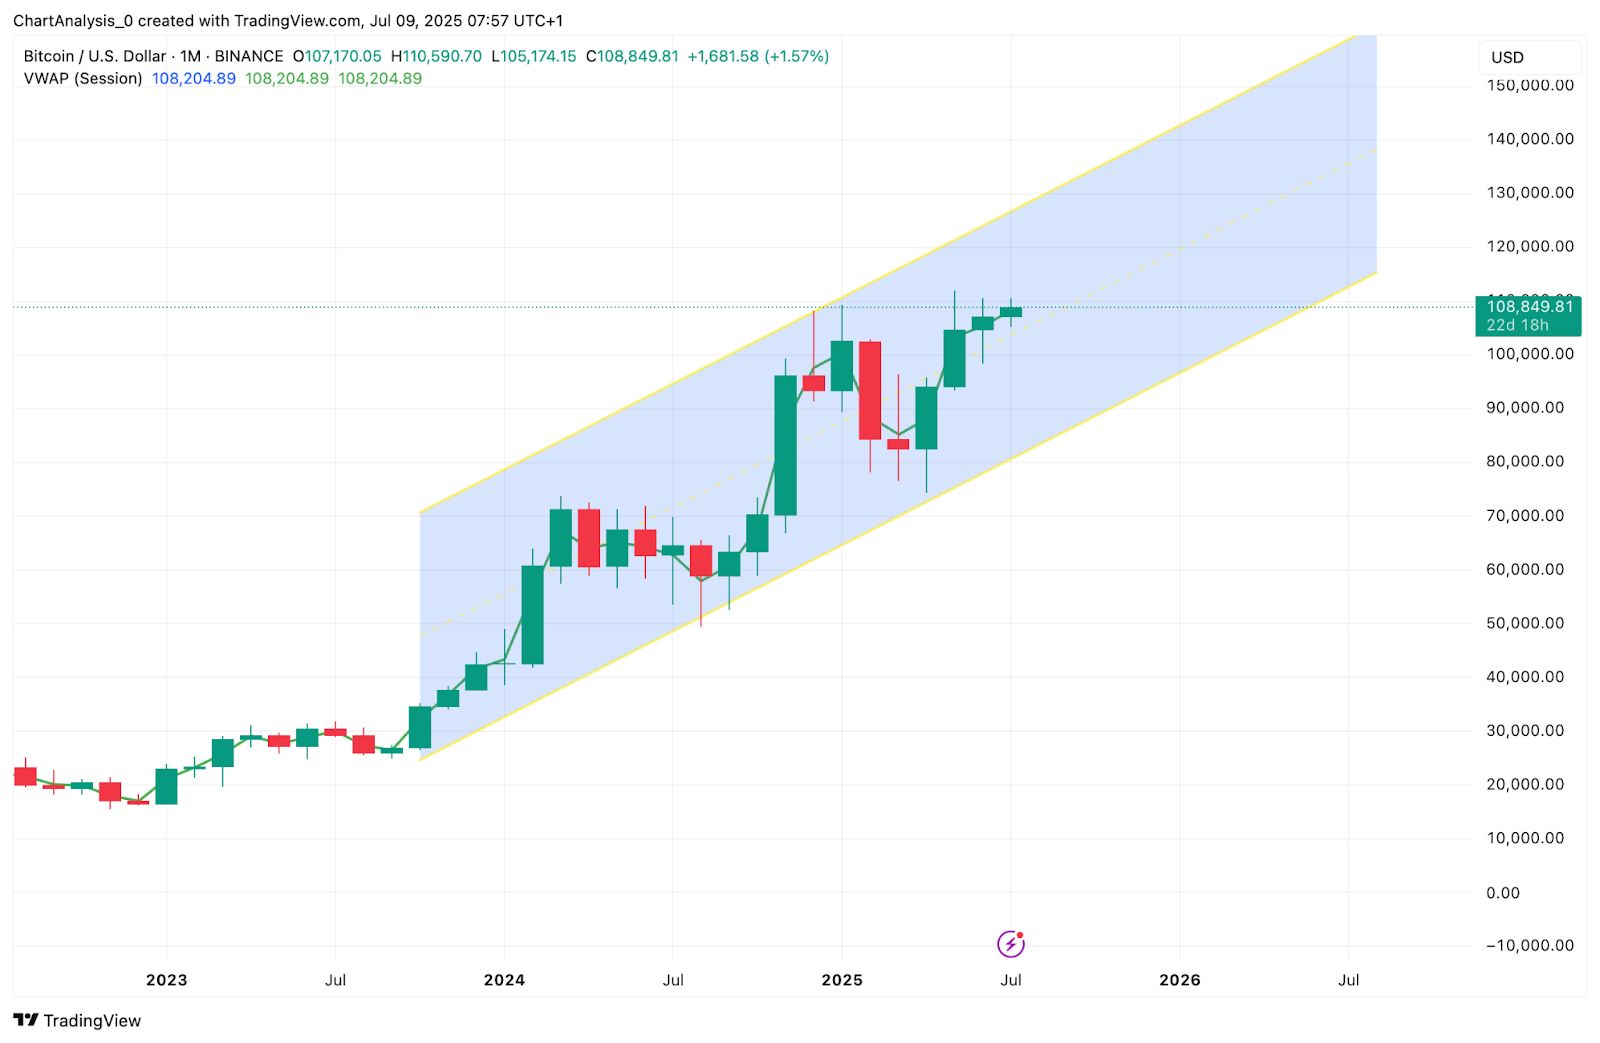
BTC continues to respect the ascending channel on the monthly chart, grinding near the median line around $108,800–$109,000. While upside momentum is capped for now, the broader structure favors continuation unless a breakdown occurs below $106,800.
A breakout above $109,600 could trigger a short squeeze toward $110,800–111,500, while failure to hold $107,200 opens downside risk to $105,700 and $104,200.
BTC Forecast Table
| Timeframe | Support Levels | Resistance Levels | Bias |
| 30-min | $108,200 / $107,500 | $109,100 / $109,600 | Neutral |
| 4-hour | $107,200 / $106,800 | $109,600 / $110,800 | Bullish |
| Daily | $106,800 / $104,200 | $111,500 / $113,000 | Bullish |
Disclaimer: The information presented in this article is for informational and educational purposes only. The article does not constitute financial advice or advice of any kind. Coin Edition is not responsible for any losses incurred as a result of the utilization of content, products, or services mentioned. Readers are advised to exercise caution before taking any action related to the company.
 Price Prediction 2025, 2026, 2027-2030")
 Price Prediction 2025, 2026, 2027–2030")
 Price Prediction 2025, 2026, 2027, 2028-2030")
? Everything You Need To Know")
 Price Prediction for July 10")
