


- A rare candle pattern has appeared on XRP’s chart that has twice led to massive rallies of 1,500% or more
- This comes as XRP’s Bollinger Bands are at their tightest since Nov. 2024, signaling imminent volatility
- The technical setup is supported by falling Bitcoin dominance, giving XRP more room to outperform
A rare technical pattern that has only appeared twice in XRP’s history and was followed by explosive rallies of 1,500% and 8,000% has just flashed again on the charts, according to a new analysis.
This development has put XRP back at the center of investor attention. The digital asset is already showing strong bullish momentum to this effect, currently trading around $2.40 with a 7-day rise of over 8%.
The 1,500% Historical Pattern Reappears
A well-followed market analyst, EGRAG CRYPTO, is highlighting a repeating three-month green candle pattern as a key bullish signal. According to his analysis, this pattern has only appeared twice before in XRP’s history. In both cases, a major rally followed.
In one instance, XRP consolidated for five months and then skyrocketed by 1500%. A similar setup today could drive prices toward the $10 mark by August 2024. In another historical event, a 12-month consolidation phase led to an explosive 8000% increase.
If history repeats itself, XRP could reach $50 by late 2025. EGRAG suggests that the average of these two targets lands at $30, while hinting at a personal target of $27.
Broader Market Turns in XRP’s Favor
Tony Edward of the “Thinking Crypto Podcast” adds to this view from a broader market perspective. He notes that Bitcoin’s dominance is starting to decline, which gives established altcoins like XRP more room to outperform.
Related: XRP Price Breaks Out Ahead of Ripple CEO’s Senate Testimony
XRP’s climb above the 200-week moving average is a crucial technical indicator, signaling a return to long-term bullish strength. Moreover, its daily RSI suggests that there’s still room for growth before hitting overbought conditions. This combination supports the thesis that XRP could see additional gains in the short to medium term.
Volatility Squeeze Points to a Big XRP Price Move
Adding to the bullish outlook, analyst STEPH IS CRYPTO points out a significant technical formation. XRP’s Bollinger Bands are now the tightest they’ve been since November 2024.
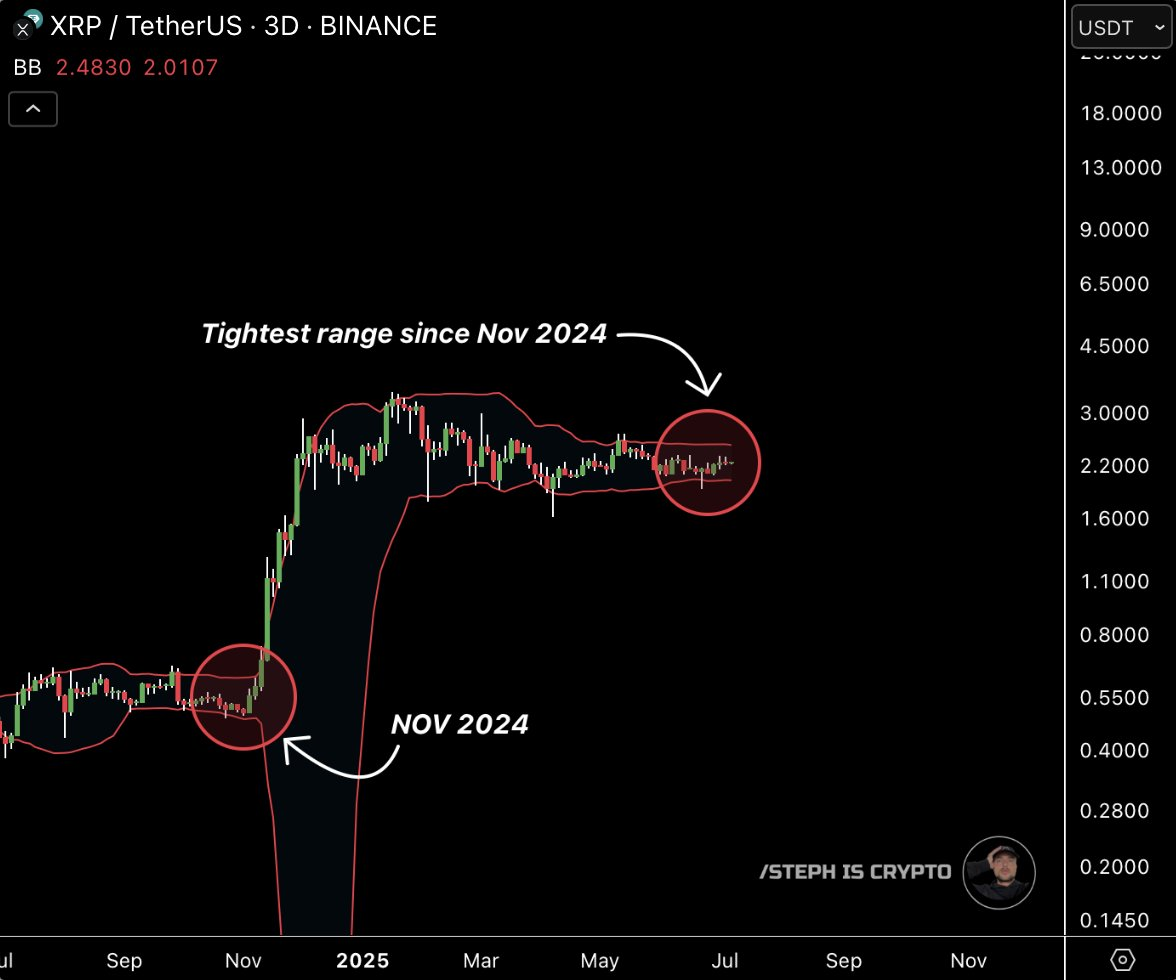
At that time, a similar squeeze led to a dramatic breakout. With XRP trading in a tight range between $2.01 and $2.48, a break above $2.50 could trigger a move to $3.00 and beyond.
Related: XRP Breaks Resistance as Upbit Hits $1.94B Volume; Smart Contracts Surge
Conversely, dropping below $2.00 might bring short-term pressure, but volume confirmation will be key.
Disclaimer: The information presented in this article is for informational and educational purposes only. The article does not constitute financial advice or advice of any kind. Coin Edition is not responsible for any losses incurred as a result of the utilization of content, products, or services mentioned. Readers are advised to exercise caution before taking any action related to the company.
 Price Prediction for July 11")
 Price Prediction 2025, 2026, 2027, 2028-2030")
 Price Prediction for July 11")
 Price Prediction for July 11")

