
 Price Prediction for July 14, 2025: HBAR Blasts Through Resistance as Buyers Target $0.24")

After a prolonged accumulation period, HBAR price has surged past the $0.22 barrier, recording a sharp 14% gain in the last 24 hours and a 42% weekly surge. With this breakout, HBAR price today is trading near a key technical inflection zone, supported by strong volume, elevated Money Flow Index readings, and momentum alignment across multiple timeframes.
What’s Happening With HBAR’s Price?
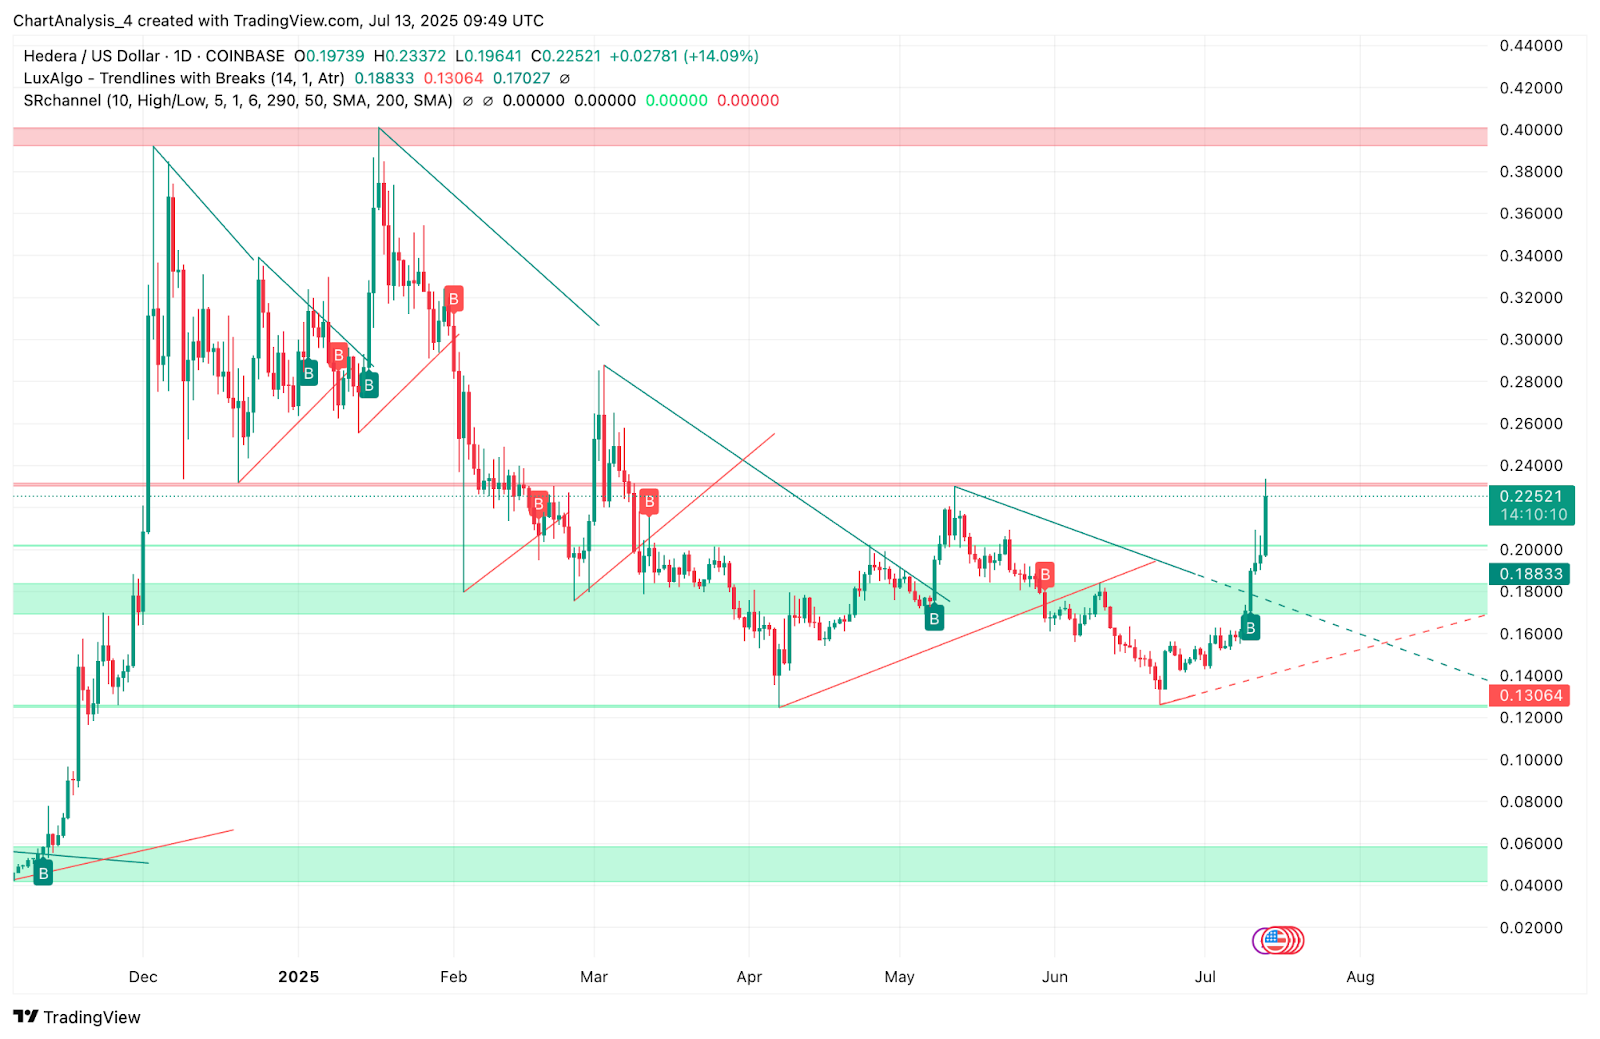
HBAR has decisively broken through the $0.188–$0.22 resistance zone, which had capped upside for nearly five months. On the daily chart, price now trades at $0.226 after reaching an intraday high of $0.233. This move confirms a bullish breakout from a multi-month descending wedge and validates the prior base-building structure between $0.14 and $0.18.
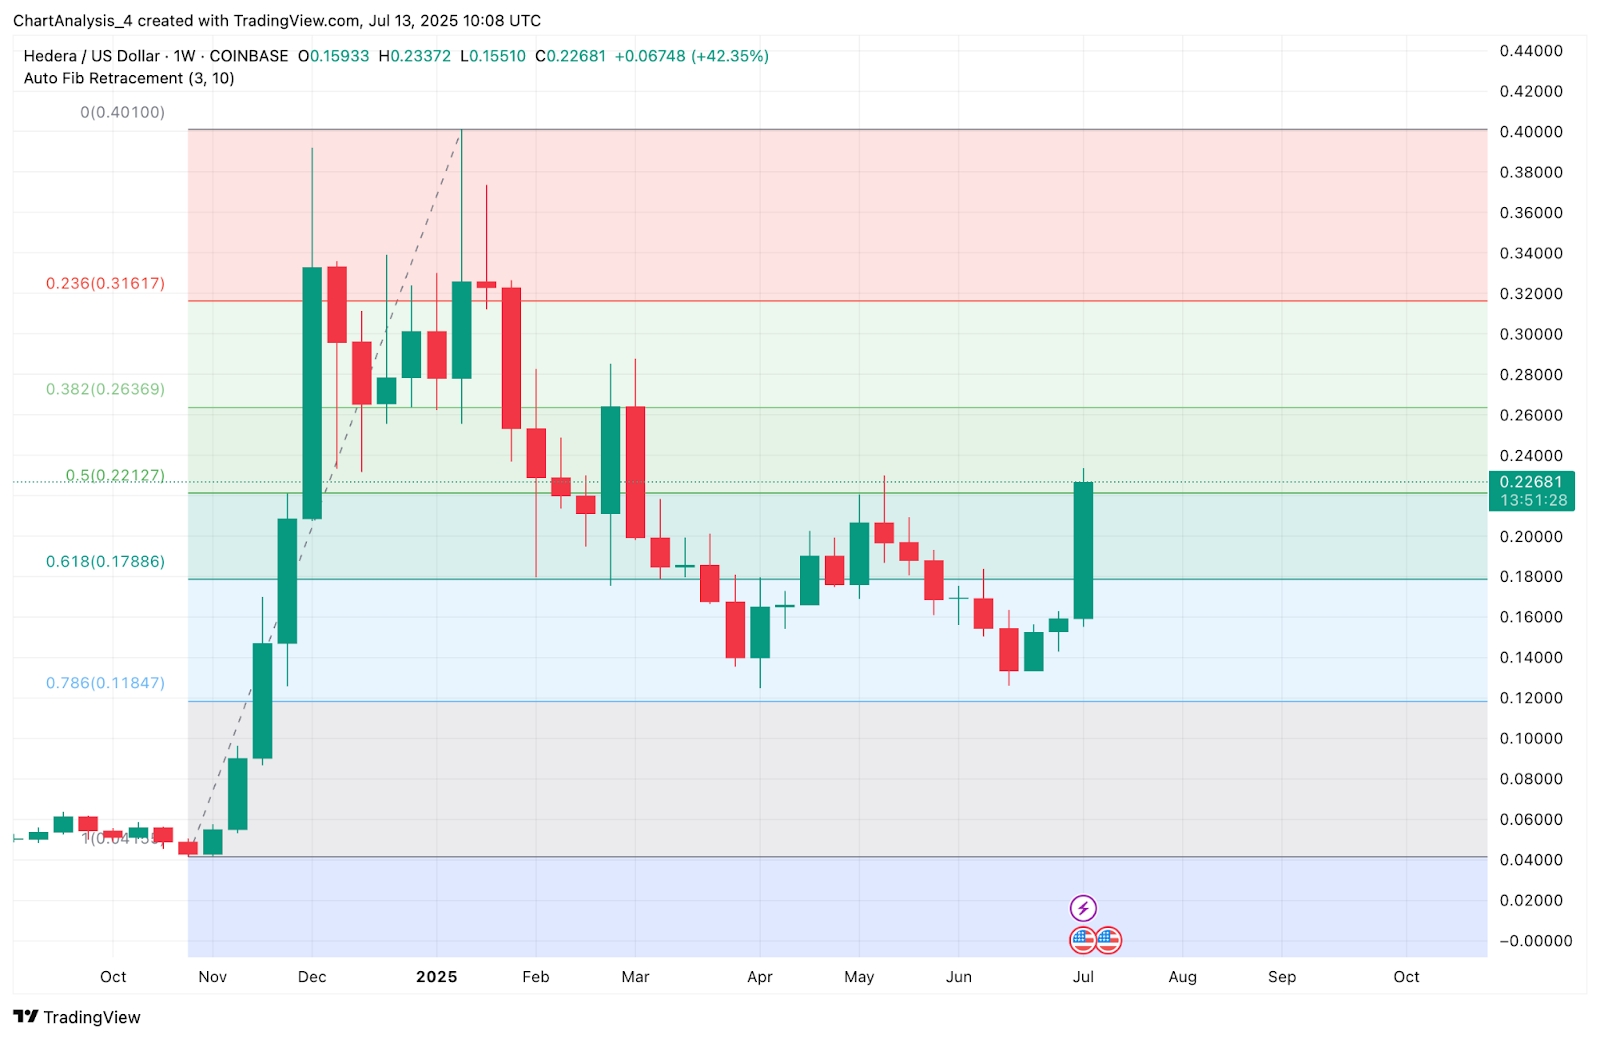
Price has also reclaimed the 0.5 Fibonacci retracement level at $0.221 from the November 2024–February 2025 decline. The next major Fibonacci level lies at $0.263 (0.382), and this will likely act as the next bullish target if upward momentum persists.
Why Is The HBAR Price Going Up Today?
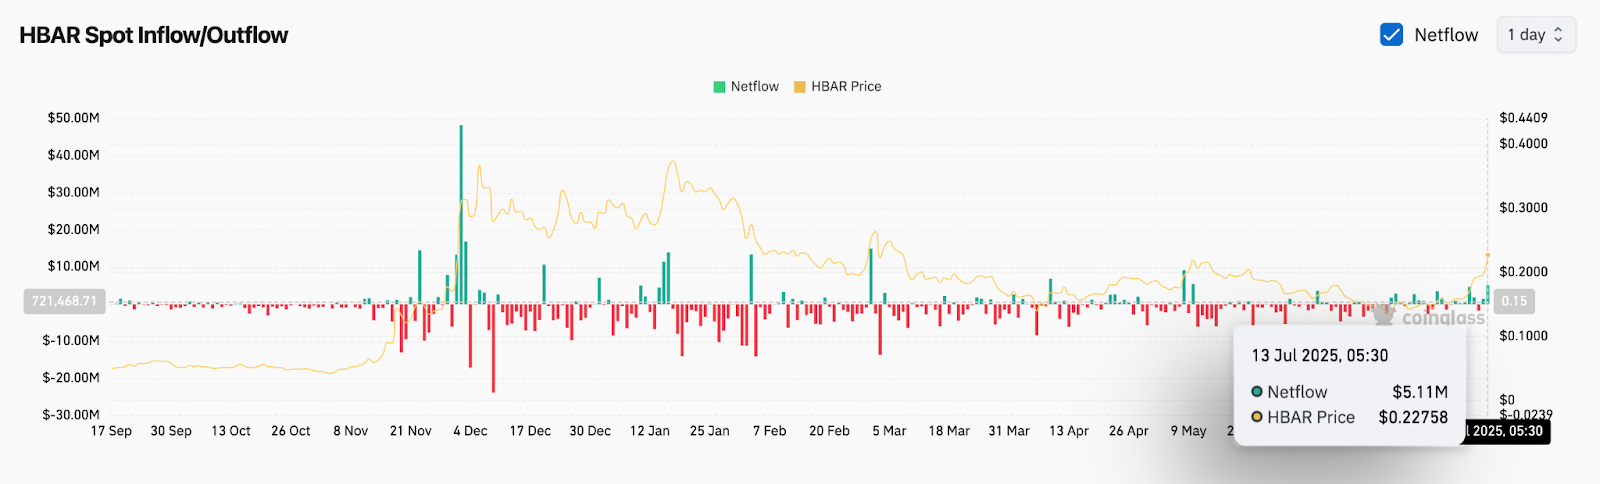
The primary reason why HBAR price going up today is a strong inflow of capital and bullish confirmation on key indicators. CoinGlass data reveals that net exchange inflows have flipped to a +$5.11M position as of July 13, marking one of the largest daily net positives for HBAR in over six months. This suggests strong accumulation and bullish sentiment from larger holders.
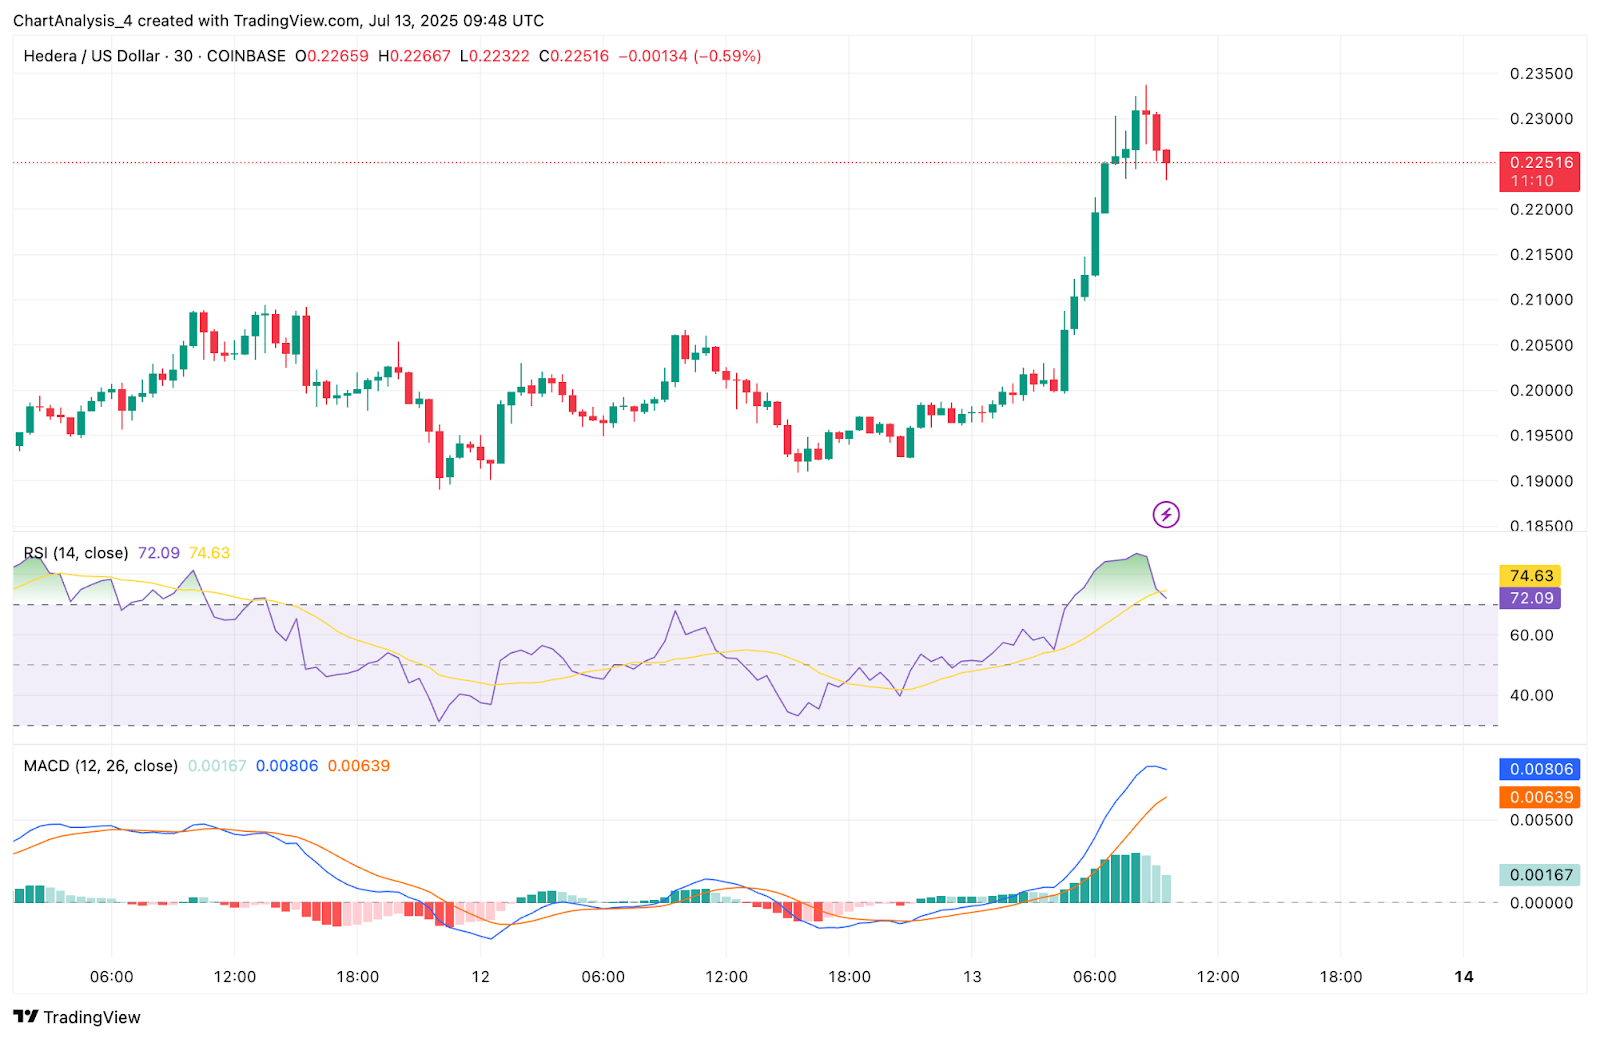
On the 30-minute chart, the RSI is in overbought territory at 72.09, while MACD remains strongly bullish with widening histogram bars.
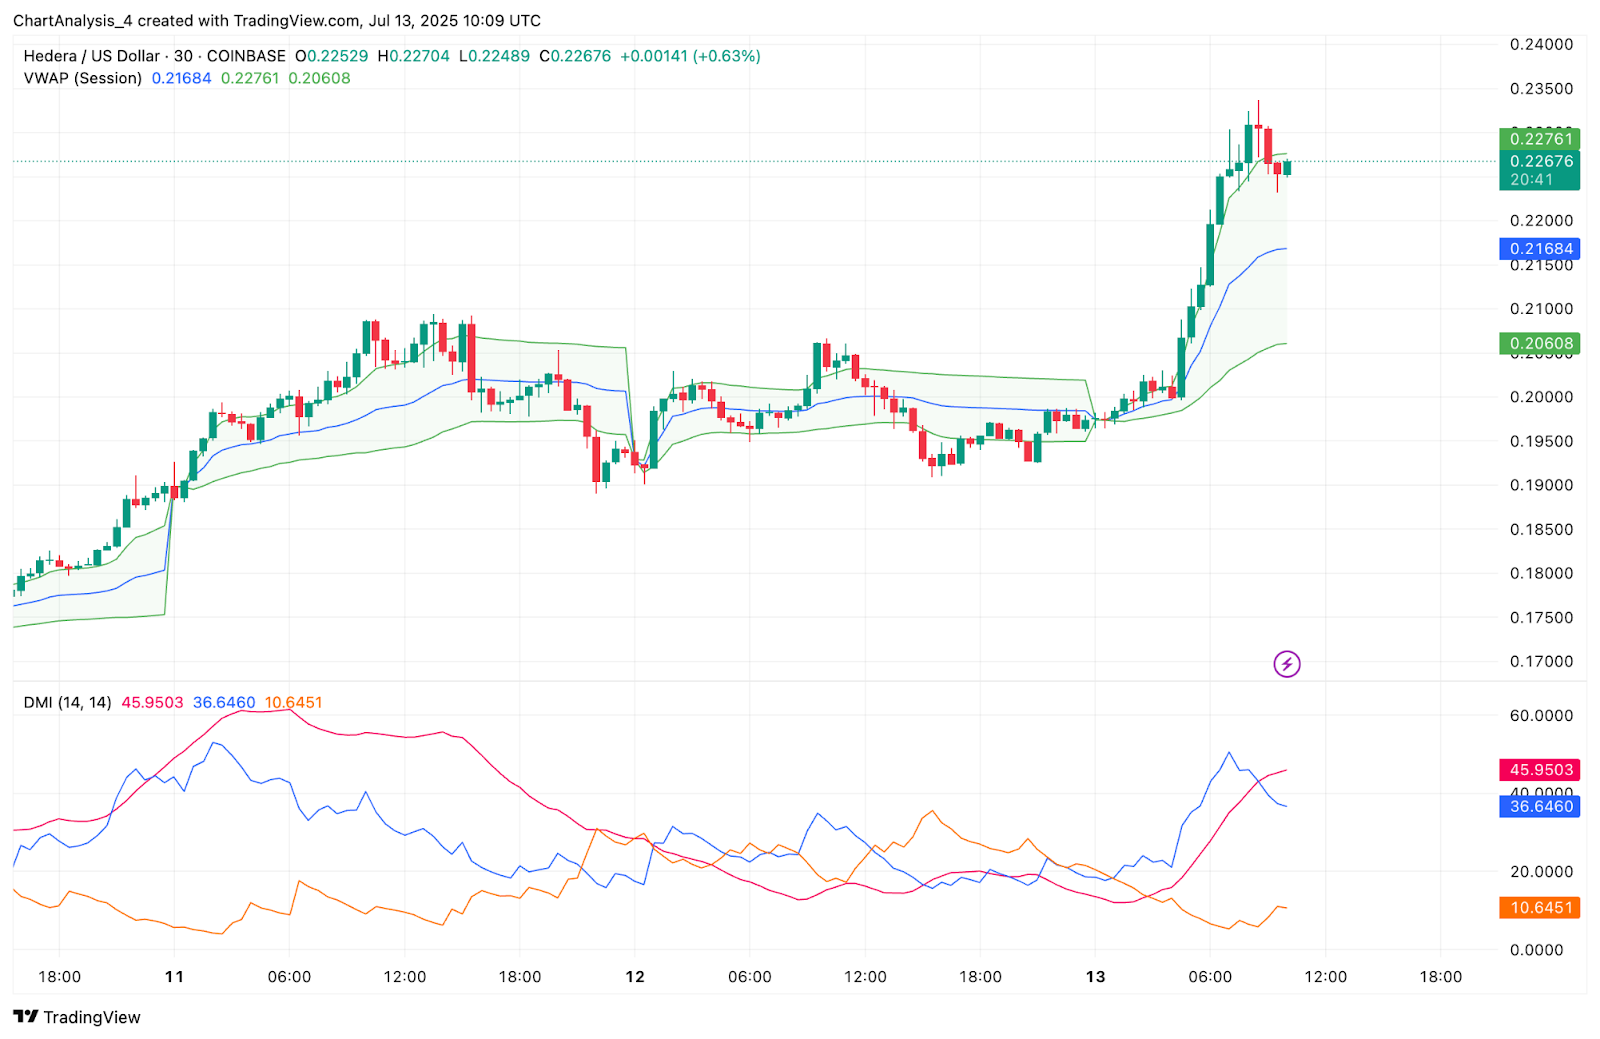
VWAP levels are also trending upward with price holding above both the upper band and mean line, reinforcing aggressive buy-side pressure.
From a trend strength standpoint, DMI shows a powerful +DI lead at 45.95, indicating strong trend continuation, even though a brief consolidation near $0.225 may be necessary in the short term due to overheated momentum.
Bollinger Bands, Parabolic SAR and EMAs Confirm Breakout Strength
The 4-hour chart paints a technically bullish picture. Bollinger Bands have expanded with price riding the upper band, a typical pattern during sustained rallies. All EMAs — including the 20, 50, 100, and 200 — are now positioned well below current price levels. The 20 EMA at $0.197 and 50 EMA at $0.181 will serve as the first pullback support zones in case of any short-term cooling.
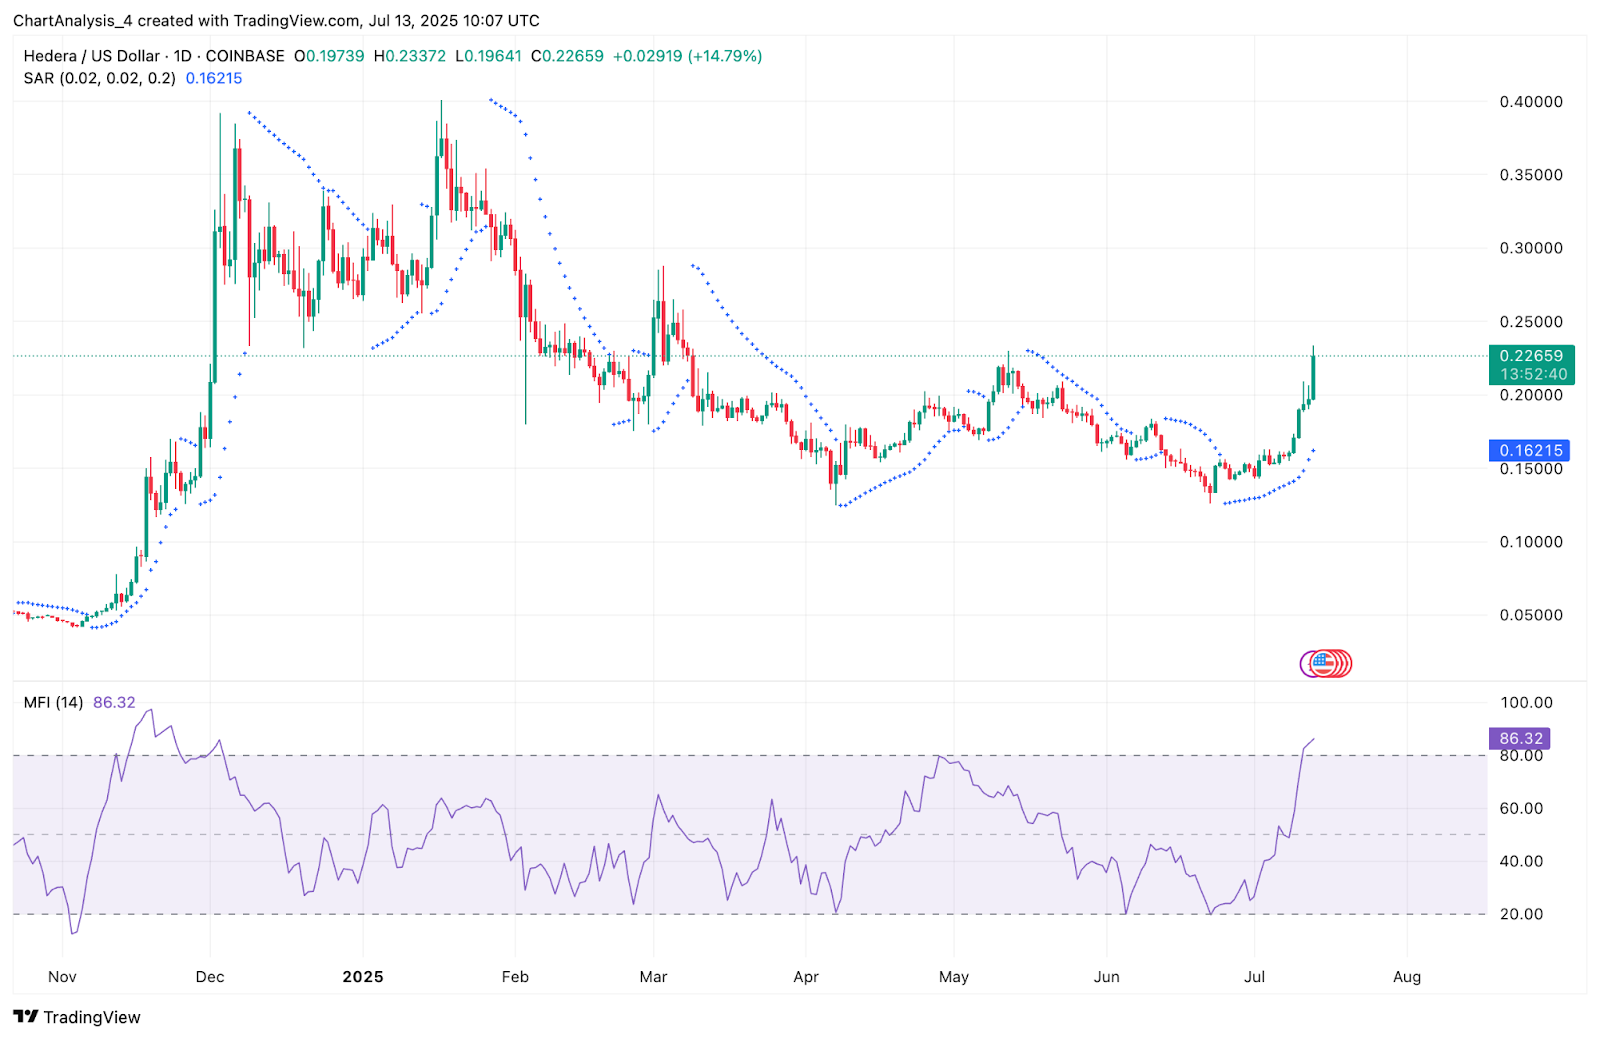
Meanwhile, the Parabolic SAR on the daily timeframe has flipped fully bullish, placing dots below price action since the breakout candle on July 12. This suggests the trend is still in its acceleration phase. The MFI has surged to 86.3, indicating very strong capital inflows — although such a high reading may also precede short-term mean reversion.
HBAR Price Prediction: Short-Term Outlook (24H)
With HBAR price now trading near $0.226 and pushing against the upper bound of recent resistance zones, traders should watch for two scenarios. If bulls manage to push above $0.233 with volume confirmation, the next upside target lies at $0.24 and then $0.263. These levels align with historical liquidity pockets and Fibonacci zones on the weekly chart.
However, if HBAR fails to sustain above $0.225, minor retracement toward the $0.212–$0.218 VWAP and EMA confluence area is likely. A deeper pullback may extend to the $0.197 zone, which coincides with the Bollinger mid-band and previous breakout base.
Given the current overbought conditions on multiple indicators but structurally bullish backdrop, consolidation above $0.22 would be healthy before a continuation leg higher.
HBAR Price Forecast Table: July 14, 2025
| Indicator/Zone | Level / Signal |
| HBAR price today | $0.226 |
| Resistance 1 | $0.233 |
| Resistance 2 | $0.263 (Fib 0.382) |
| Support 1 | $0.218 (VWAP/EMA confluence) |
| Support 2 | $0.197 (20 EMA & BB midline) |
| RSI (30-min) | 72.09 (Overbought) |
| MACD (30-min) | Bullish Momentum |
| MFI (1D) | 86.32 (Extreme inflows) |
| Parabolic SAR (1D) | Bullish Trend Confirmed |
| Bollinger Bands (4H) | Expanded – Breakout Active |
| EMA Cluster (20/50/100/200, 4H) | All Bullishly Aligned Below Price |
| VWAP (30-min) | Support at $0.218–$0.220 |
| DMI (14) | +DI Strong, Trend Continuing |
| Fibonacci (Weekly) | Price Above 0.5 Level at $0.221 |
| Netflow (CoinGlass) | +$5.11M Inflow – Bullish Bias |
Disclaimer: The information presented in this article is for informational and educational purposes only. The article does not constitute financial advice or advice of any kind. Coin Edition is not responsible for any losses incurred as a result of the utilization of content, products, or services mentioned. Readers are advised to exercise caution before taking any action related to the company.
 Price Prediction for July 15")


 Price Prediction for July 14, 2025: BONK Holds Above Key Support As Bulls Eye $0.00002748 Breakout")
 Price Prediction for July 14, 2025: Wild Reversal Follows Historic $600M ICO Frenzy")
