
 Price Prediction For July 16")

Pi Coin price continues to struggle near a long-standing support zone after multiple failed breakout attempts. While bulls are trying to stabilize above key levels, the overall structure hints at fading momentum and potential breakdown if demand does not return.
Pi Coin Price Forecast Table: July 16 2025
| Indicator/Zone | Level / Signal |
| Pi Coin price today | $0.4507 |
| Resistance 1 | $0.4635 (EMA20) |
| Resistance 2 | $0.4859 / $0.4930 (EMA50 + trendline) |
| Support 1 | $0.4460 |
| Support 2 | $0.4200 |
| RSI (30-min) | 40.85 (Neutral-Bearish) |
| MACD (30-min) | Slight Bearish Crossover |
| Bollinger Bands (4H) | Tightening, testing lower band |
| EMA Cluster (20/50/100/200, 4H) | Bearishly stacked above price |
| Parabolic SAR (30-min) | Bearish (dots above price) |
| VWAP (Session) | $0.4523 (price below) |
| CHoCH/BOS (4H) | Confirmed near $0.4750 / $0.5000 |
| CMF (2H) | -0.04 (capital outflow) |
What’s Happening With Pi Coin’s Price?
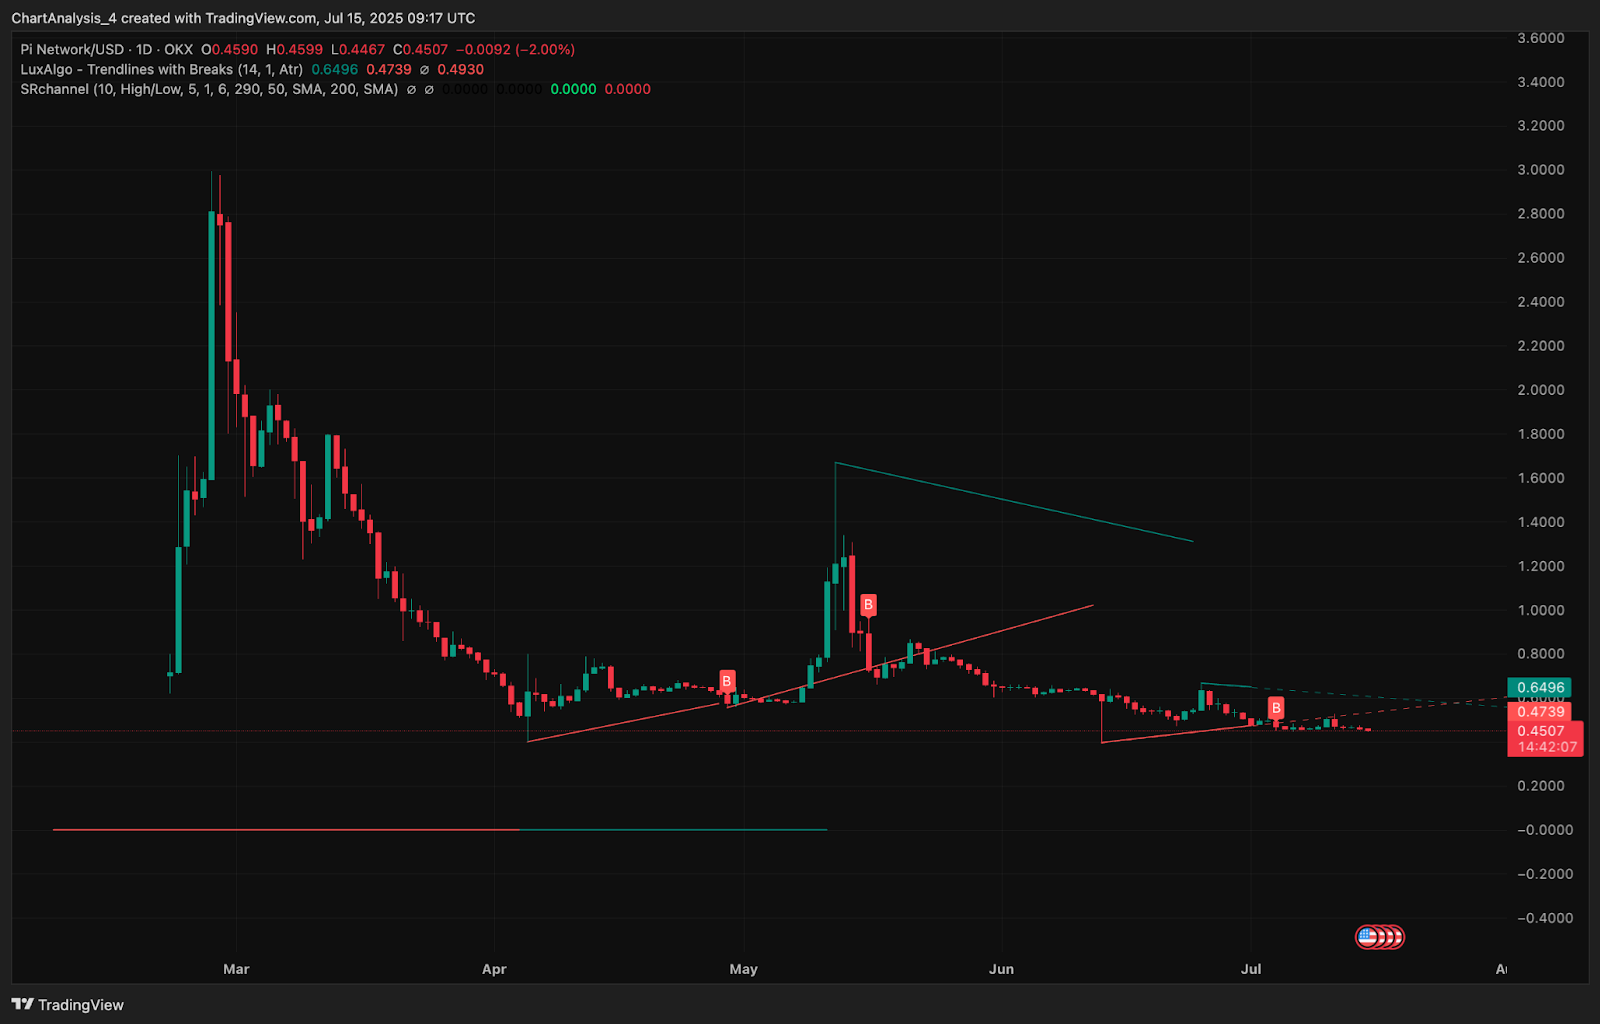
Pi Coin price today is trading near $0.4507 after a consistent downtrend that began following its failure to sustain above $0.6500 in late June. On the 4-hour chart, price is hovering just above a key demand zone near $0.4462–$0.4200, which has repeatedly absorbed selling pressure over the past month.
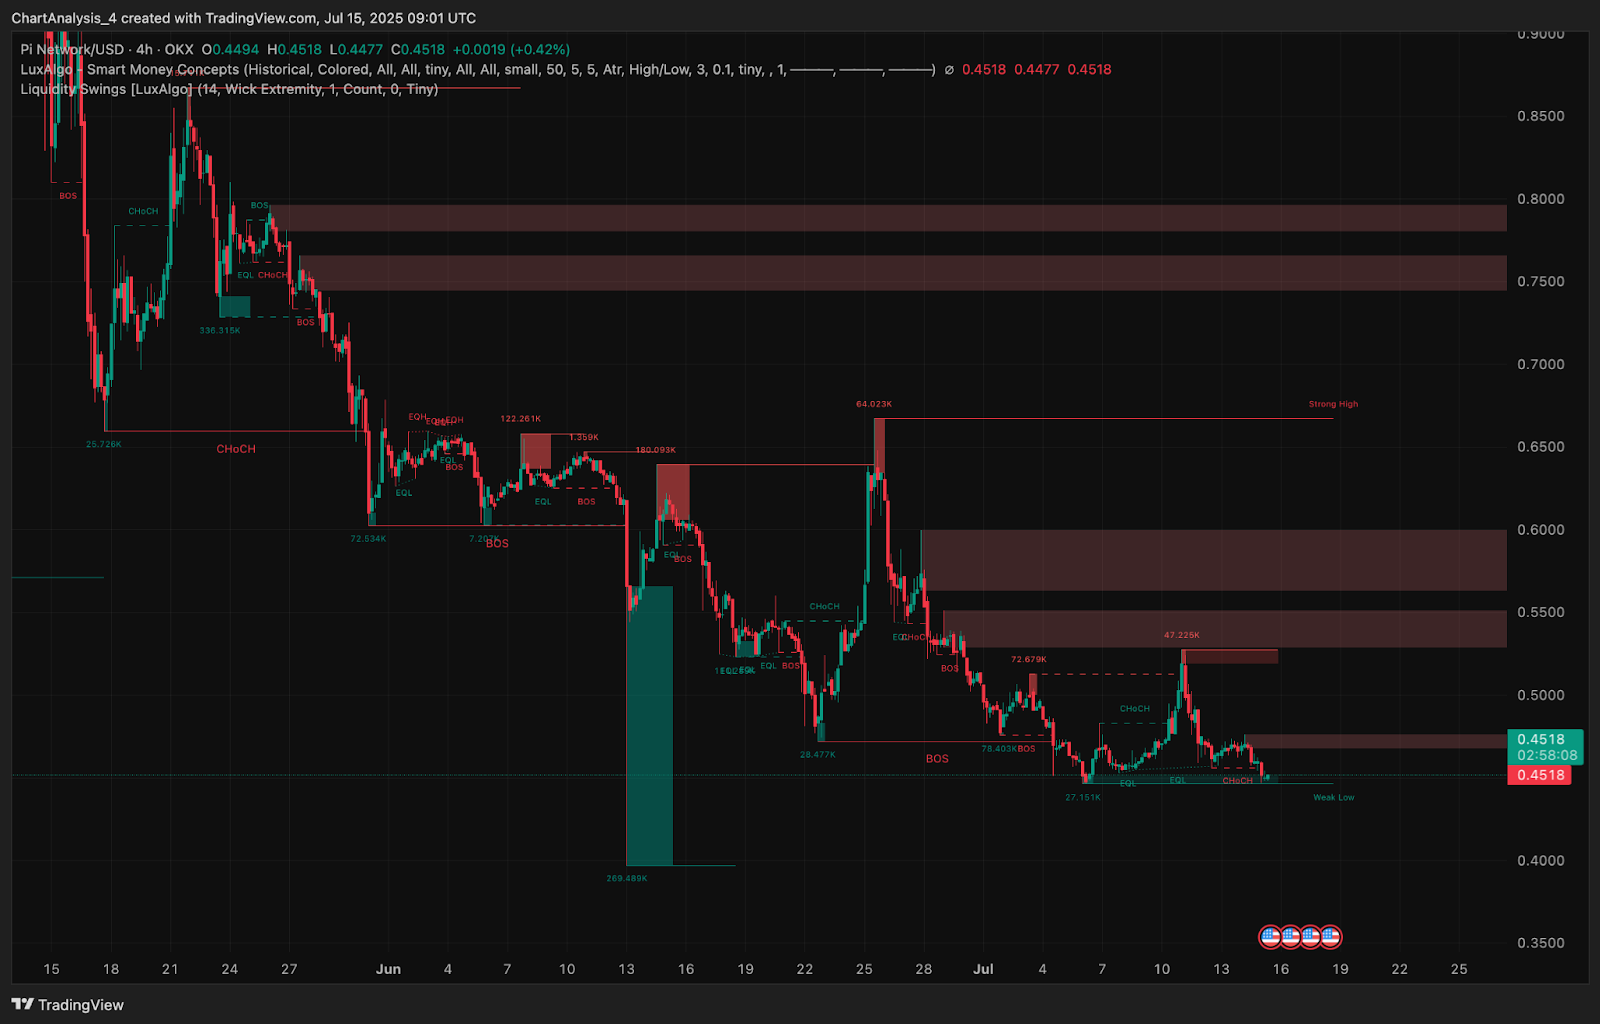
The current setup shows multiple change-of-character (CHoCH) and break-of-structure (BOS) signals near the $0.4750 and $0.5000 levels, indicating continued market inefficiency and liquidity sweeps. Smart Money indicators suggest that sellers are controlling momentum, especially as price rejected the $0.5500–$0.6000 supply zone last week.
On the daily timeframe, Pi Coin price action has compressed into a descending triangle structure, with the lower bound at $0.4460 acting as a horizontal support. This is now the third test of the range since June began, increasing the probability of a downside break unless bulls defend with volume.
Why Pi Coin Price Going Down Today?
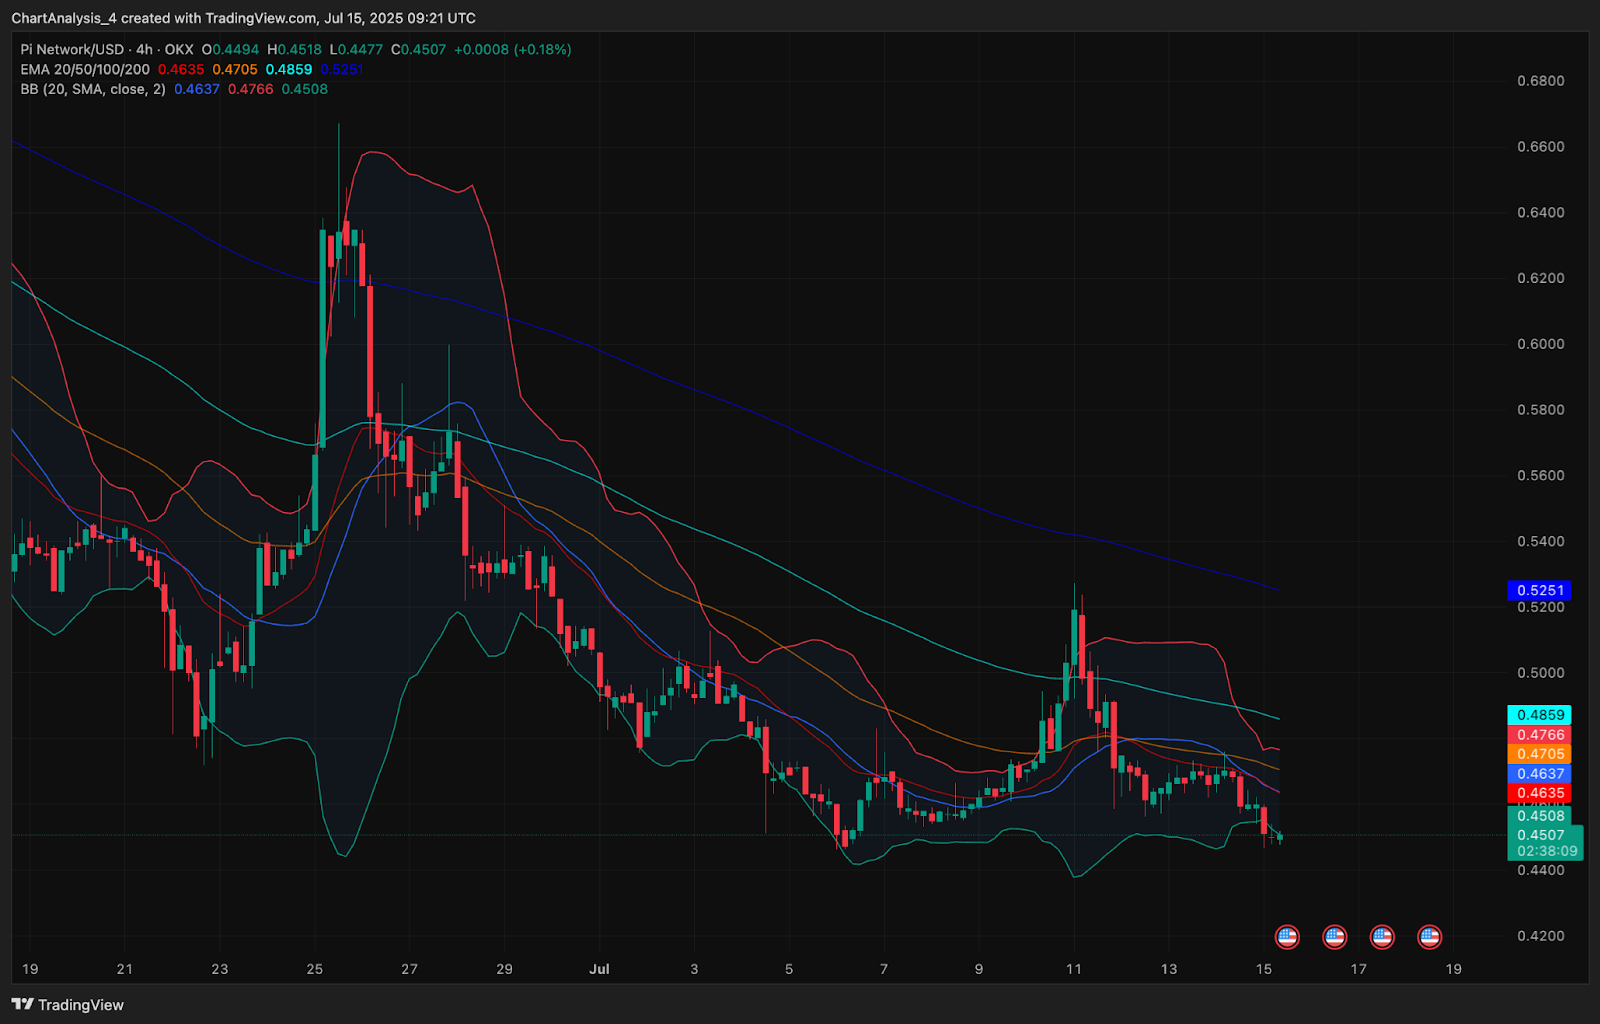
The ongoing decline in Pi Coin price today is driven by both weakening trend strength and persistent rejection from dynamic resistance levels. On the 4-hour Bollinger Bands, price is pressing against the lower band ($0.4460) after failing to hold mid-band resistance near $0.4705. Band compression is signaling another potential expansion phase, likely downward unless bulls reclaim the $0.4650–$0.4700 range.
EMA structure is also bearish across all short and medium timeframes. The 20/50/100/200 EMA stack on the 4-hour chart shows clear downside alignment, with all major moving averages sitting above current price. Also the 200 EMA is at $0.5251, which aligns with the macro trendline from late April.
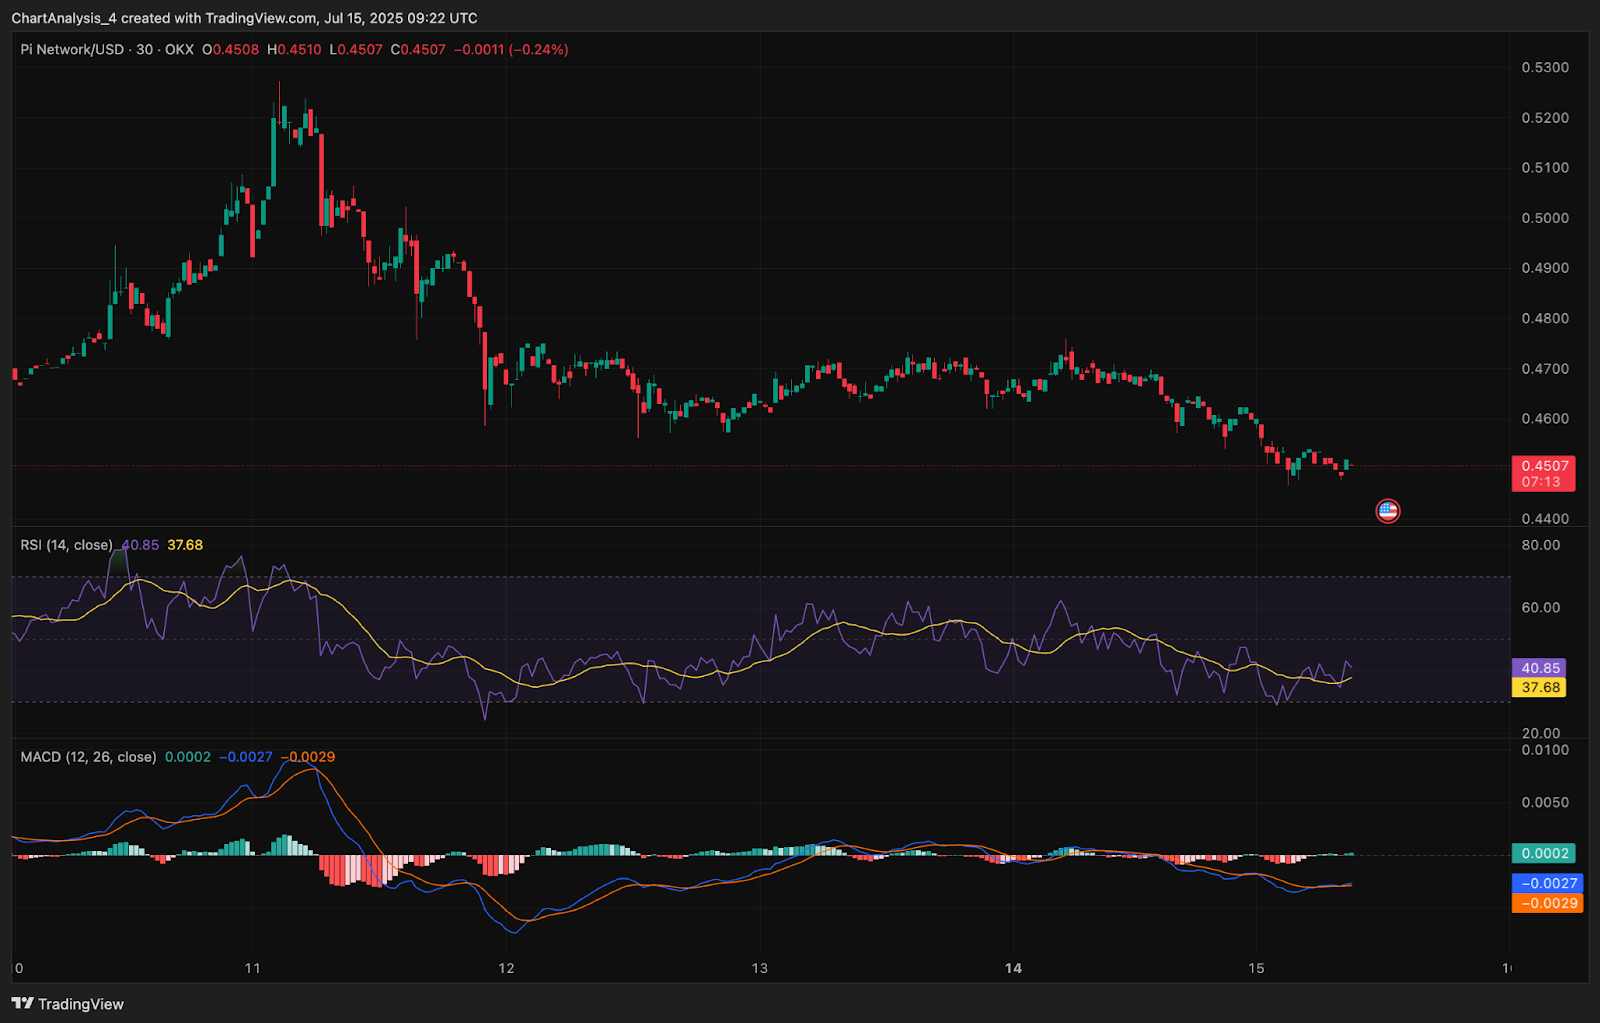
Momentum indicators continue to reflect bearish bias. The 30-minute RSI sits at 40.85, still below the neutral 50 mark, while the MACD shows a slight bearish crossover, with the histogram barely recovering above the zero line.
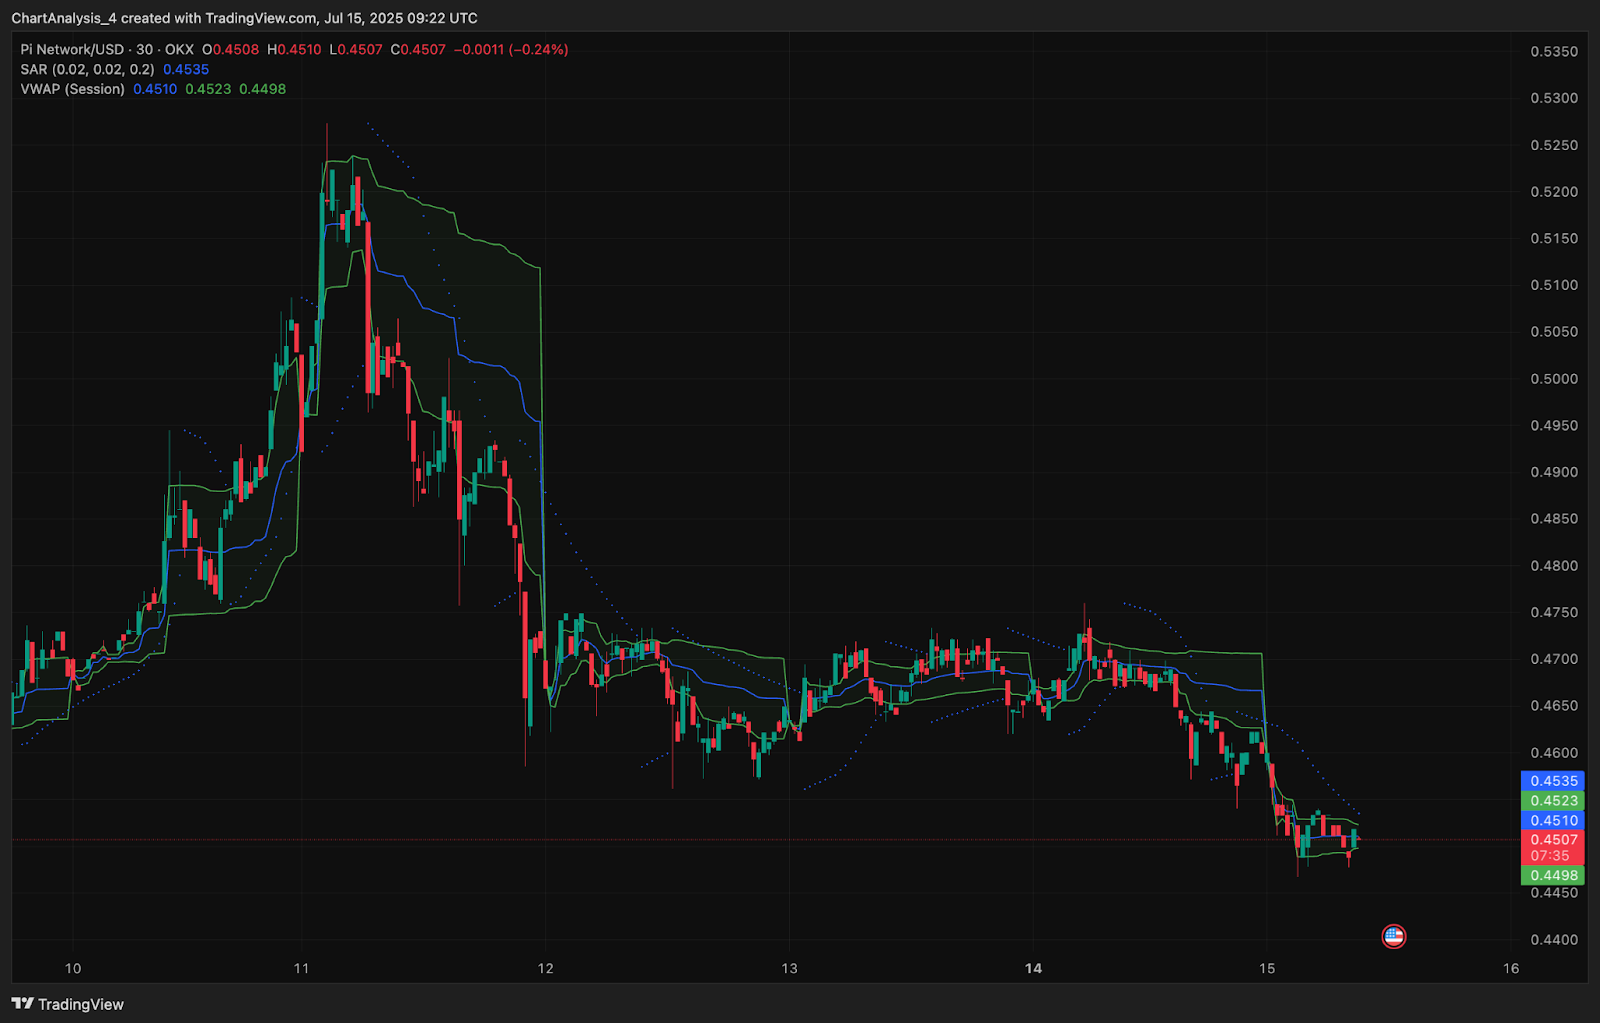
Parabolic SAR dots remain above price on the 30-minute chart, reinforcing the short-term downtrend, while session VWAP shows price struggling below the mean line at $0.4523.
Bearish Pressure Builds At Major Demand Block
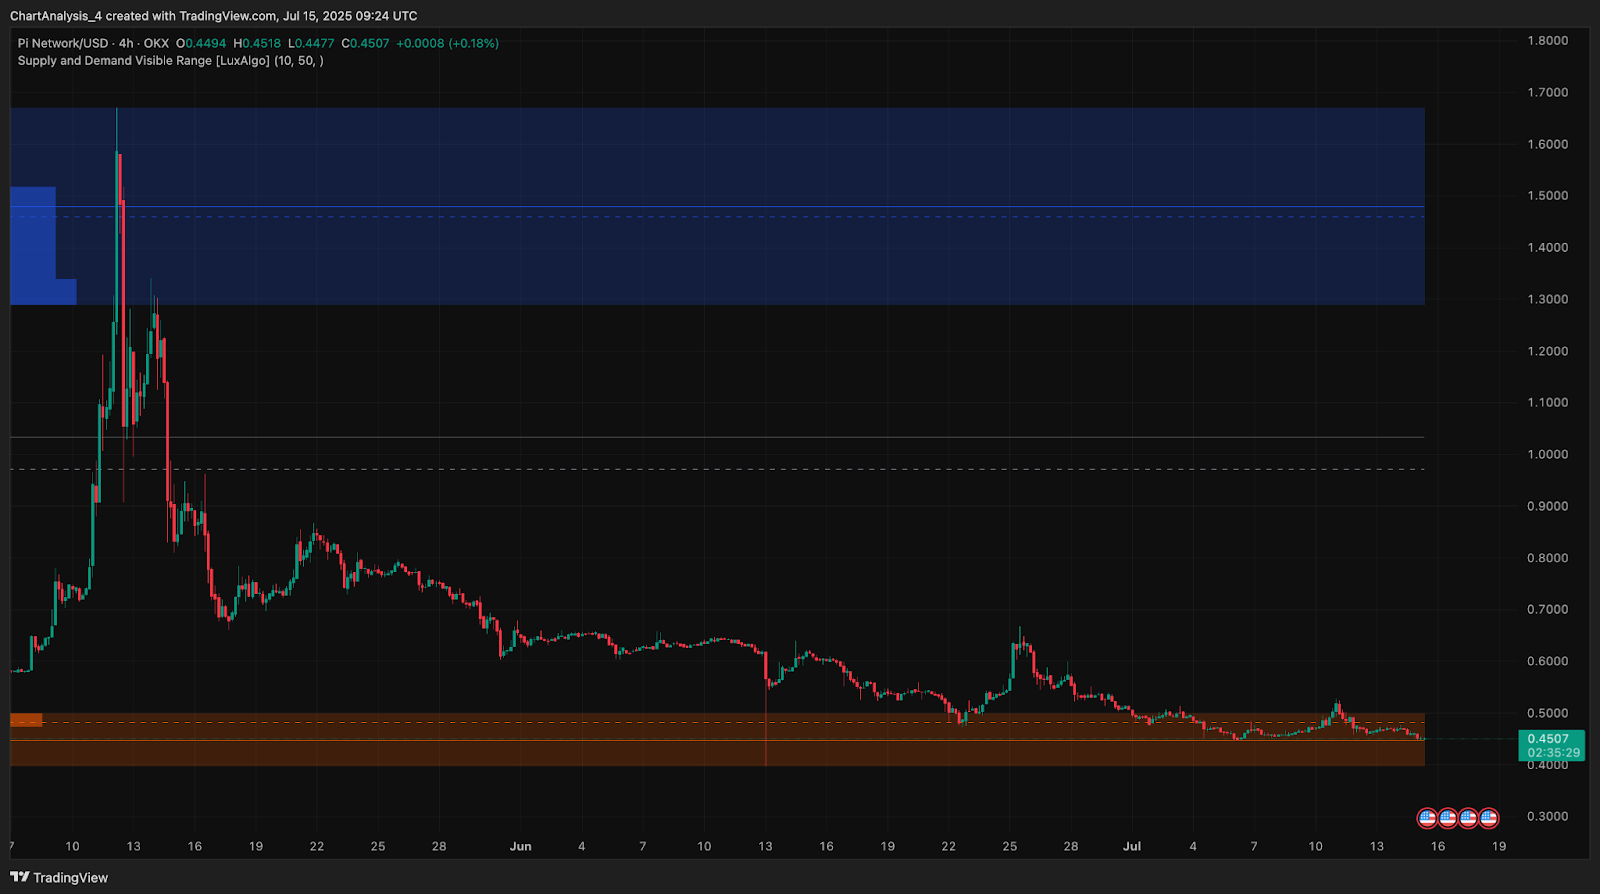
Volume-based indicators and liquidity zones suggest that Pi Coin price is entering a high-stakes region. The supply-demand heatmap reveals a large accumulation zone between $0.4000 and $0.4600, which has historically triggered short-term bounces. However, without fresh demand, this level may not hold much longer.
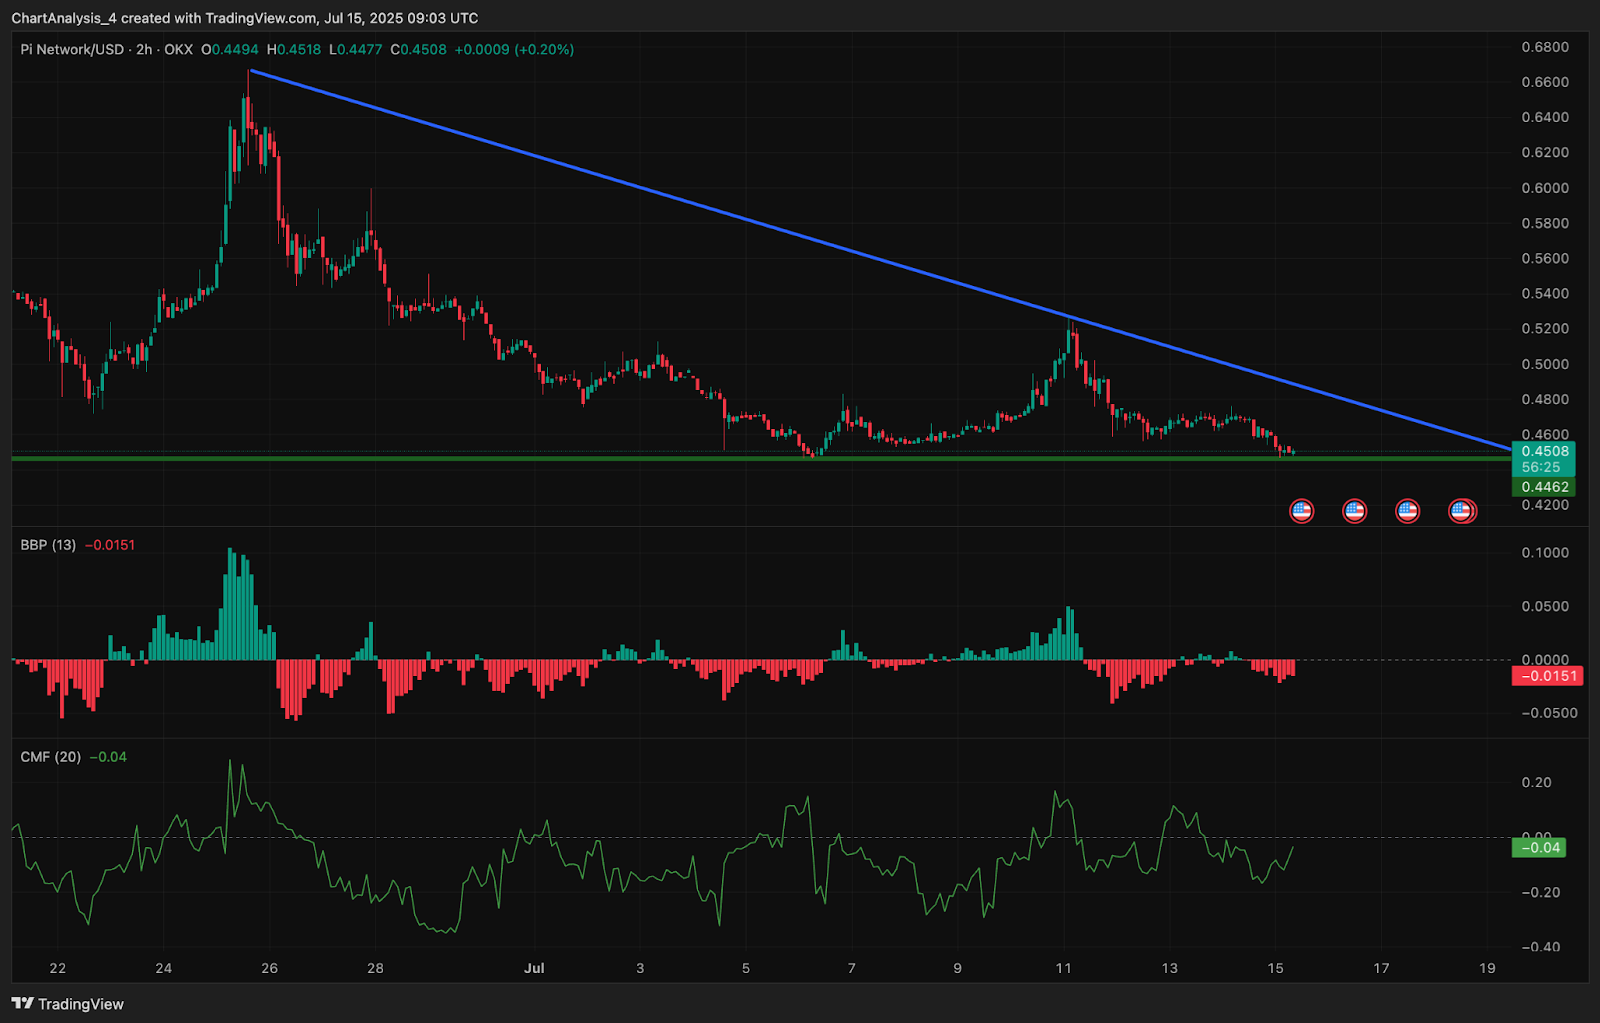
The BBP (Bull-Bear Power) indicator remains negative at -0.0151, suggesting bears are still in control of the intraday bias. Meanwhile, the Chaikin Money Flow (CMF) prints at -0.04, reflecting persistent capital outflow, a red flag for bulls looking to stage a recovery.
PI Price Prediction: Short-Term Outlook (24h)
In the next 24 hours, Pi Coin price is expected to continue testing the $0.4460 support region. A clean break below this level could open a move toward $0.4200, followed by deeper downside targets near $0.4000, the lower bound of the visible demand block.
If bulls reclaim $0.4635 (EMA20) with strong volume, a short squeeze toward $0.4850 and $0.5000 could unfold. However, all momentum and volume signals currently lean bearish.
A reversal remains possible, but only if key levels flip into support. Traders should monitor the $0.4460–$0.4520 range closely for signs of reaction or breakdown.
Disclaimer: The information presented in this article is for informational and educational purposes only. The article does not constitute financial advice or advice of any kind. Coin Edition is not responsible for any losses incurred as a result of the utilization of content, products, or services mentioned. Readers are advised to exercise caution before taking any action related to the company.
 Price Prediction 2025, 2026, 2027, 2028-2030")
 Price Prediction For July 16")
 Price Prediction For July 16")
 Price Prediction for July 16")
 Price Prediction for July 16 2025")
