
 Price Prediction for July 22")

After weeks of steady buildup, the Ethereum price today is trading near $3,759, marking a 51 percent monthly surge and testing a multi-year triangle resistance on the monthly chart. This move comes as ETH challenges the upper boundary of a long-standing consolidation pattern, suggesting the potential for a macro breakout if the $3,800–$4,100 zone is cleared convincingly.
What’s Happening With Ethereum’s Price?
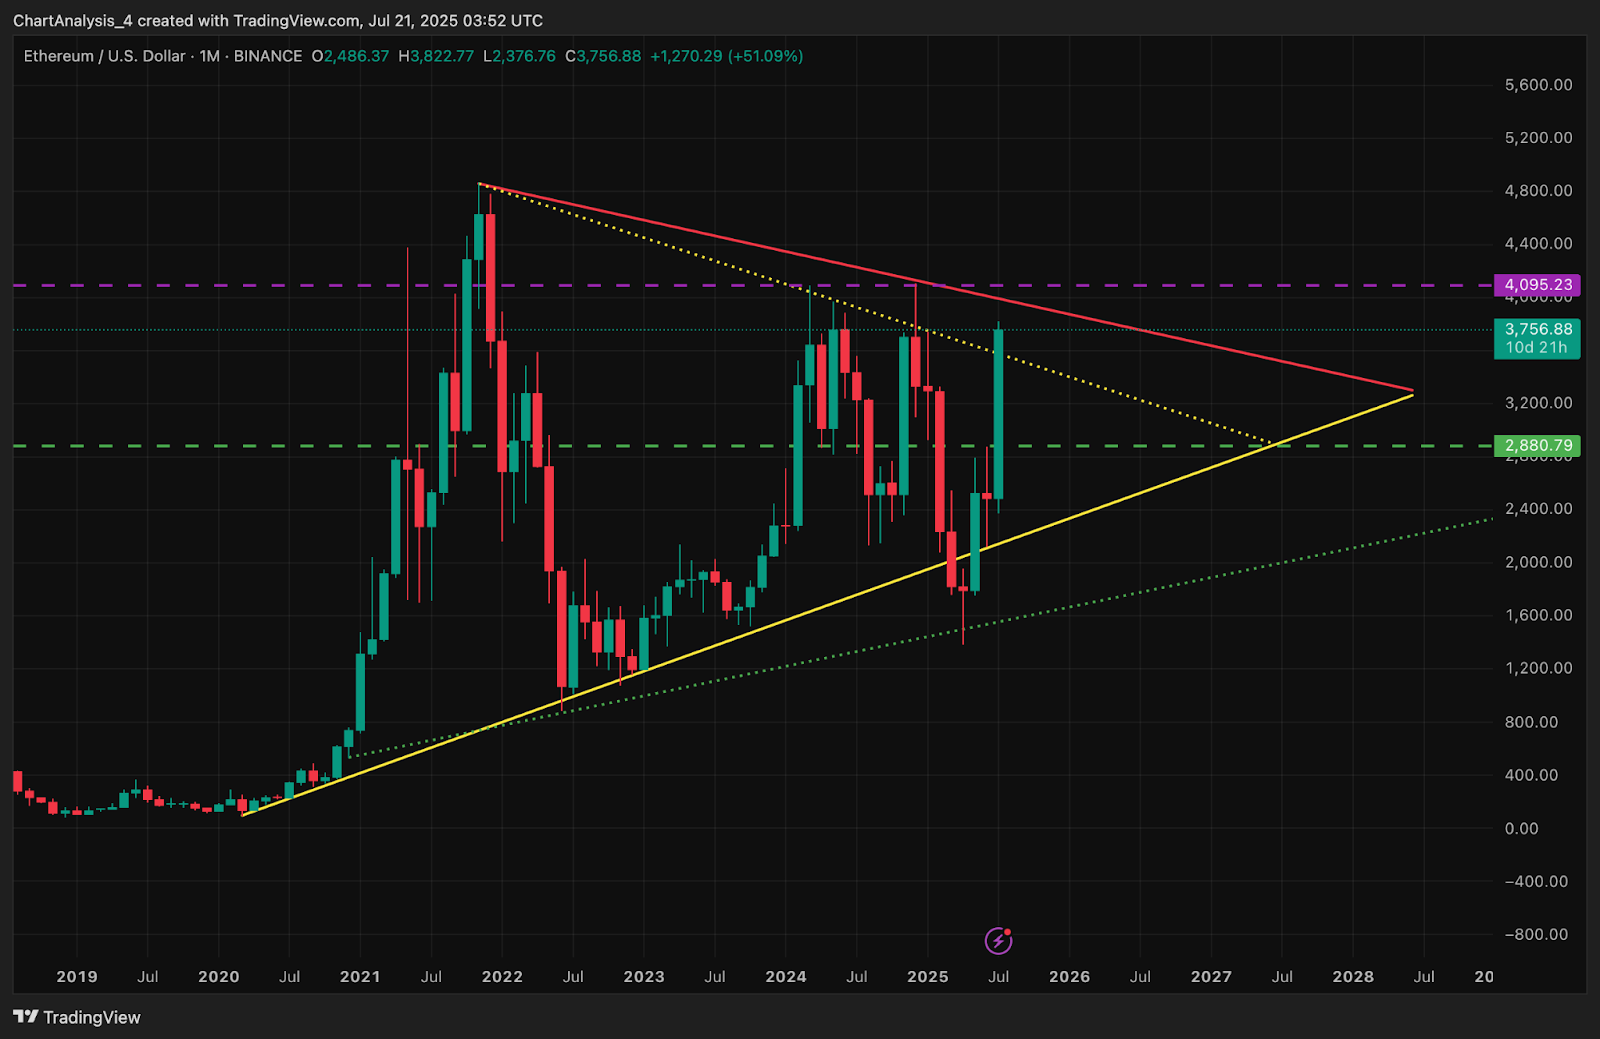
Ethereum has pushed firmly into the apex zone of a multi-year triangle structure visible on the monthly chart. Price is now attempting to break out of this formation, with $4,095 acting as the ceiling from a previous all-time high supply pocket. A monthly close above $3,800 would confirm a structural shift that could potentially re-open the door toward $4,500 and beyond.
On the 4-hour timeframe, Ethereum price action is locked inside a clean ascending channel, with higher highs and higher lows forming since the second week of July. Dynamic support is being provided by the 20 EMA at $3,610 and Parabolic SAR dots are still printing below price, confirming trend continuation. A break below $3,610 could threaten the structure short term, but as of now, bulls remain in control.
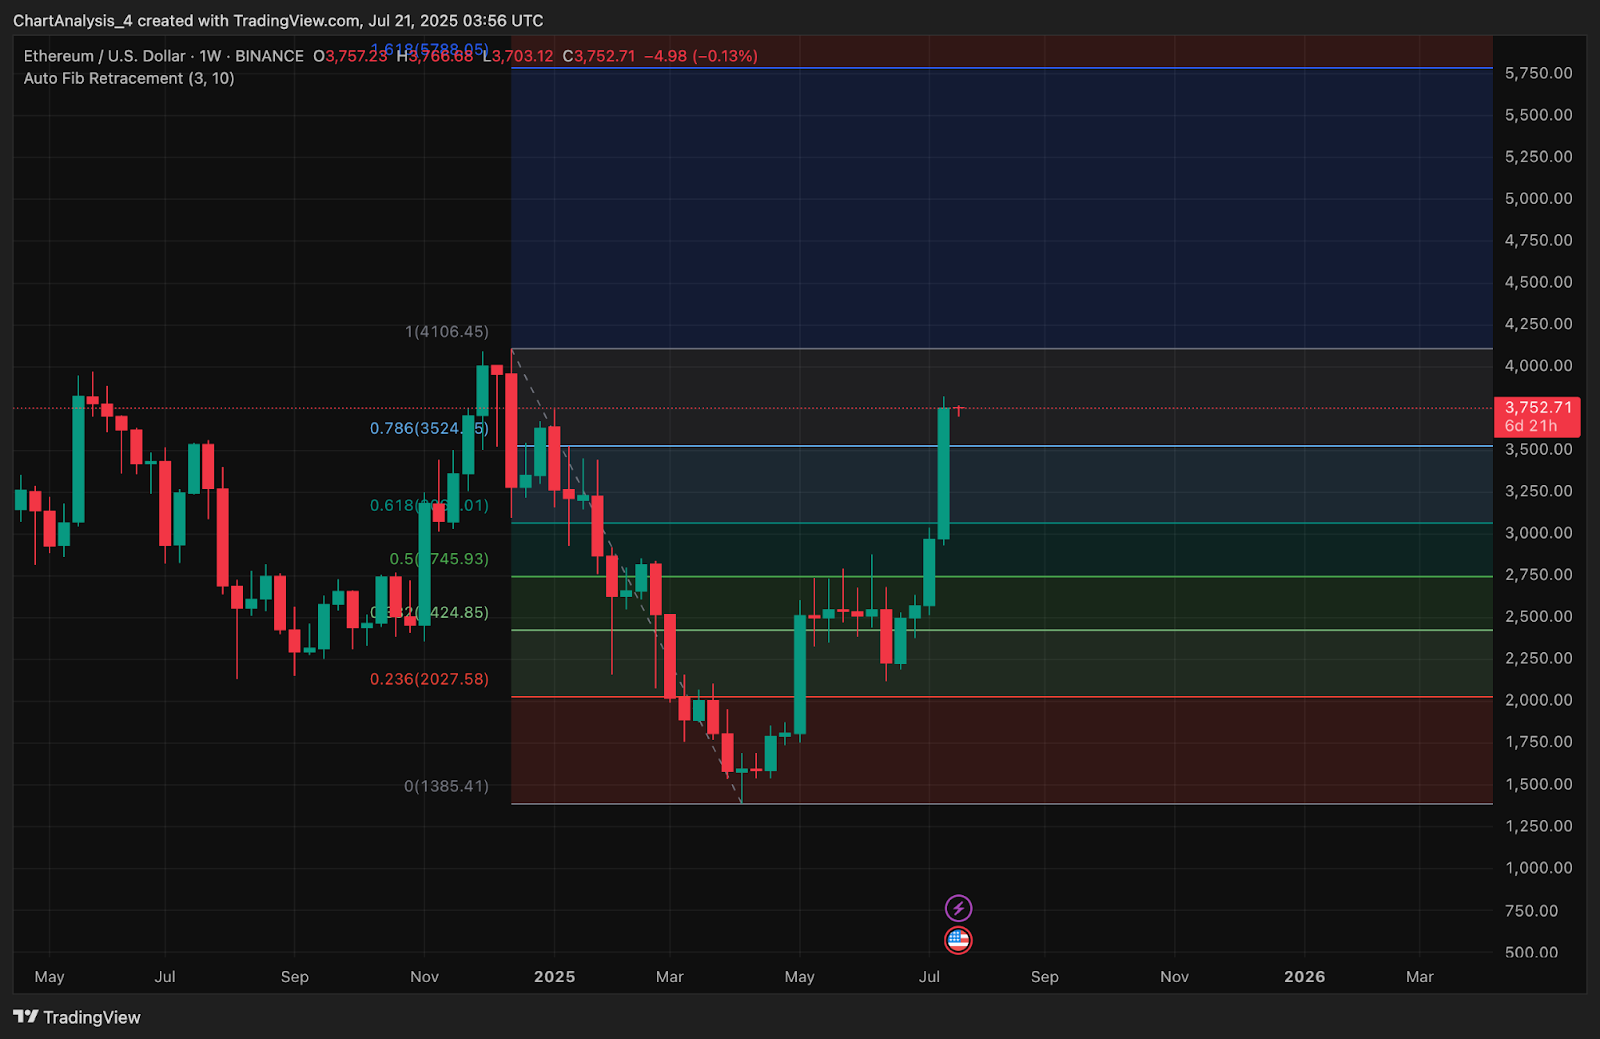
The weekly Fibonacci retracement shows price hovering near the 0.786 level at $3,524. A clear hold above this zone would increase the probability of a full retrace toward the 1.0 Fib extension at $4,106. If rejected, downside support lies around $3,425 (0.618) and then $3,100.
Why Is The Ethereum Price Going Up Today?
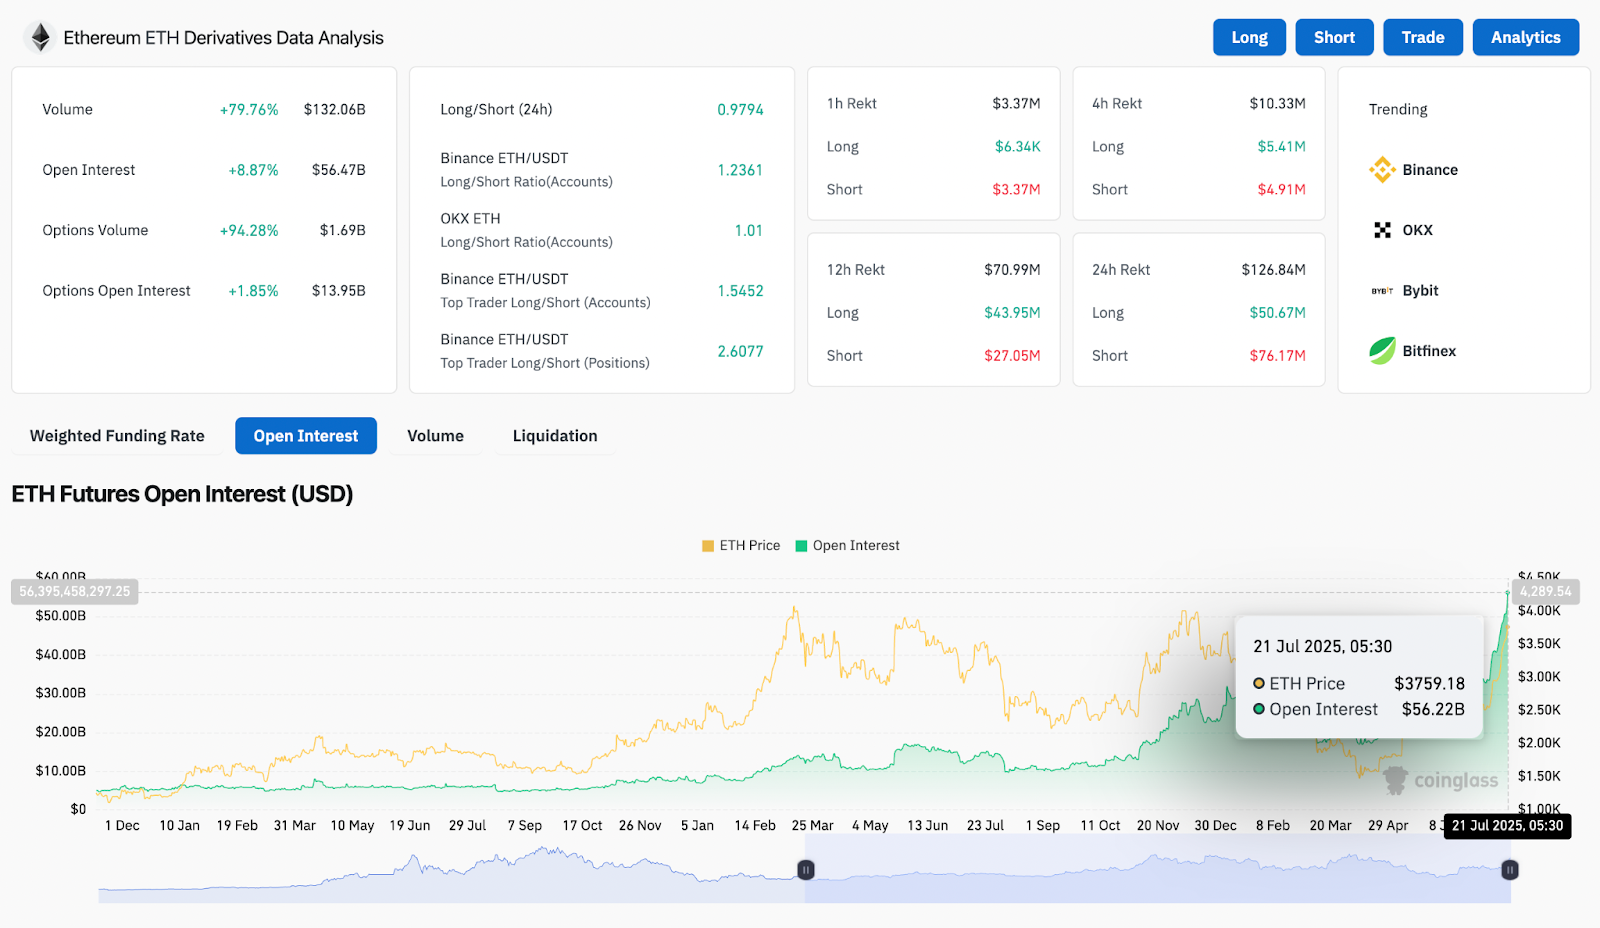
Why Ethereum price going up today is largely tied to explosive momentum in derivatives and clear market structure shifts. Coinglass data shows Ethereum open interest is up 8.87 percent to $56.2B while options volume surged nearly 94 percent. Binance top trader long/short positioning is at 2.60, indicating aggressive long positioning across accounts and positions.
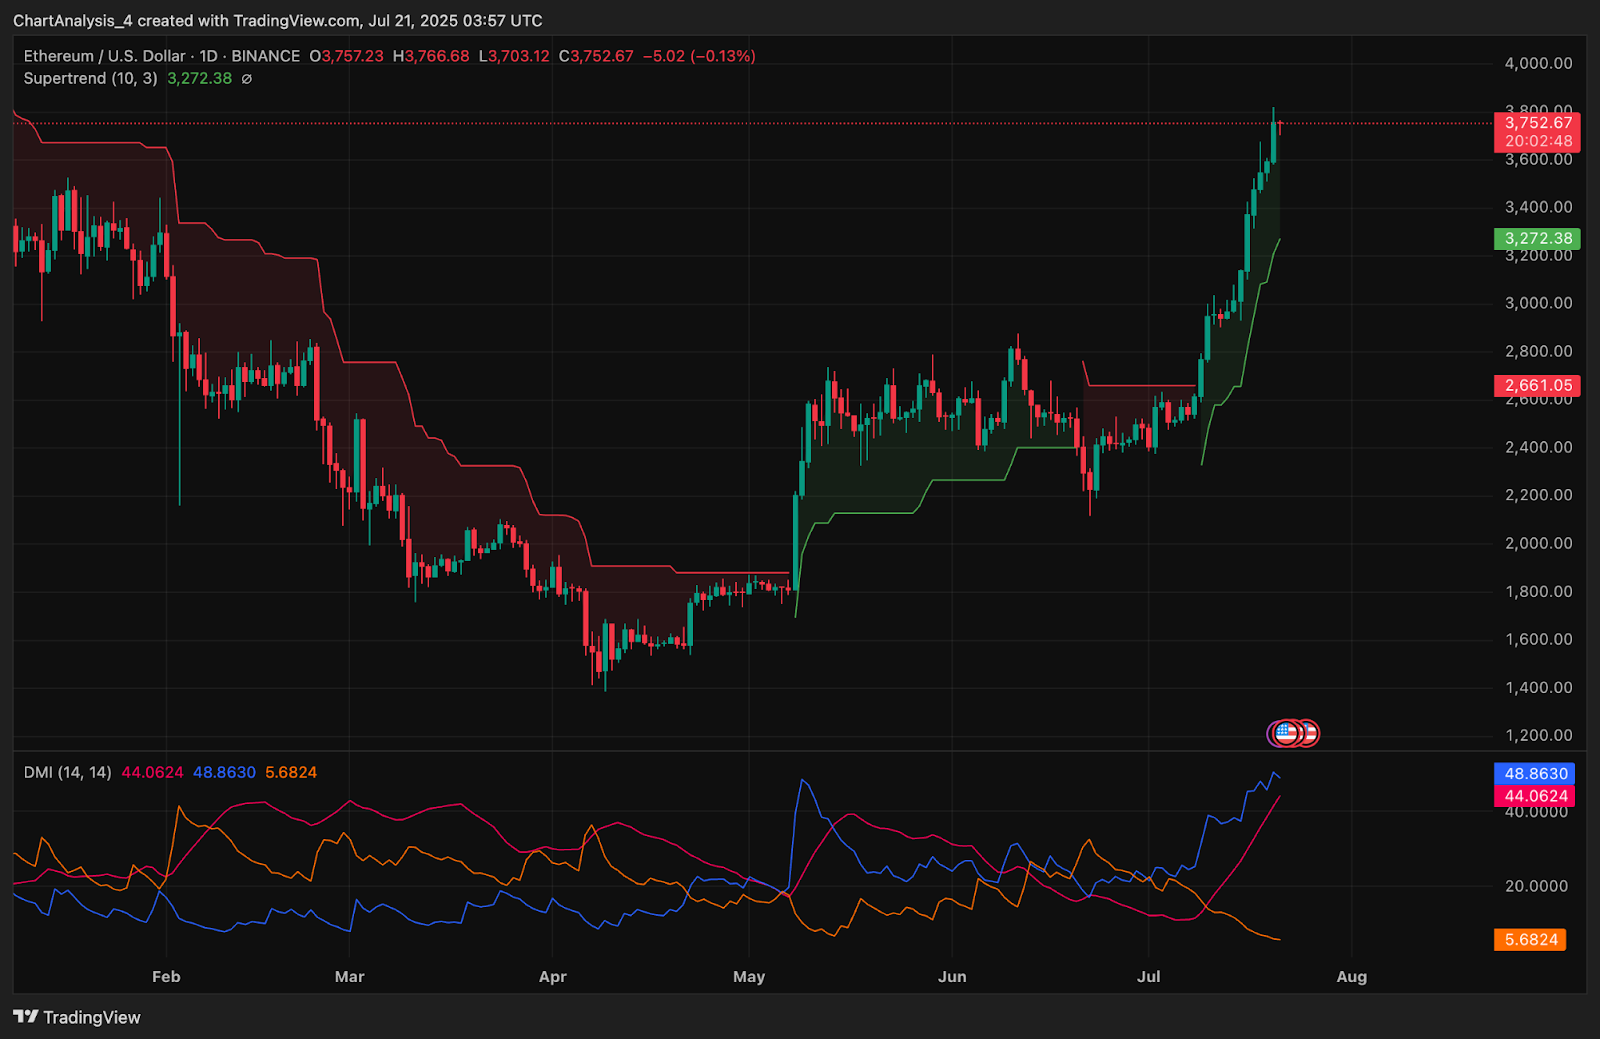
The DMI (Directional Movement Index) on the daily chart reinforces trend strength, with +DI leading at 48.86 and ADX at 44.06. This reflects a strong trending environment where bulls remain in control. The Supertrend indicator has flipped bullish since the $3,270 breakout and remains supportive unless ETH closes below $3,272.
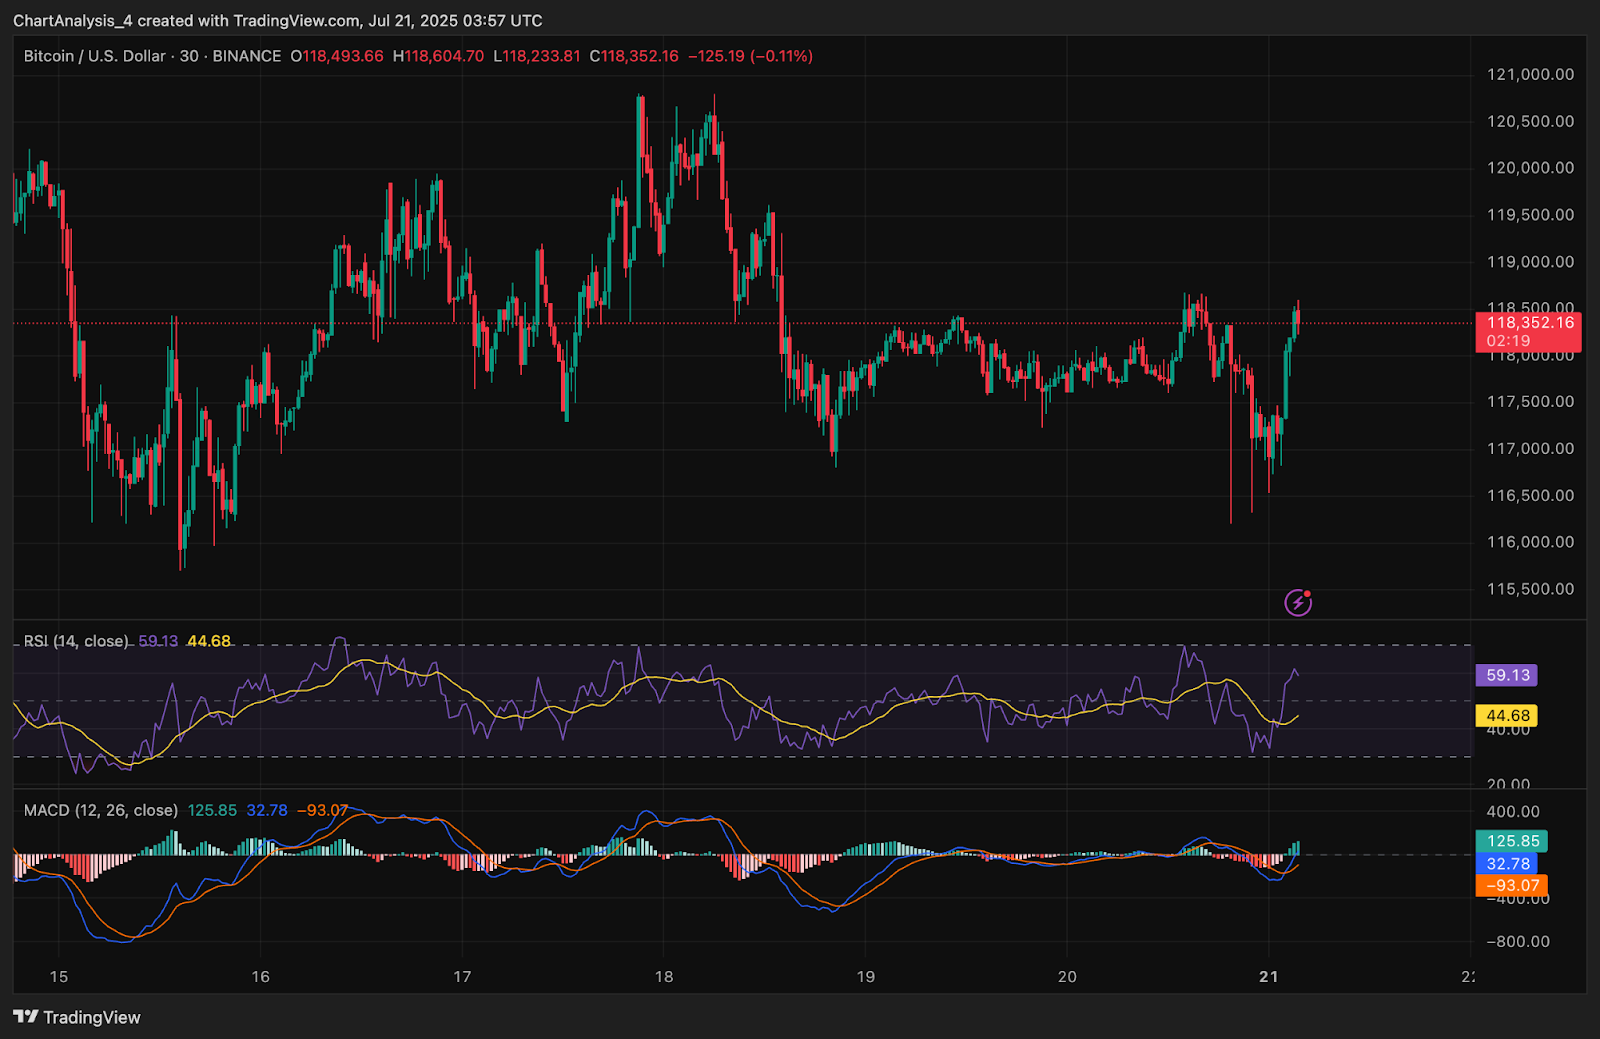
On the intraday 30-minute chart, RSI has bounced to 59.13, approaching bullish territory. The MACD histogram has flipped positive with a fresh crossover and rising momentum. These signals reflect renewed buying strength after a short pullback on July 20.
Additionally, ETH continues to outperform altcoins in volume and dominance, even as the broader altcoin season index hovers near neutral territory. This rotation into large-cap assets like ETH reflects increased institutional participation and sustained capital inflow.
Price Indicators Point to Critical Retest Ahead
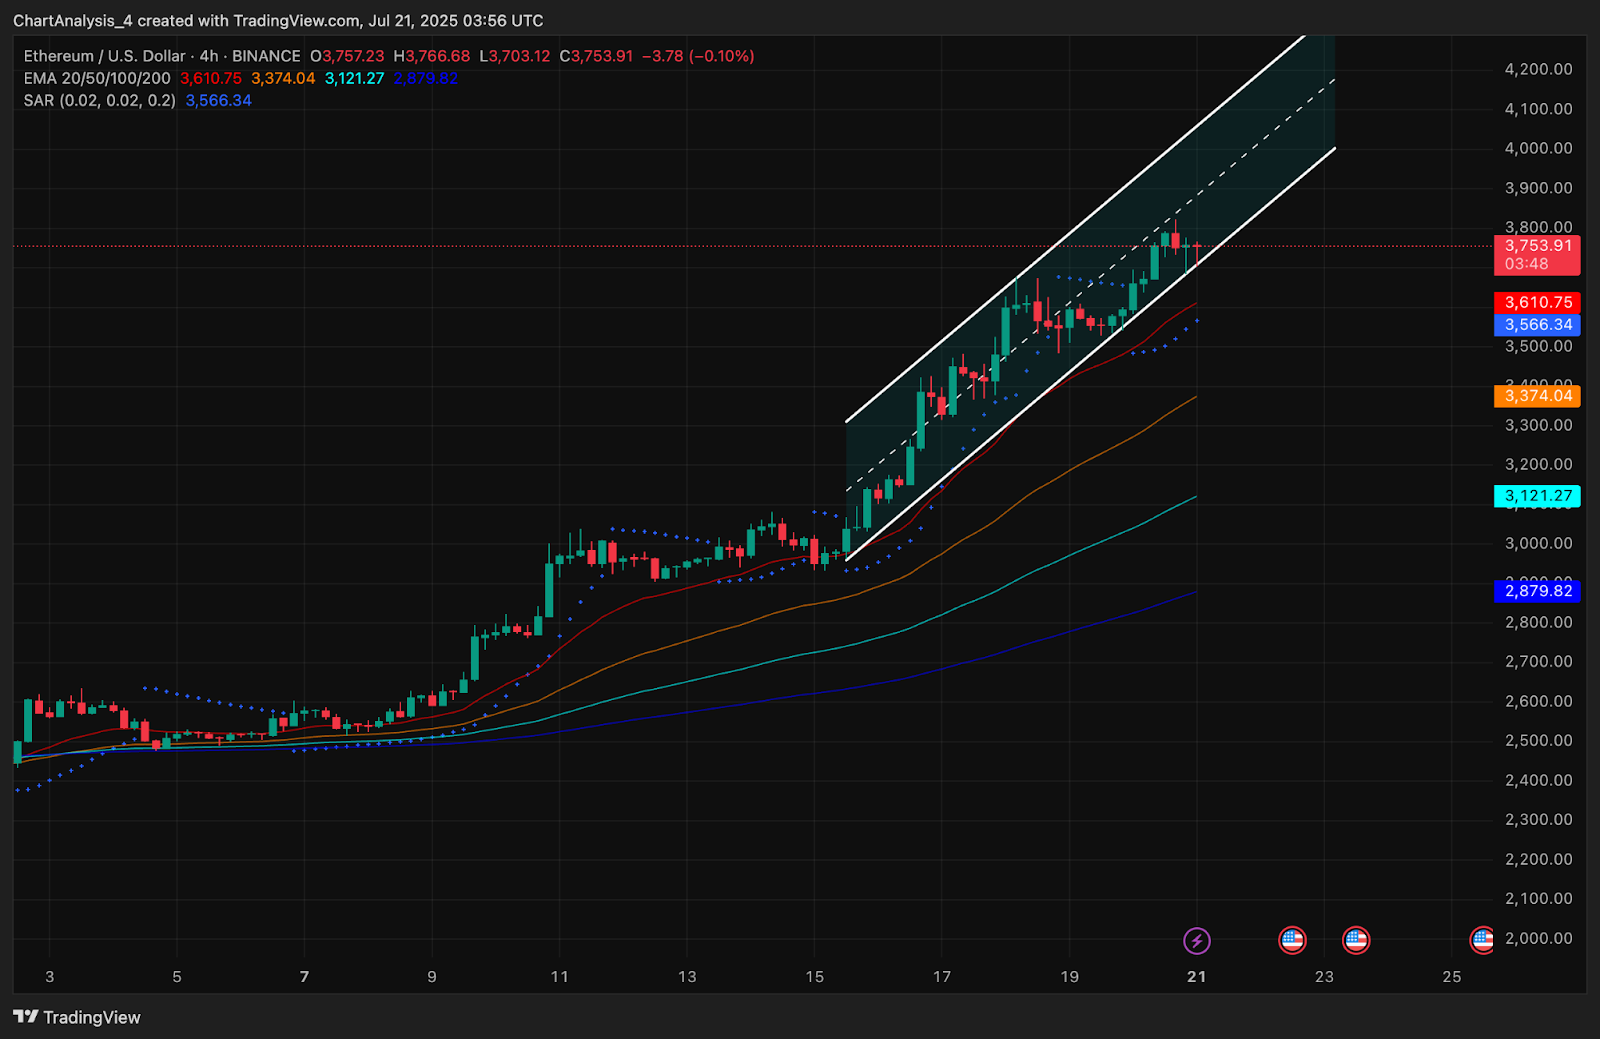
The combination of an ascending channel, strong Supertrend bias, and higher timeframe triangle pressure suggest Ethereum may be heading toward a make-or-break point. The 4-hour chart shows price testing the upper channel boundary near $3,770, with potential exhaustion signs emerging if $3,800 fails to break.
However, EMA clusters are stacked in bullish alignment:
- EMA 20: $3,610
- EMA 50: $3,374
- EMA 100: $3,121
- EMA 200: $2,879
This setup provides layered support if any intraday pullback emerges. A retest of the mid-channel region near $3,600 would be healthy as long as volume remains steady. The Fib structure also suggests that bulls must defend the $3,500–$3,600 area to maintain control over short-term direction.
ETH Price Prediction: Short-Term Outlook (24H)
If Ethereum clears $3,800 with volume support, the next logical target lies at $4,095, followed by the psychological milestone at $4,250. These levels align with the final leg of the multi-year triangle resistance and the full retracement from the November 2024 correction.
In the event of a rejection, ETH could retest $3,610 and $3,525. A sustained drop below $3,425 would shift the outlook back toward neutral and potentially bring $3,100 into focus. Traders should watch for rejection candles and declining volume near $3,800 to assess breakout sustainability.
With bullish indicators stacked and triangle resistance in play, Ethereum price today is approaching a significant technical juncture. The next few sessions may decide whether ETH enters a new macro uptrend or faces another round of compression.
Ethereum Price Forecast Table: July 22, 2025
| Indicator/Zone | Level / Signal |
| Ethereum price today | $3,759 |
| Resistance 1 | $3,800 |
| Resistance 2 | $4,095 |
| Support 1 | $3,610 |
| Support 2 | $3,524 |
| EMA 20/50/100/200 (4H) | Bullish stack |
| Fibonacci 0.786 / 1.0 Levels | $3,524 / $4,106 |
| Parabolic SAR (4H) | Below price (bullish) |
| Supertrend (1D) | Bullish above $3,272 |
| DMI +DI / ADX (1D) | 48.86 / 44.06 (strong trend) |
| ETH Futures Open Interest | $56.2B (+8.87%) |
| Derivatives Long Bias | Binance Top Traders 2.60 (long) |
Disclaimer: The information presented in this article is for informational and educational purposes only. The article does not constitute financial advice or advice of any kind. Coin Edition is not responsible for any losses incurred as a result of the utilization of content, products, or services mentioned. Readers are advised to exercise caution before taking any action related to the company.
 Price Prediction for July 22")
 Price Prediction for July 22")
 Price Prediction for July 21, 2025: XTZ Spikes Past $1.15 as Net Inflows Hit Multi-Month High")
 Price Prediction for July 21, 2025: PI Holds Near $0.445 as Volatility Compresses")
 Price Prediction for July 21, 2025: DOGE Surges Past $0.25 as Bullish Pattern Builds")
