


- XRP faces resistance at $3.65 after 500% rally, signaling short-term exhaustion
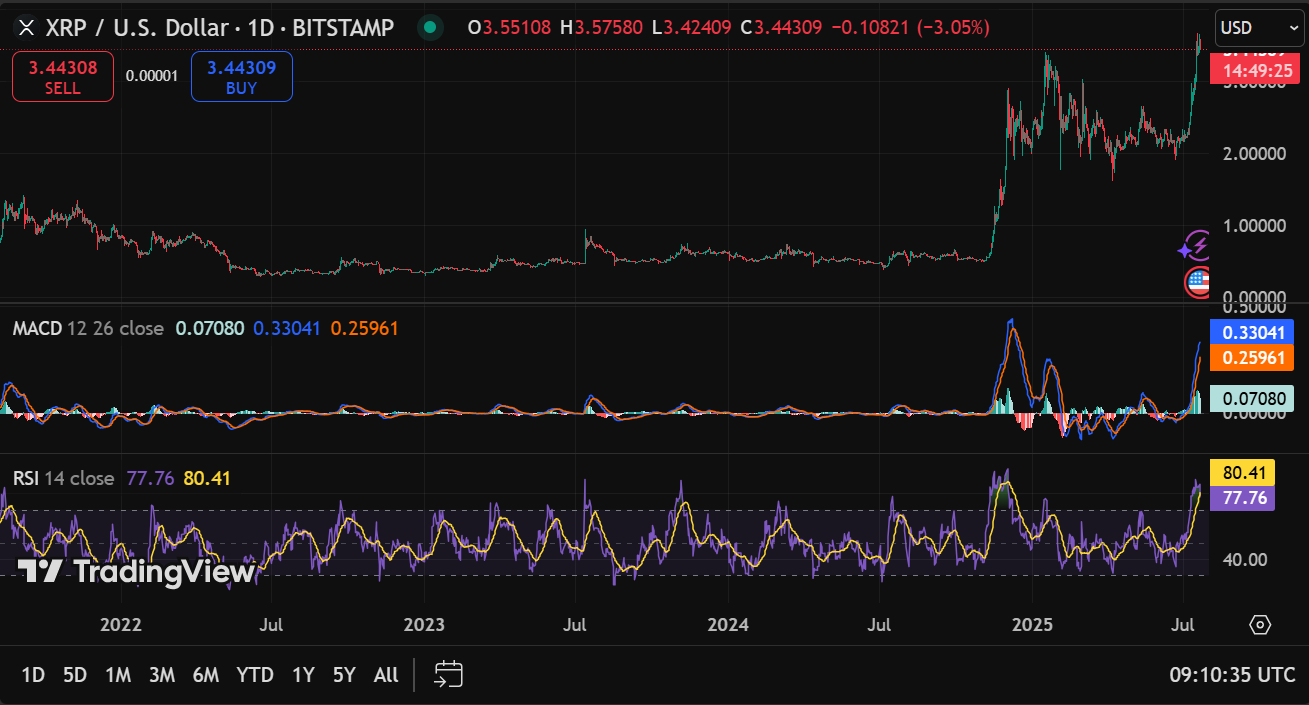
- MACD crossover and high RSI suggest momentum cooling after parabolic surge
- Support at $3.43 holds firm as volume rises 7.15%, indicating active market interest
XRP’s latest rally pushed the token’s market value beyond that of global giants like McDonald’s and American Express, as its market cap briefly climbed past $215 billion. The explosive move came after a 500% gain since July of last year, with XRP reaching a new all-time high of $3.65.
Although the price has since pulled back, XRP’s ascent has reignited investor attention and signaled a powerful shift in crypto asset rankings.
Volatility kicks in after XRP’s new ATH
Over the last 24 hours, XRP’s price remained highly volatile within a tight 6% range. The token opened near $3.57 but dipped below $3.50 during early trading. However, it quickly recovered and spiked to $3.65, before facing resistance and falling sharply to $3.46.
This resistance level at $3.65 now stands as a key barrier to further gains. Meanwhile, $3.55 acted as an intraday median, reflecting a temporary zone of balance between buyers and sellers.
Related: Can XRP Lead the Altcoin Rally in 2025? Analysts’ Insights
The support at $3.43 held firm despite selling pressure. This level may continue to serve as a critical price floor in the near term. If buyers lose this level, however, XRP may face further downside.
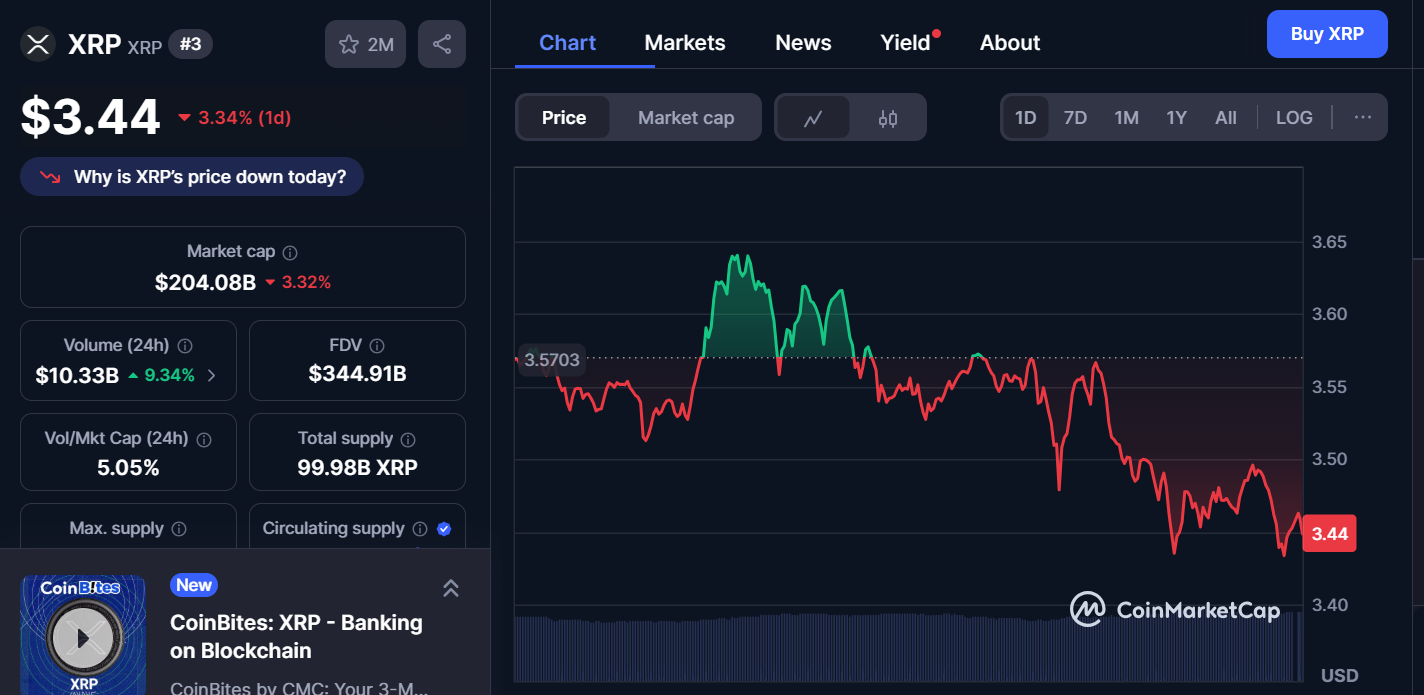
Notably, trading volume increased by 7.15%, signaling heightened market activity. This uptick may have been driven by profit-taking or new entrants buying the dip after the rally.
Momentum Indicators Signal Caution After Parabolic Growth
XRP key indicators signal need for caution
Technical signals point to a cooling momentum despite the recent uptrend. The MACD line has crossed below the signal line, suggesting that bullish momentum may be fading. Although the MACD value remains positive at 0.07170, the narrowing histogram indicates slowing momentum.
Related: XRP Escrow Is Bullish, Not a Dump; and the SEC’s Own Words Prove It
Besides, the Relative Strength Index (RSI) currently sits at 78.69, placing XRP firmly in the overbought zone. The 14-period moving average on the RSI chart shows an even higher reading of 80.47. Such readings often precede short-term corrections or sideways consolidation.
Disclaimer: The information presented in this article is for informational and educational purposes only. The article does not constitute financial advice or advice of any kind. Coin Edition is not responsible for any losses incurred as a result of the utilization of content, products, or services mentioned. Readers are advised to exercise caution before taking any action related to the company.

 Price Prediction for July 23")
 Price Prediction for July 23, 2025")

 Price Prediction for July 23")
