
 Price Prediction for July 25")

After a sharp rejection from the $3,860 mark earlier this week, Ethereum price today is stabilizing just above $3,640. The recent breakdown from its ascending channel has shifted near-term sentiment toward caution, as ETH consolidates beneath several key resistance levels.
What’s Happening With Ethereum’s Price?
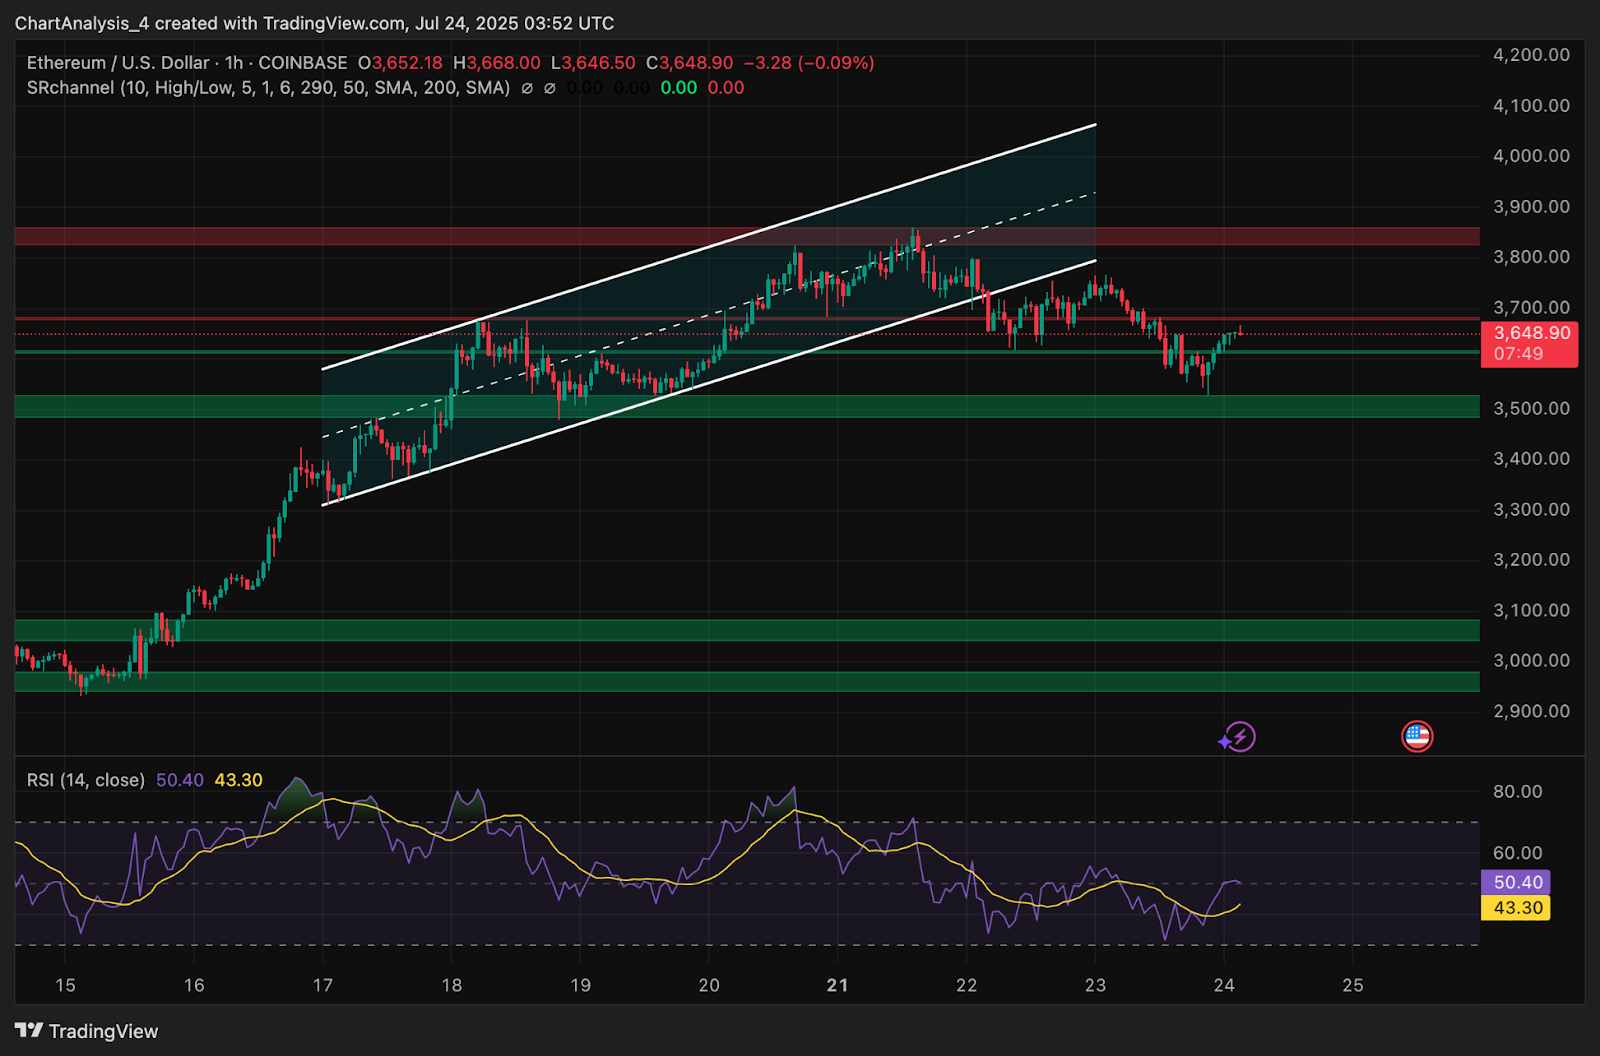
Ethereum recently exited a rising channel that supported its rally from mid-July. After peaking near $3,860, price broke below the channel’s lower boundary and is now retesting prior support as resistance. The 1-hour RSI is recovering slightly near 50.40, suggesting stabilization, but there is still no confirmed trend reversal.
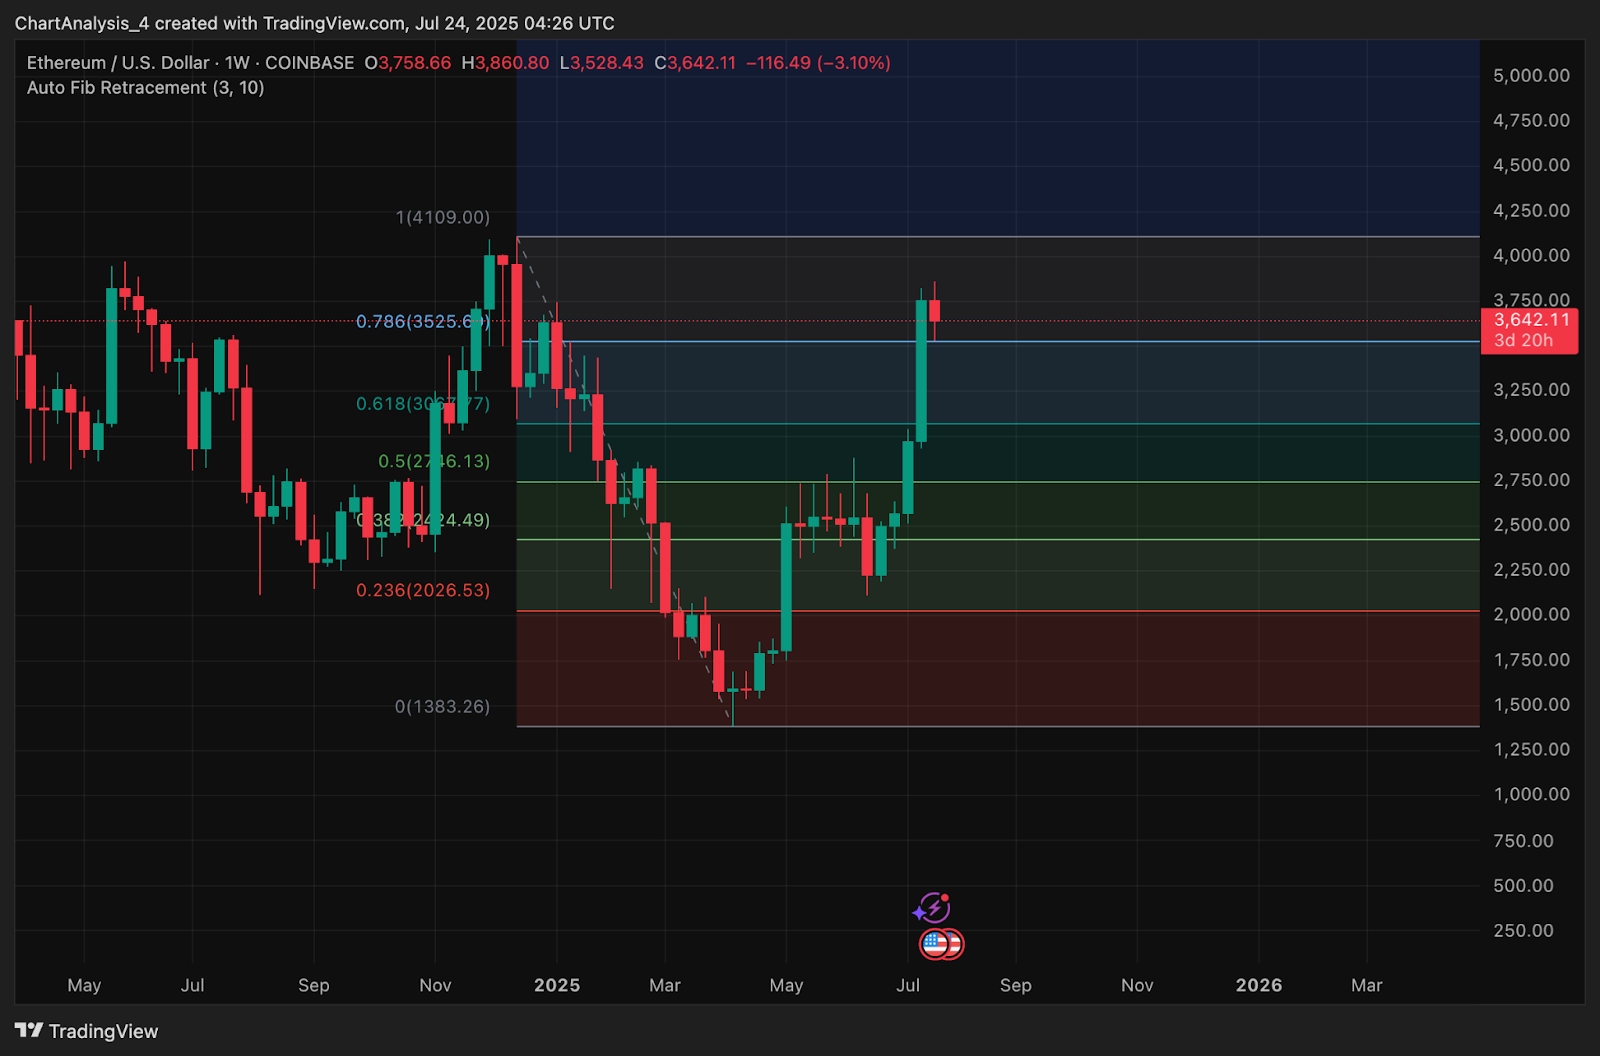
Weekly Fibonacci levels show ETH facing rejection at the 0.786 retracement level around $3,525. While the higher time frame trend remains bullish, this zone now acts as strong resistance until decisively reclaimed.
Why Is The Ethereum Price Going Down Today?
The primary reason why Ethereum price going down today is the failure to hold above the $3,800 zone, where both horizontal resistance and the upper Bollinger Band intersected. That rejection led to a pullback into the $3,600 range.
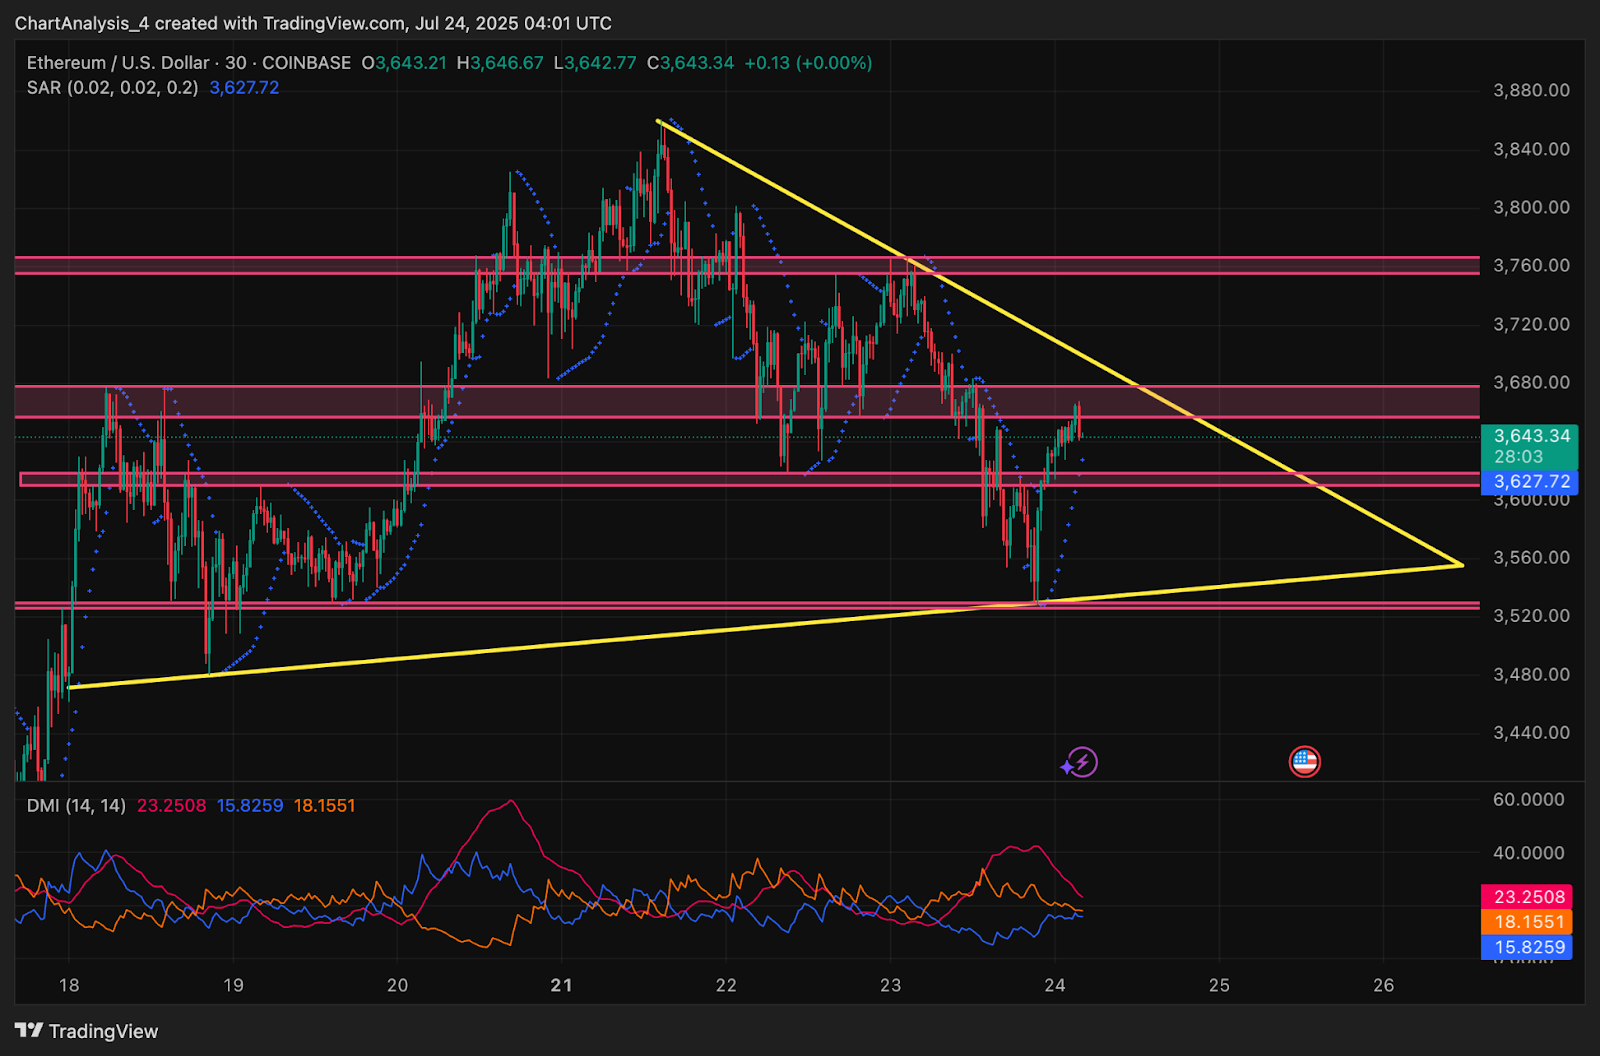
The 30-minute chart shows price forming a symmetrical triangle between $3,560 and $3,700, a pattern that typically resolves with a strong breakout. However, with RSI still neutral and the Parabolic SAR above price, short-term traders remain hesitant.
On the 30-minute timeframe, DMI shows a weak directional bias, with ADX flattening and -DI still above +DI. This confirms consolidation rather than a trending structure. Meanwhile, the Supertrend remains red and flipped bearish near $3,740, reinforcing the need for a breakout to regain bullish control.
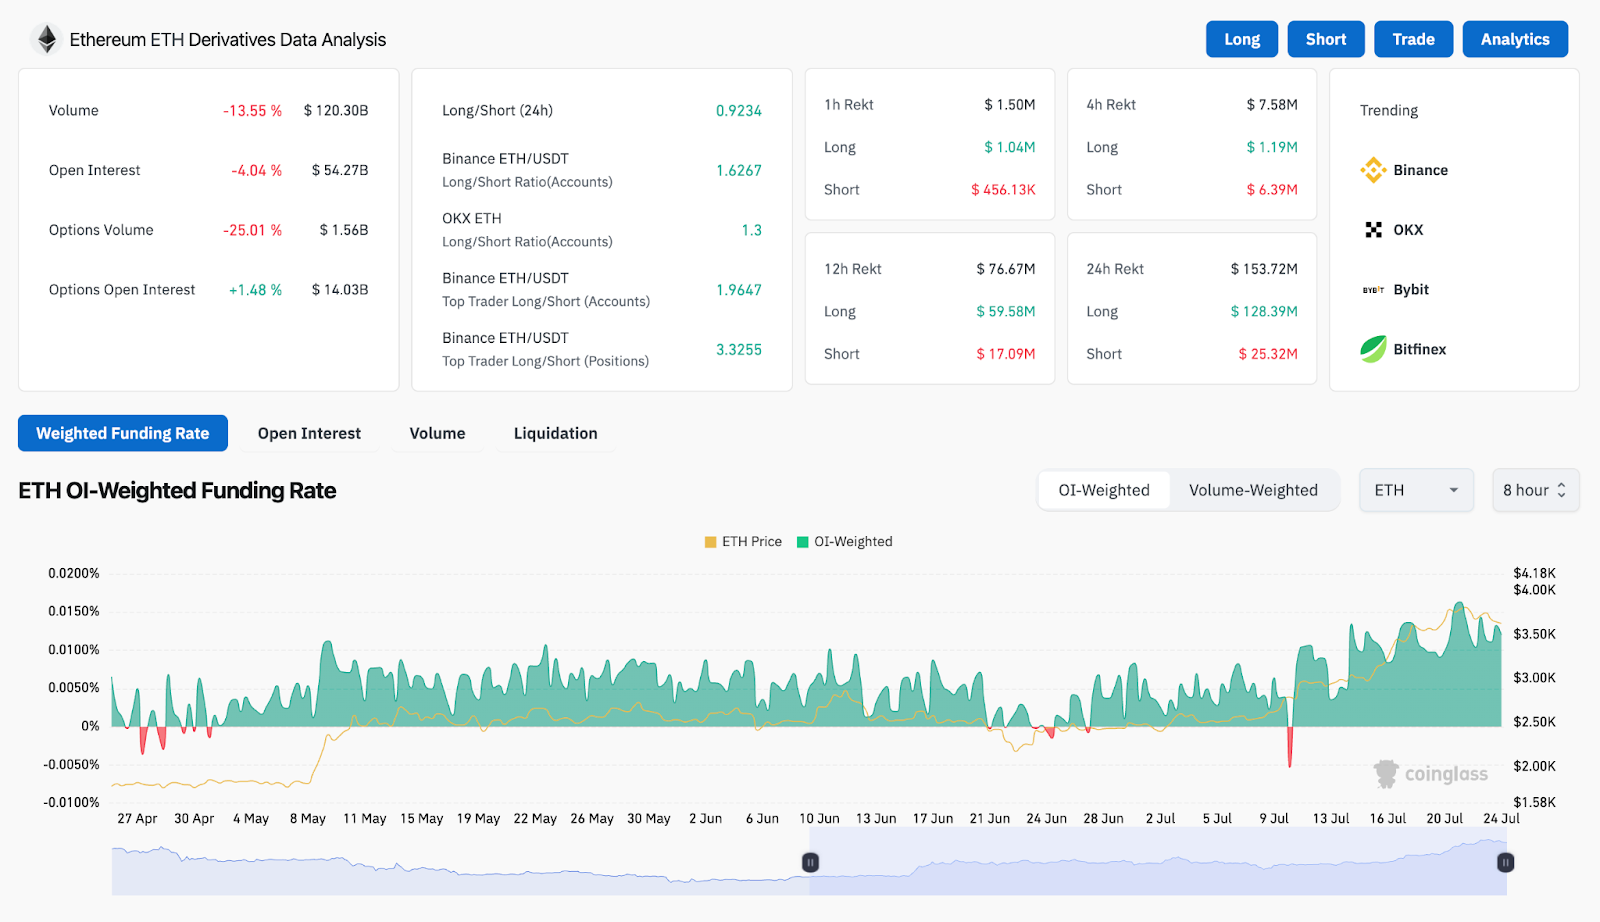
Derivatives data from Coinglass reflects this caution. Volume is down 13.55% to $120.30B, while open interest has dropped by 4.04% to $54.27B. More telling is the 25% fall in options volume, indicating a cooldown in speculative momentum. Despite this, Binance and OKX top trader long/short ratios remain above 1.6, suggesting many still favor upward continuation.
ETH Price Action Signals Resistance Cluster Near $3,700
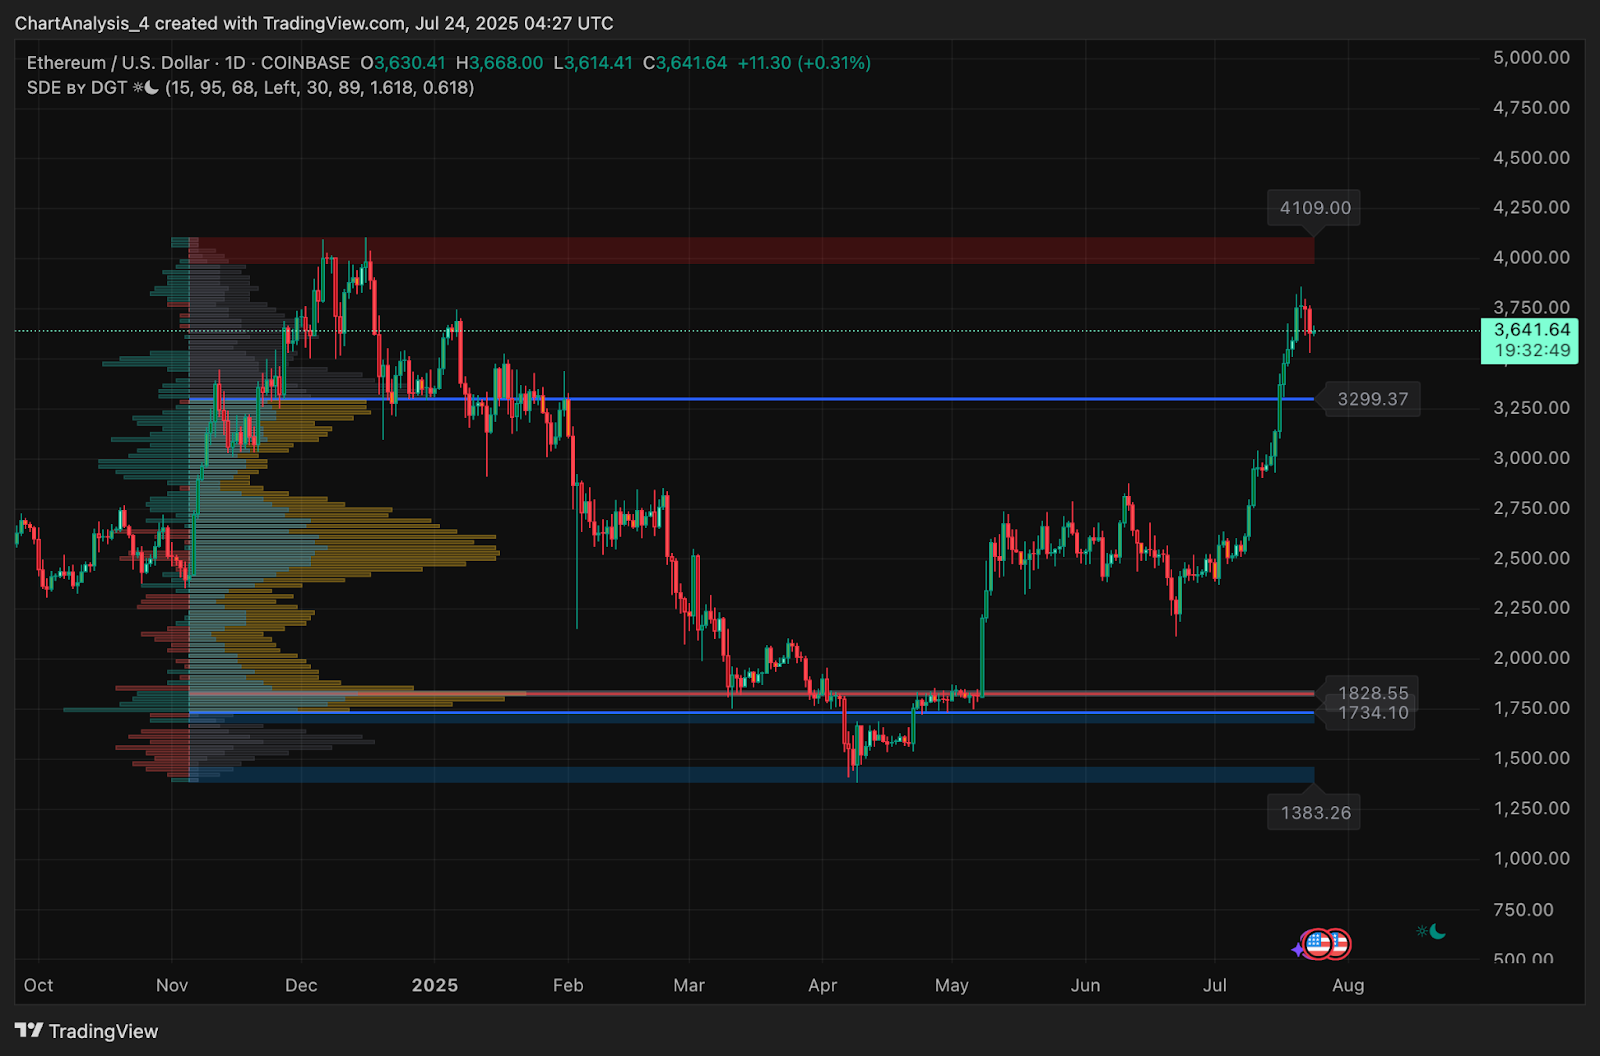
Volume Profile data on the daily chart shows a key Point of Control around $3,299, while ETH is currently floating well above that. However, the highest volume node near $3,800–$3,860 remains a critical rejection zone. Ethereum must break through this to continue its broader trend.
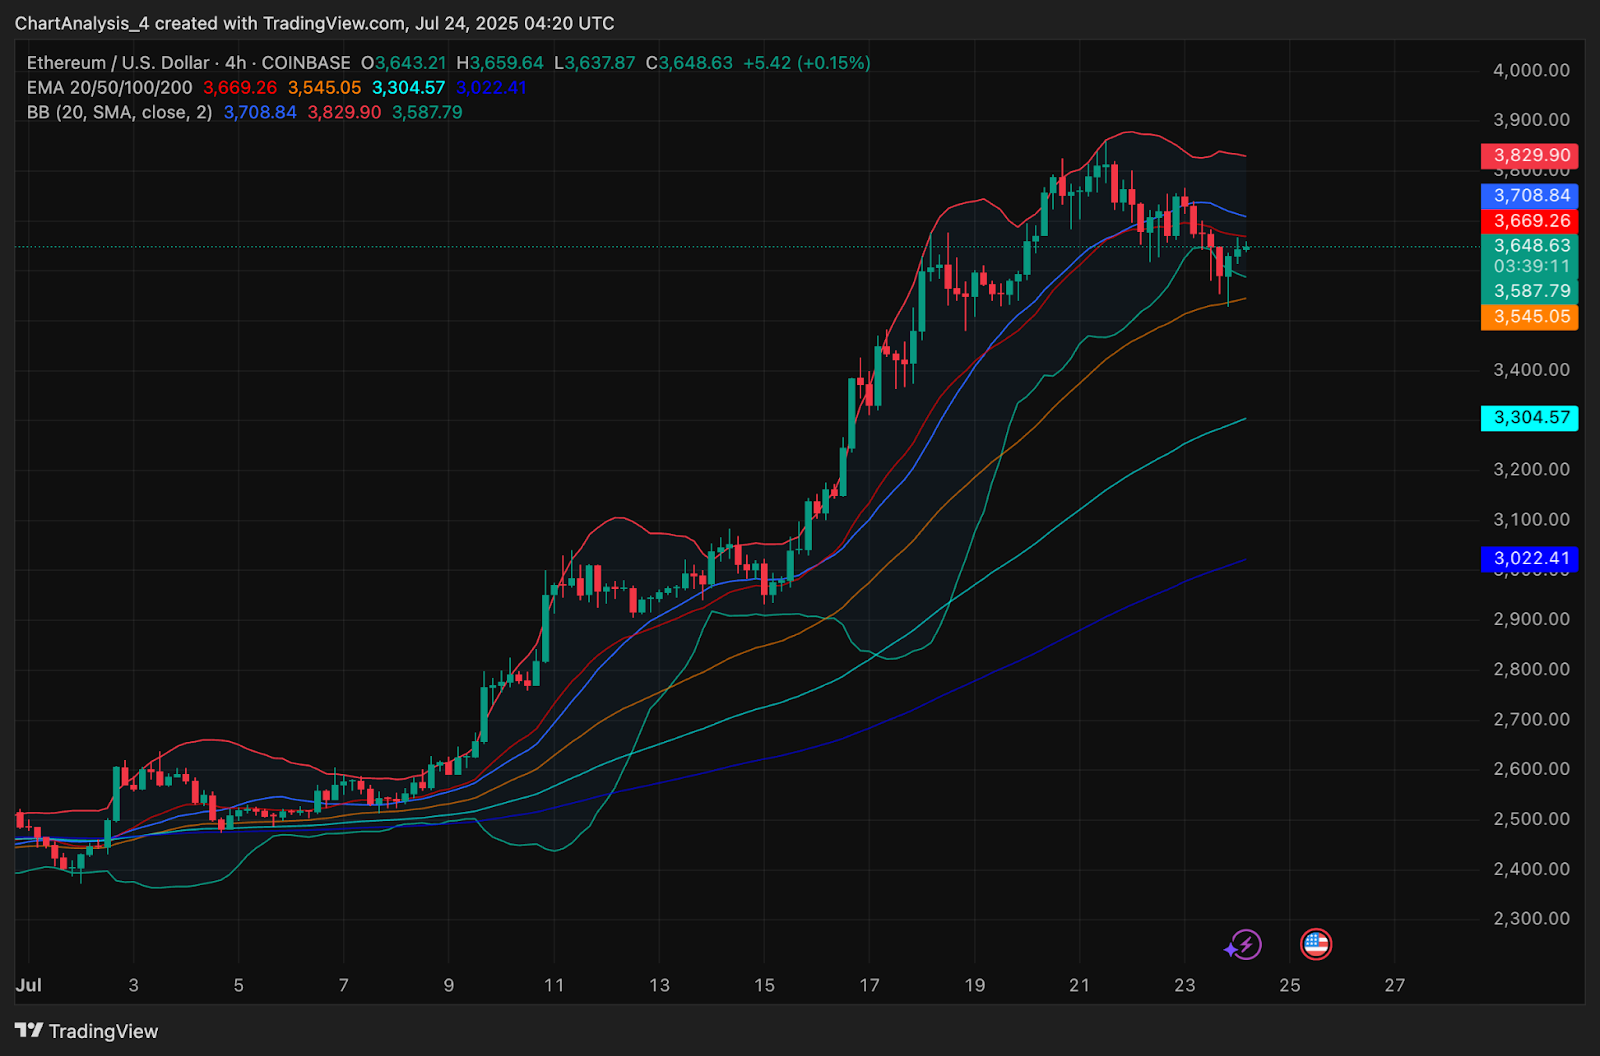
The Bollinger Bands on the 4-hour chart are also starting to compress, and the price is nestled between the midline and lower band. The most immediate resistance lies at $3,708, while support comes in around $3,545 and $3,500.
On the 4-hour chart, Ethereum price is trading just below the 20 EMA at $3,669 and hugging the middle Bollinger Band. The 50 EMA lies at $3,545 and has acted as dynamic support. Candles are tightening between $3,545 and $3,708, hinting at a potential volatility breakout in the next 24 hours.
Ethereum Price Prediction: Short-Term Outlook (24H)
In the short term, Ethereum price is likely to remain range-bound unless a breakout from the symmetrical triangle occurs. A sustained move above $3,708 with volume could push ETH toward $3,830 and then $4,000. If rejected again, bears may drag price down to retest $3,545 and $3,500.
If $3,500 fails to hold, the next demand zone lies at $3,300, where the 100 EMA and high-volume node offer confluence support. As Bollinger Bands and RSI continue to flatten, traders should watch for a decisive breakout above $3,700 or a breakdown below $3,545 to gauge the next trend.
Ethereum Price Forecast Table: July 25, 2025
| Indicator/Zone | Level / Signal |
| Ethereum price today | $3,642 |
| Resistance 1 | $3,708 |
| Resistance 2 | $3,830 |
| Support 1 | $3,545 |
| Support 2 | $3,300 |
| RSI (1H) | 50.40 (Neutral) |
| MACD (4H) | Weak crossover, indecisive |
| Bollinger Bands (4H) | Compressing, volatility contraction |
| Parabolic SAR (30-min) | Above price (Bearish bias) |
| Fibonacci (Weekly 0.786) | $3,525 (Rejected) |
| Supertrend (4H) | Bearish under $3,740 |
| Volume Profile (POC) | $3,299 |
| Derivatives Open Interest | $54.27B (Declining) |
| Options Volume | $1.56B (-25.01%) |
| Binance Top Trader L/S | 3.3255 (Long bias still dominant) |
Disclaimer: The information presented in this article is for informational and educational purposes only. The article does not constitute financial advice or advice of any kind. Coin Edition is not responsible for any losses incurred as a result of the utilization of content, products, or services mentioned. Readers are advised to exercise caution before taking any action related to the company.
 Price Prediction 2025, 2026, 2027-2030")
 Price Prediction 2025–2030")
 Price Prediction 2025, 2026, 2027, 2028-2030")
 Price Prediction for July 26")
 Price Prediction for July 26")
