
 Price Prediction for July 25")

After rejecting from the $0.91 region, Cardano price today has slipped to around $0.79, extending its multi-day decline and breaching a rising channel that supported the June–July rally. The current drop comes amid falling momentum and increasing spot outflows, with ADA now testing the lower bounds of its demand zone. Traders are closely watching whether the $0.75–$0.77 range can offer a near-term bounce or if the breakdown accelerates.
What’s Happening With Cardano’s Price?
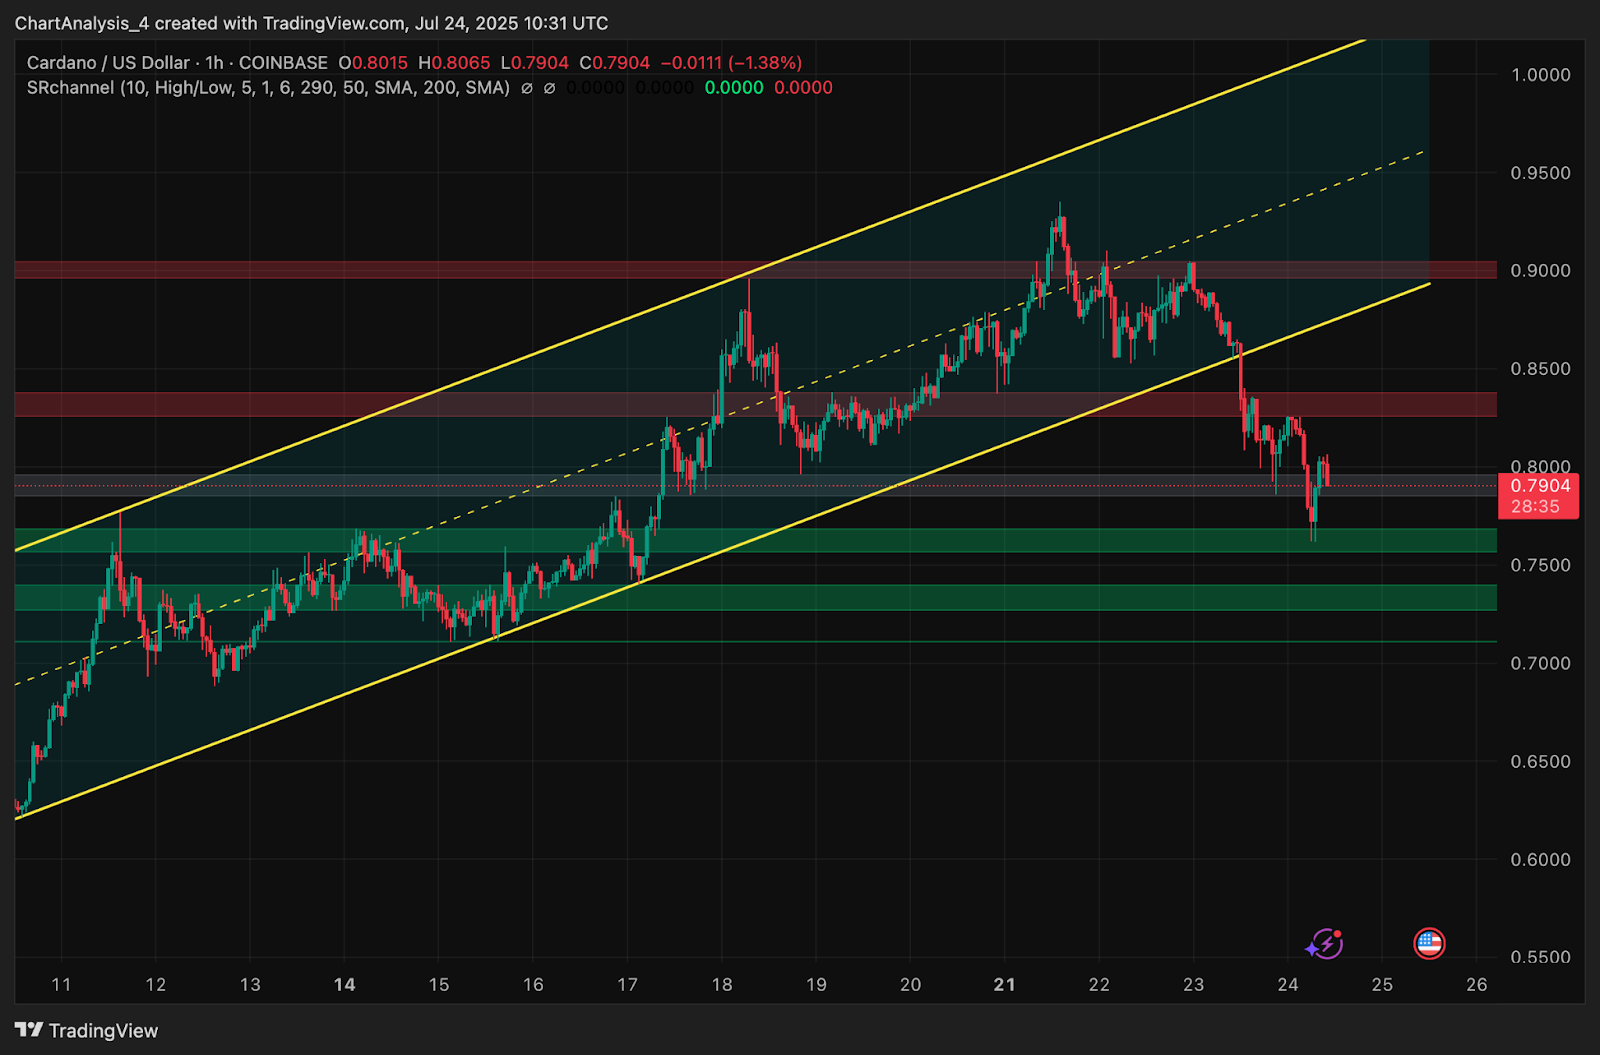
The 1-hour chart shows ADA breaking decisively below its ascending channel support near $0.83 after a clear trend reversal from its July peak. The structure that supported over 40% upside from mid-June is now invalidated, and price has entered a corrective sequence.
Cardano attempted a weak rebound near $0.79 but failed to retake the mid-range resistance zone near $0.81–$0.82. This rejection, coupled with declining highs and lower closes, signals ongoing bearish pressure. Meanwhile, demand clusters between $0.75 and $0.73 remain intact for now but face strong pressure.
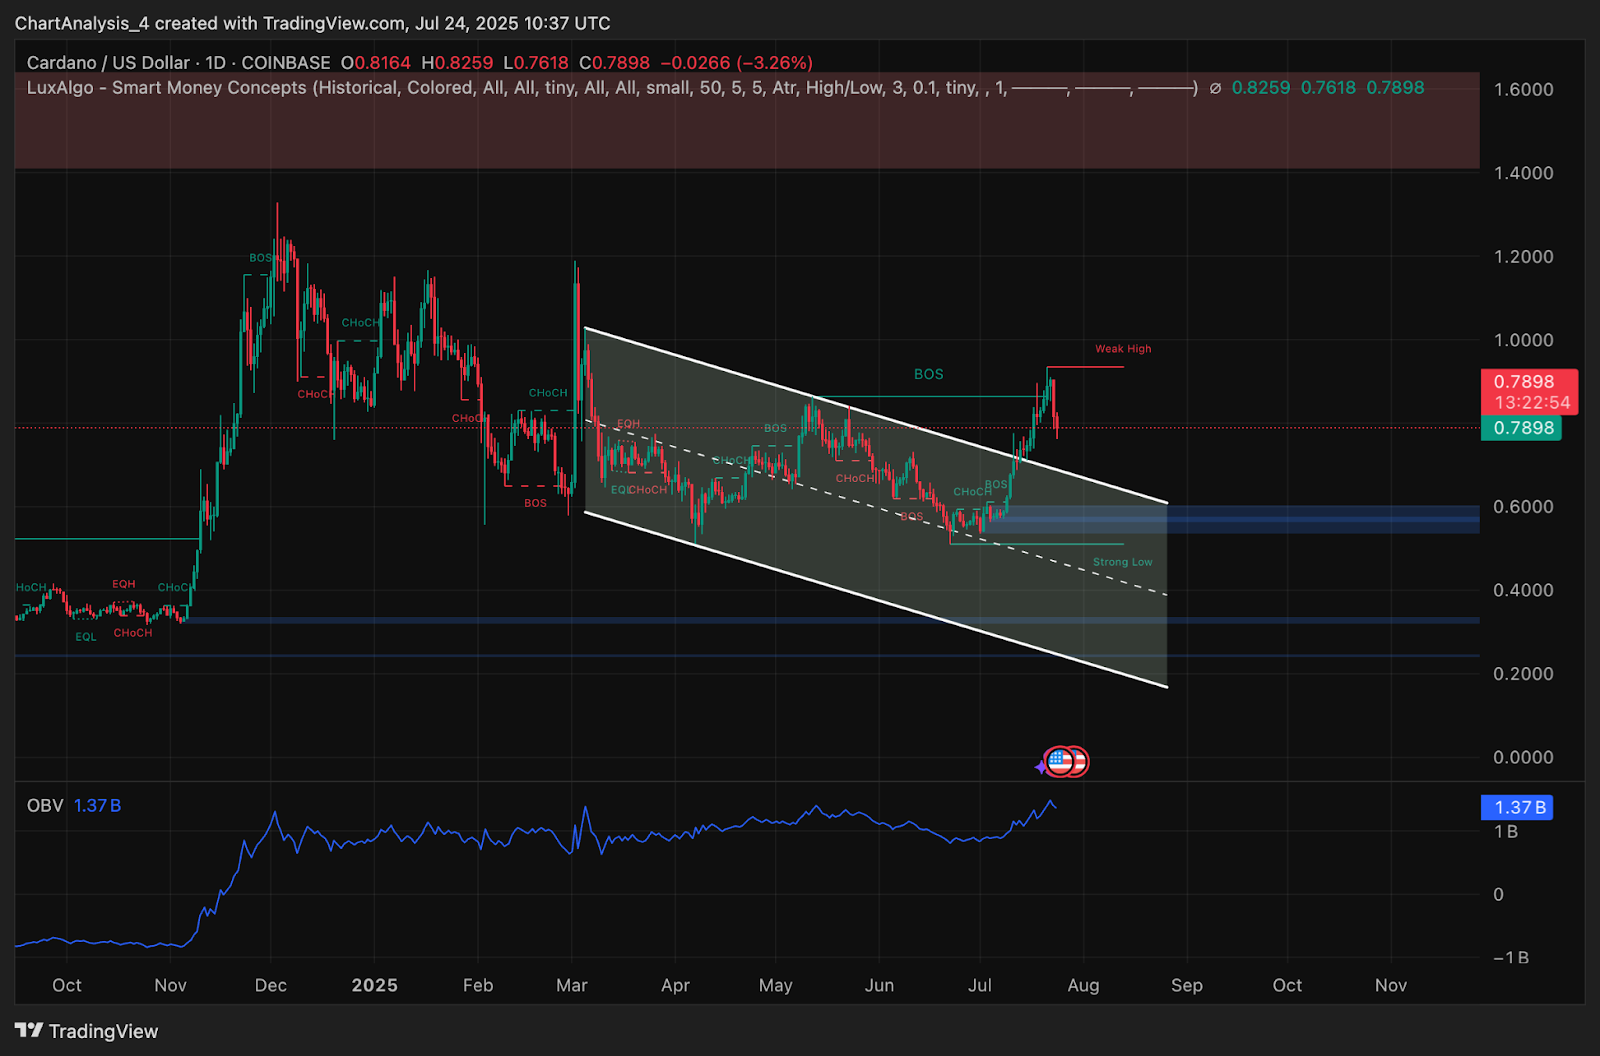
On the daily Smart Money Concepts (SMC) chart, ADA shows a clear break of structure (BOS) above the descending channel earlier this month, but price has since returned below the weak high of $0.91, confirming the bearish rejection. Price now sits just above the former BOS zone near $0.76, which may act as a critical defense area.
Why Is The Cardano Price Going Down Today?
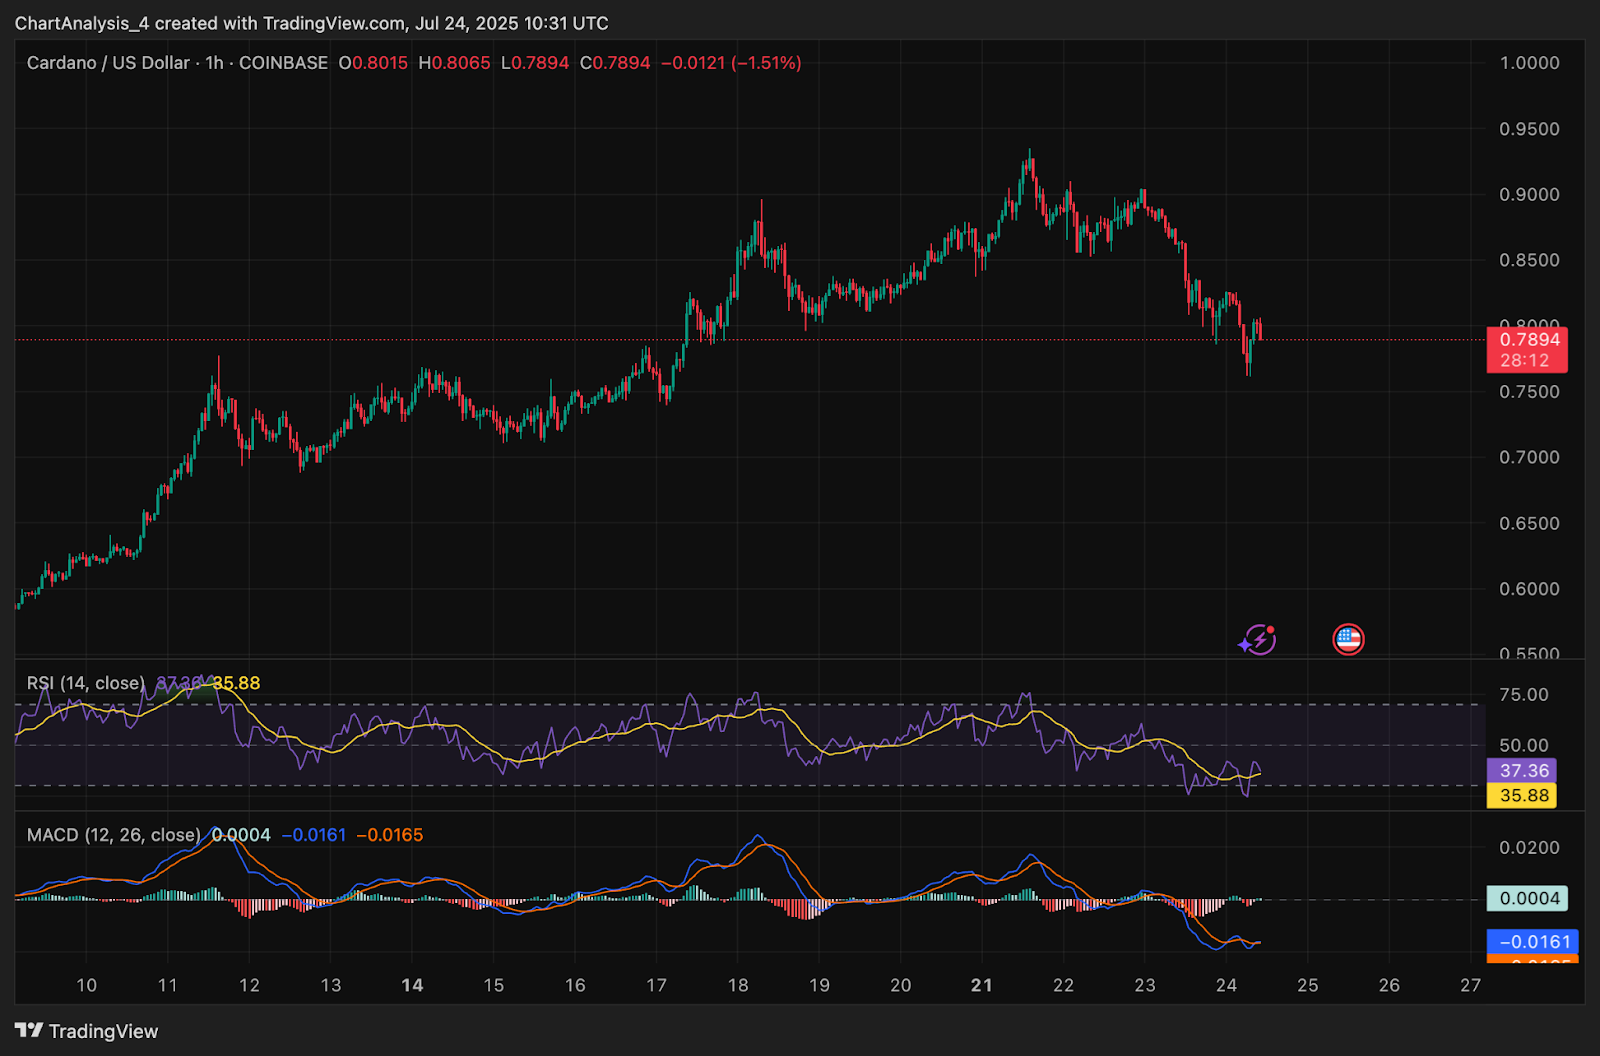
Why Cardano price going down today is tied to multiple bearish catalysts. Firstly, RSI on the 1-hour chart sits at 35.8, showing oversold momentum without any strong bullish divergence. The MACD histogram remains below zero, and the lines are struggling to cross upward, reinforcing the lack of recovery impulse.
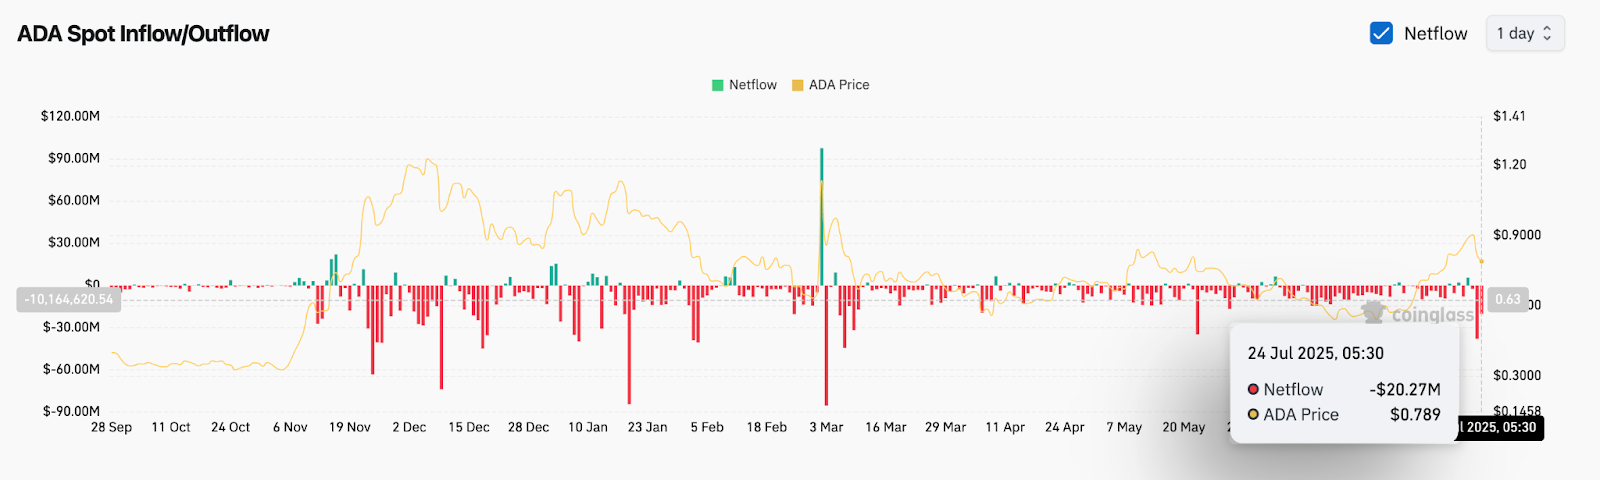
Spot flow data from Coinglass shows a sharp net outflow of over $20.27 million as of July 24, the largest daily outflow since early June. This suggests that investors are pulling liquidity off exchanges and reducing exposure during the dip, which weakens short-term price support.
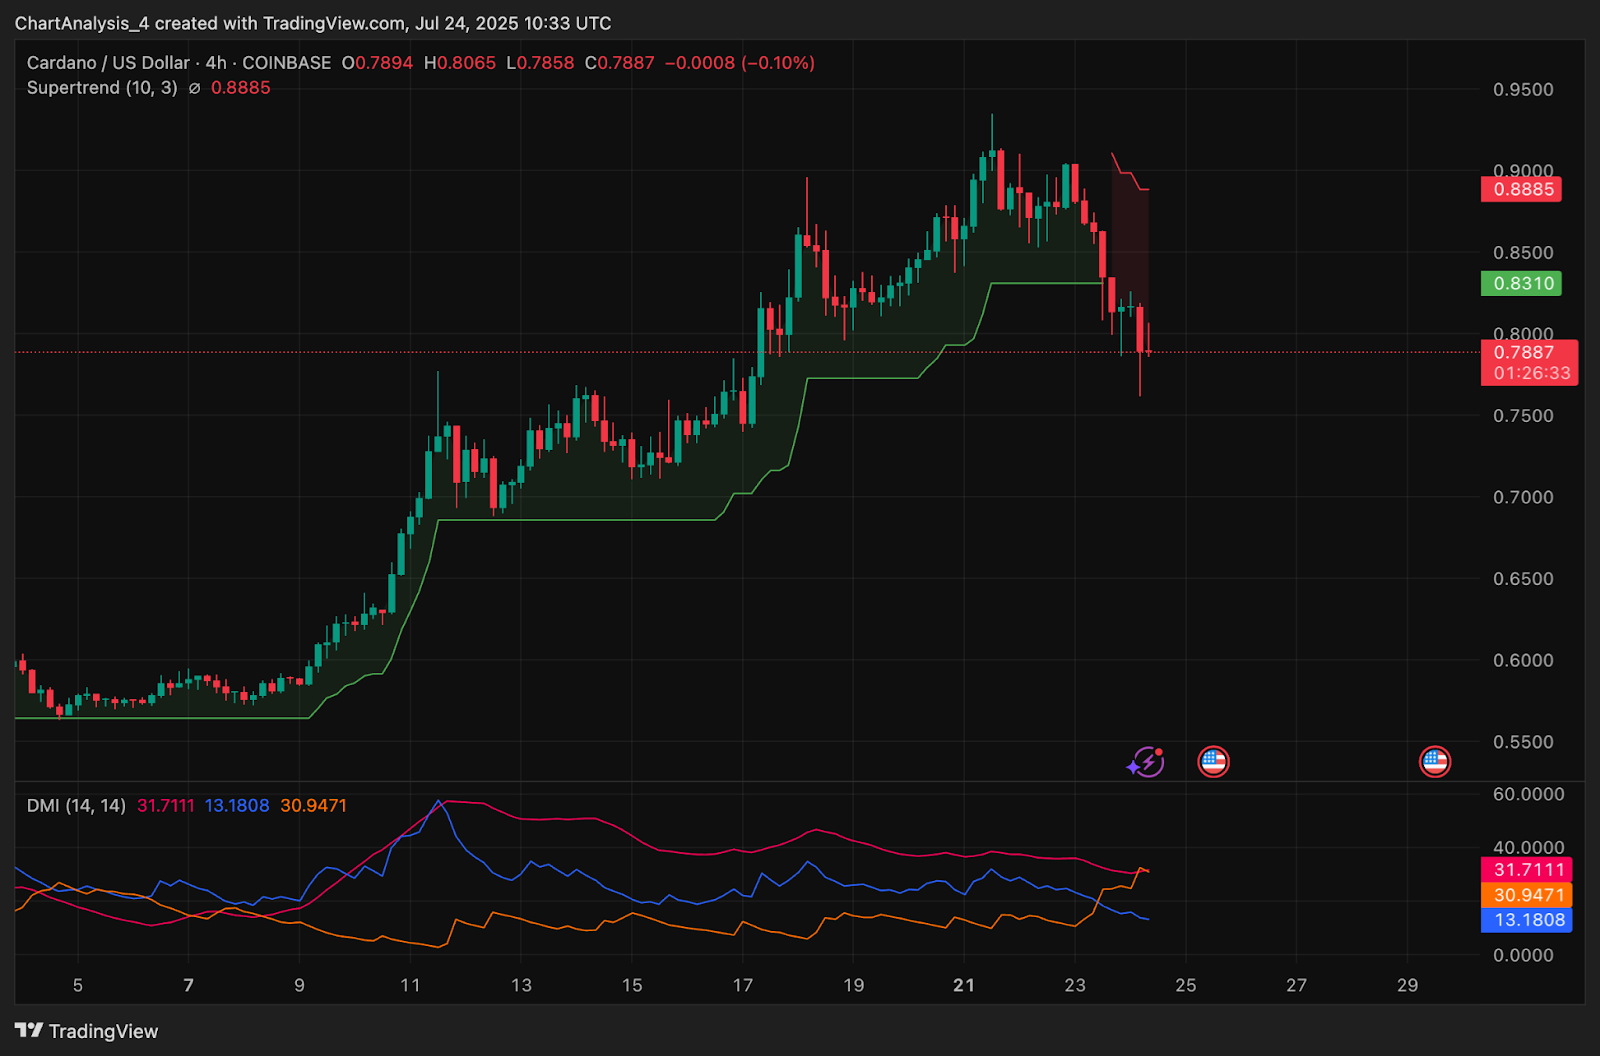
From a trend-based indicator perspective, the 4-hour Supertrend has flipped bearish with a sell trigger at $0.8885. Cardano is also trading below all major EMAs (20/50/100), with the 200 EMA at $0.7187 acting as the next macro support.
Additionally, the Directional Movement Index (DMI) shows -DI crossing above +DI, and ADX rising above 30, signaling strong directional bias to the downside.
ADA Indicators Show Momentum Breakdown and Bearish Control
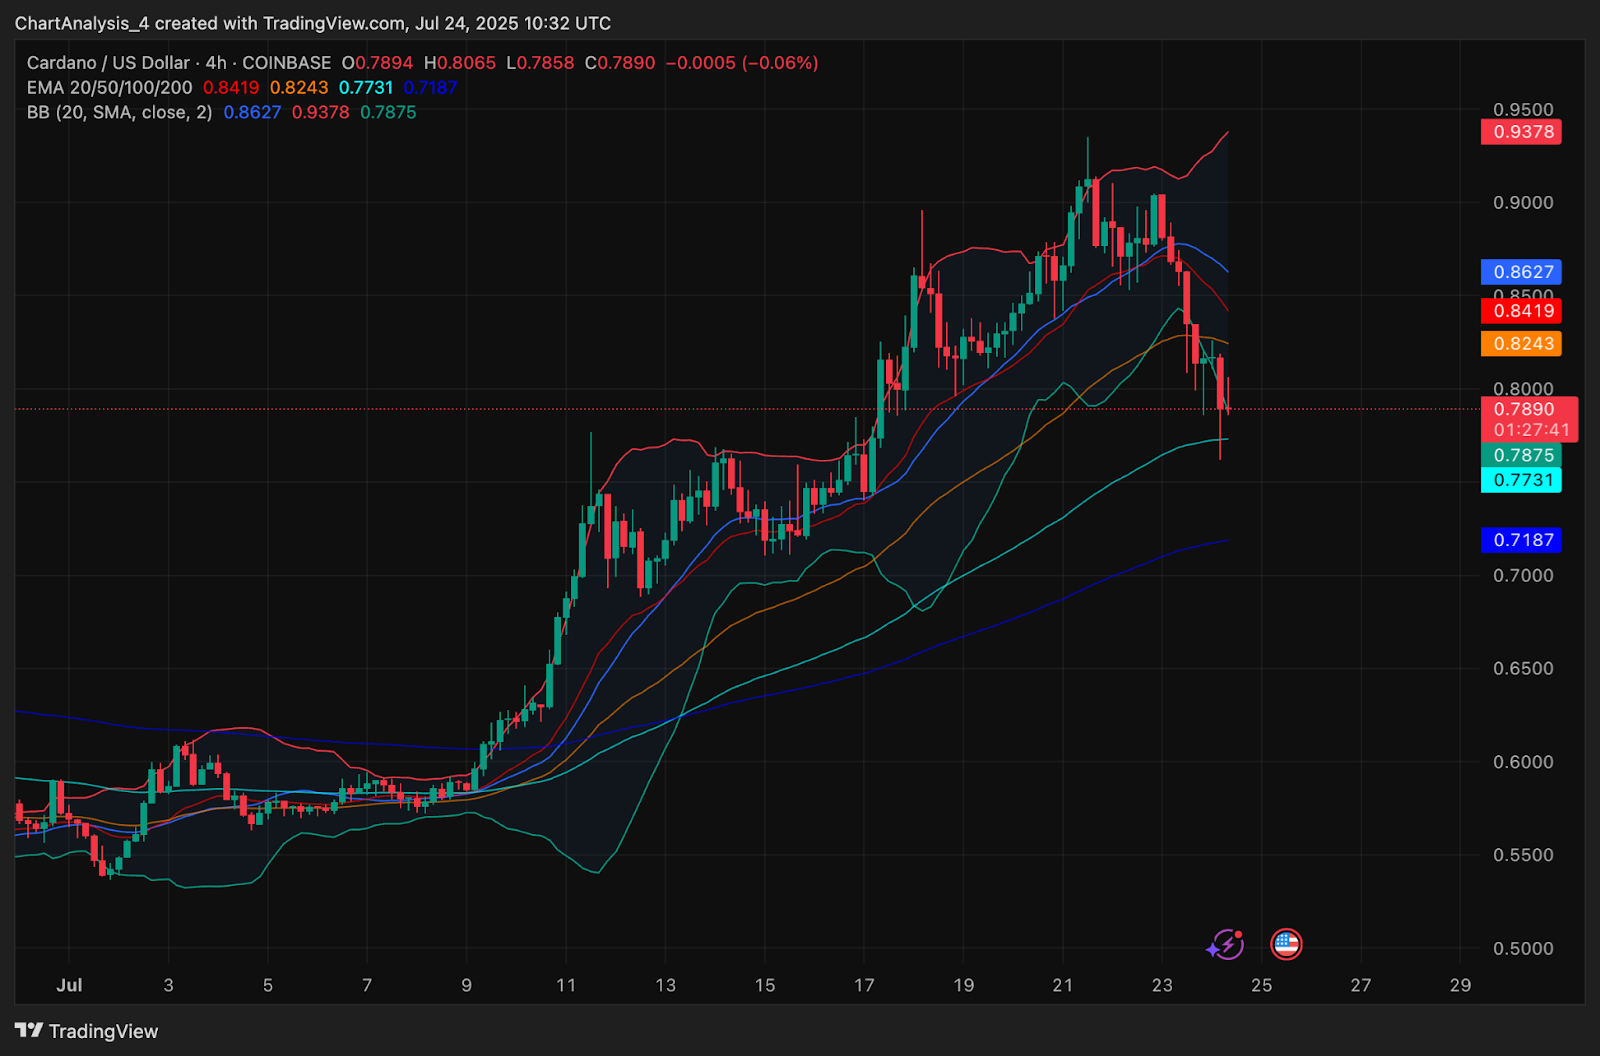
On the 4-hour chart, Bollinger Bands have expanded to the downside, with the price pressing near the lower band at $0.7875. This typically signals continuation of trend rather than reversal. Meanwhile, the EMA 100 and 200 levels at $0.7731 and $0.7187 are the next key zones to watch for buyers.
The OBV (On-Balance Volume) indicator is showing a flattening slope after recent uptrend exhaustion, confirming weakening buy-side conviction. Despite July’s breakout attempt above the long-term descending channel, Cardano has failed to sustain higher highs which is a key bearish sign.
Cardano Price Prediction: Short-Term Outlook (24H)
As long as Cardano price remains below $0.82 and fails to reclaim the former channel structure, bearish pressure will likely persist. The next immediate support zone lies between $0.75 and $0.73, which aligns with previous liquidity zones and the EMA cluster on the 4-hour chart.
If this area breaks, the decline may extend toward $0.71, which also coincides with the 200 EMA and higher timeframe order block. On the upside, a push above $0.8243 (EMA 50) with volume confirmation would be the first sign of reversal.
Given the bearish Supertrend flip, net outflows, and weakening momentum signals, ADA appears vulnerable to further downside unless bulls reclaim control near $0.80–$0.82.
Cardano Price Forecast Table: July 25, 2025
| Indicator/Zone | Level / Signal |
| Cardano price today | $0.789 |
| Resistance 1 | $0.824 |
| Resistance 2 | $0.841 |
| Support 1 | $0.750 |
| Support 2 | $0.718 |
| RSI (1H) | 35.8 (Oversold, weak recovery) |
| MACD (1H) | Bearish, no crossover yet |
| Supertrend (4H) | Bearish below $0.8885 |
| EMA Cluster (4H) | All above price (bearish stack) |
| Bollinger Bands (4H) | Expanded to downside |
| Spot Netflow (24H) | -$20.27M (bearish) |
| DMI (14) | -DI > +DI, ADX > 30 |
| OBV | Flattening |
Disclaimer: The information presented in this article is for informational and educational purposes only. The article does not constitute financial advice or advice of any kind. Coin Edition is not responsible for any losses incurred as a result of the utilization of content, products, or services mentioned. Readers are advised to exercise caution before taking any action related to the company.
 Price Prediction 2025, 2026, 2027-2030")
 Price Prediction 2025–2030")
 Price Prediction 2025, 2026, 2027, 2028-2030")
 Price Prediction for July 26")
 Price Prediction for July 26")
