
 Price Prediction for July 26")

The Bitcoin price today is trading near $115,600 after a sharp intraday decline that pierced below the lower boundary of the descending channel on the 4-hour chart. This move also broke through the key ascending trendline support that had held since early July, raising concerns of a potential trend shift as momentum stalls.
What’s Happening With Bitcoin’s Price?
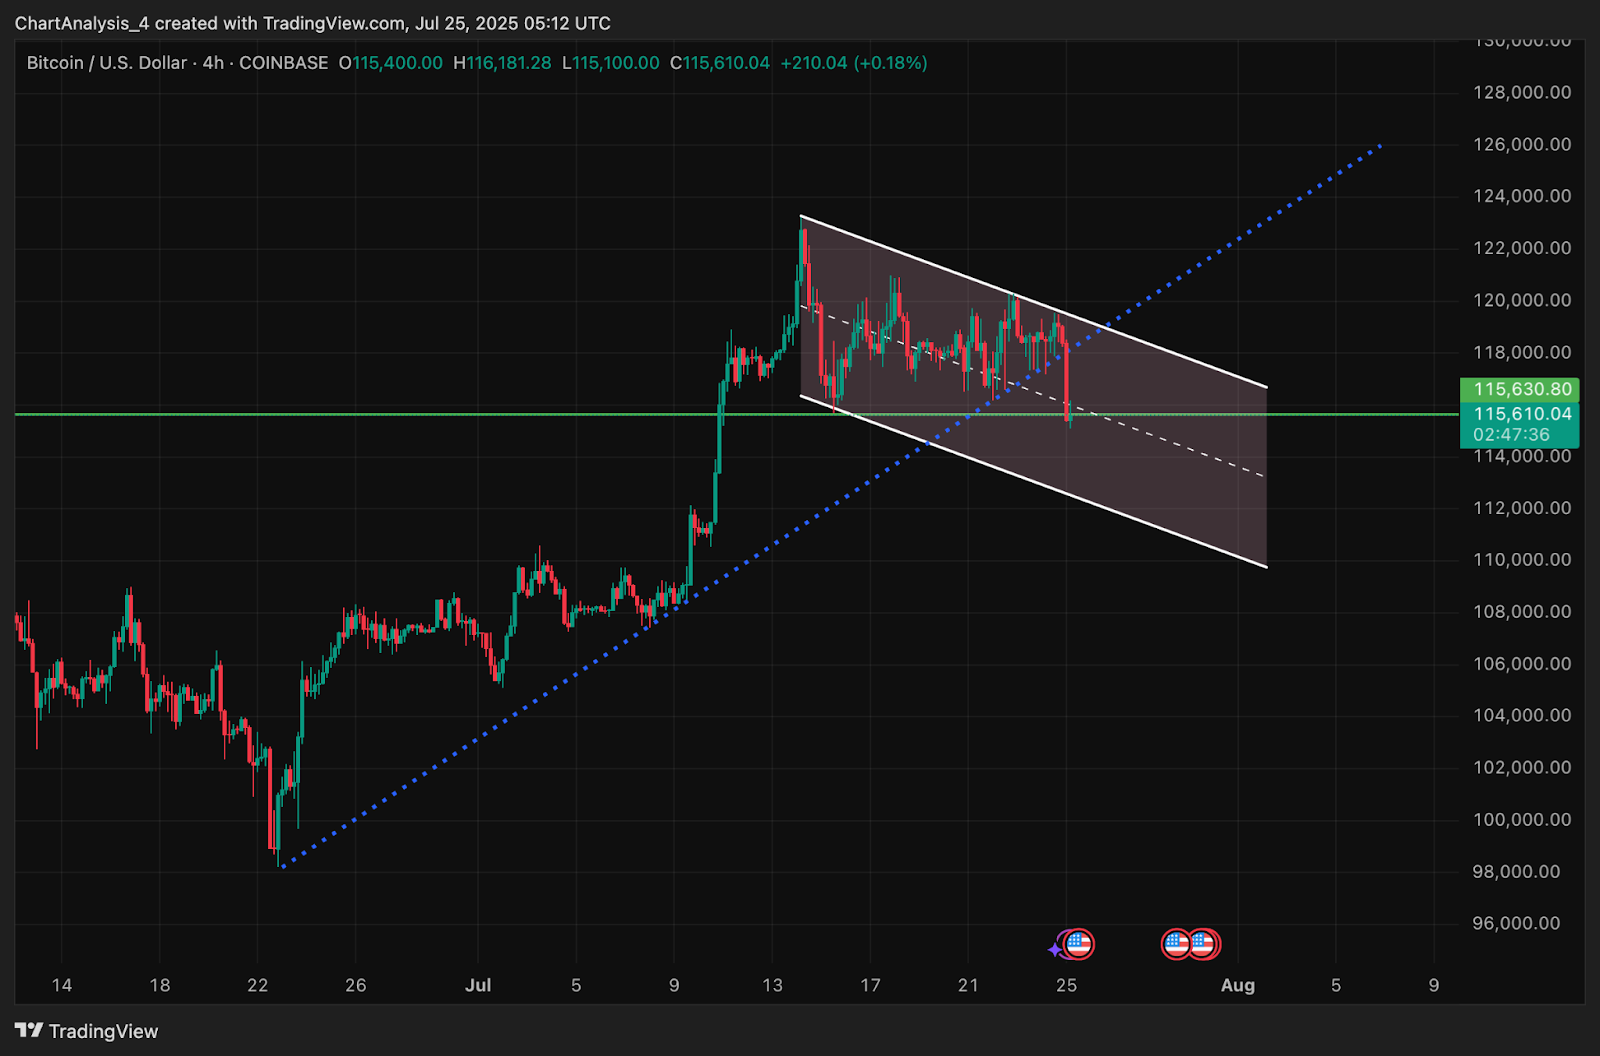
On the 4-hour chart, Bitcoin price action had been coiling inside a descending parallel channel since mid-July. The recent breakdown below $116,000 suggests the bears are attempting to seize control after multiple failed bullish attempts near the $118,800 to $119,200 resistance area. Price has now deviated below the lower bound of the channel and closed under the dotted ascending trendline that previously supported every major bounce this month.
This breakdown appears significant, especially given the rejection from the midline of the channel earlier this week and the sharp bearish engulfing candle printed after that. If the daily close confirms below $115,300, sellers may push price into deeper liquidity pockets toward $113,000 or lower.
Why Is The Bitcoin Price Going Down Today?
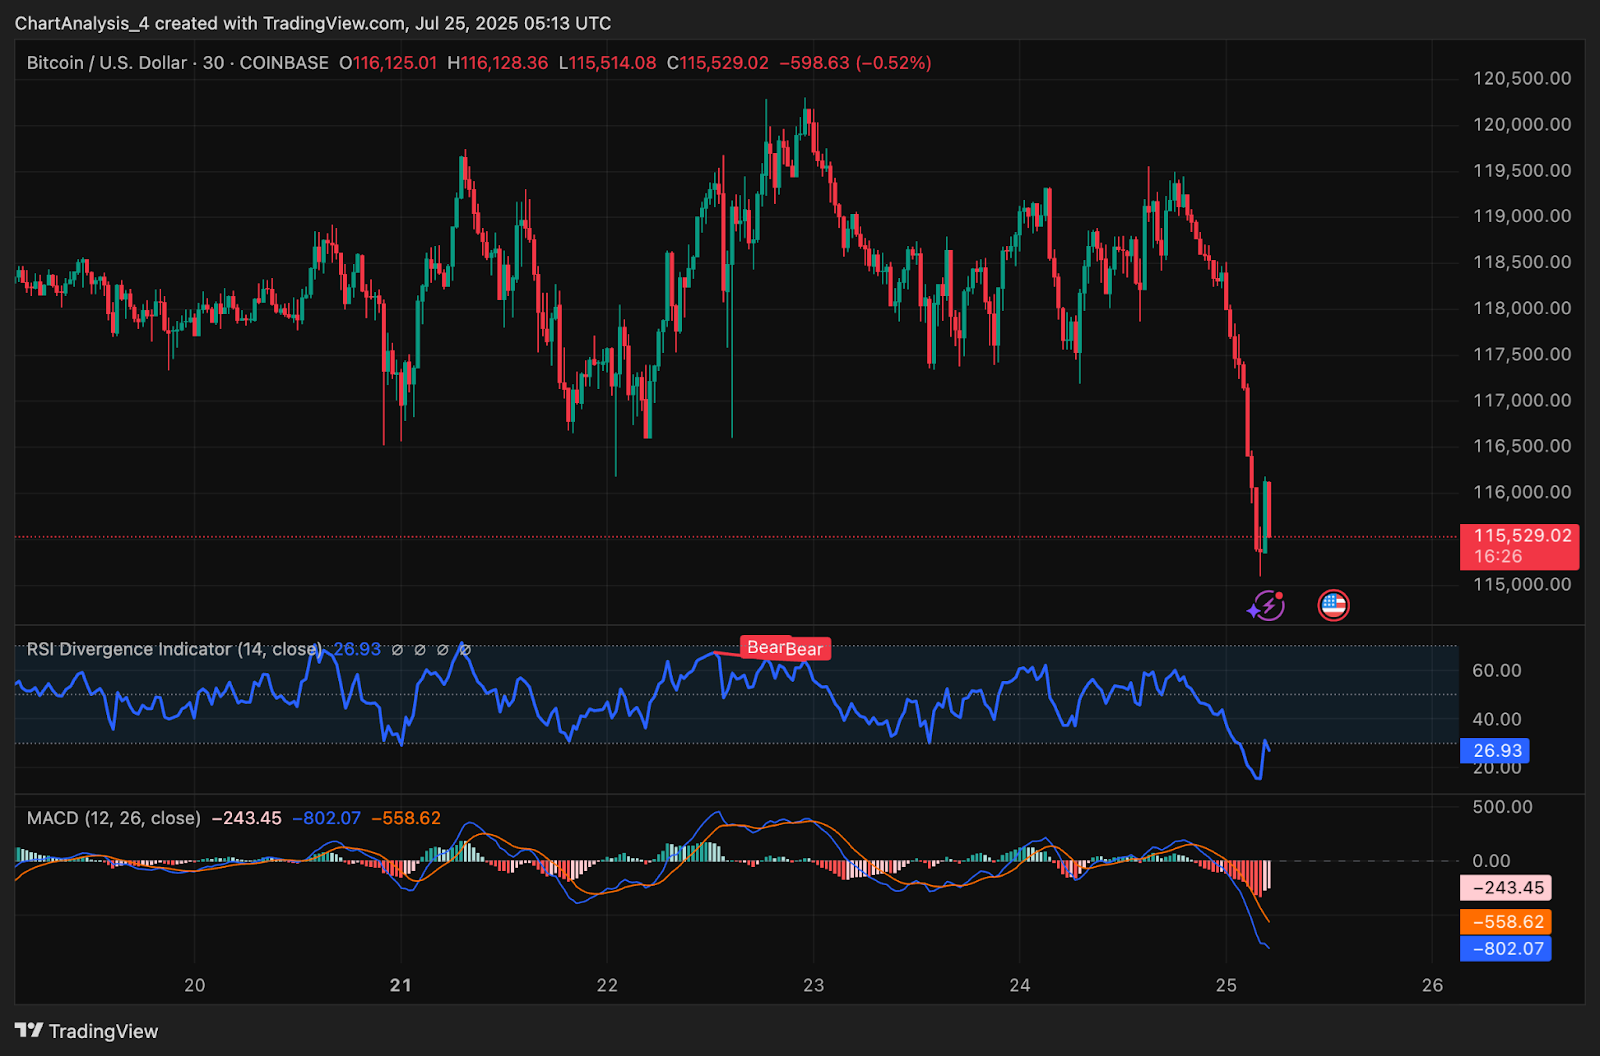
The main reason why Bitcoin price going down today stems from clear bearish divergences and exhaustion signals visible on lower timeframes. On the 30-minute chart, RSI collapsed to 26.9, firmly in oversold territory, while MACD continues expanding negatively with both signal lines trending deeper below zero, indicating building bearish momentum.
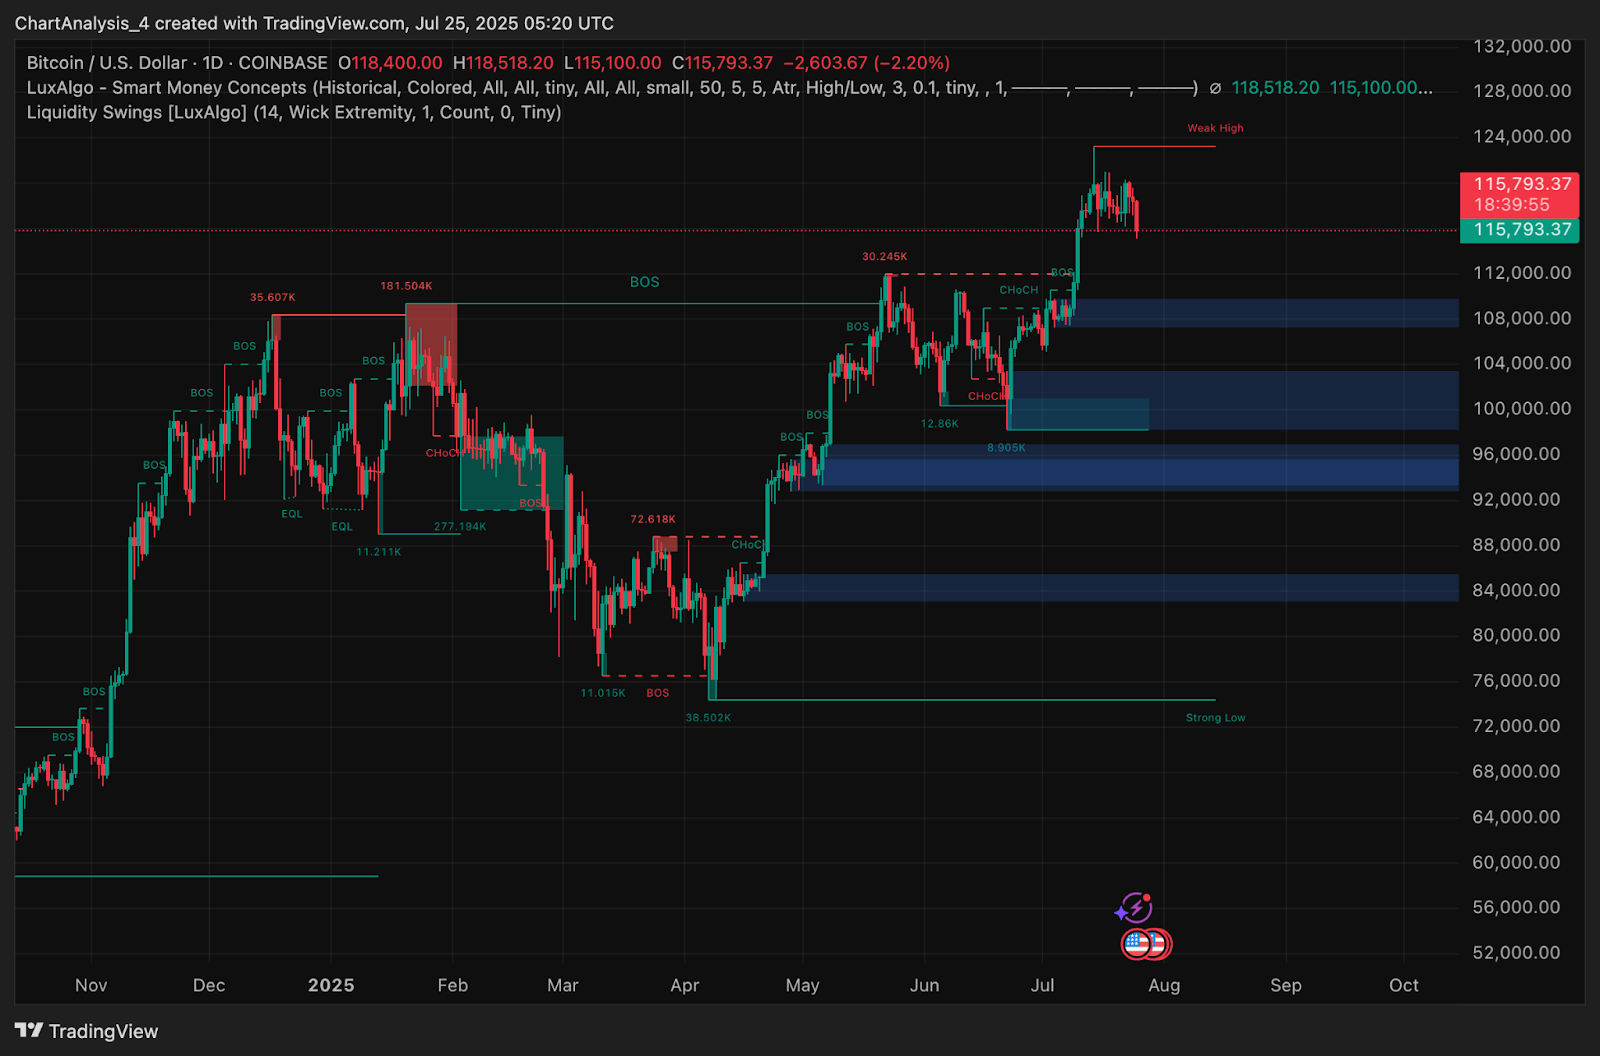
Adding pressure, the Smart Money Concept chart on the 1-day timeframe shows that BTC rejected a weak high near $118,500 and is now pulling back toward a previous Break of Structure zone between $112,000 and $113,500. This region previously acted as a demand pocket and could now serve as the next target if sellers maintain control.
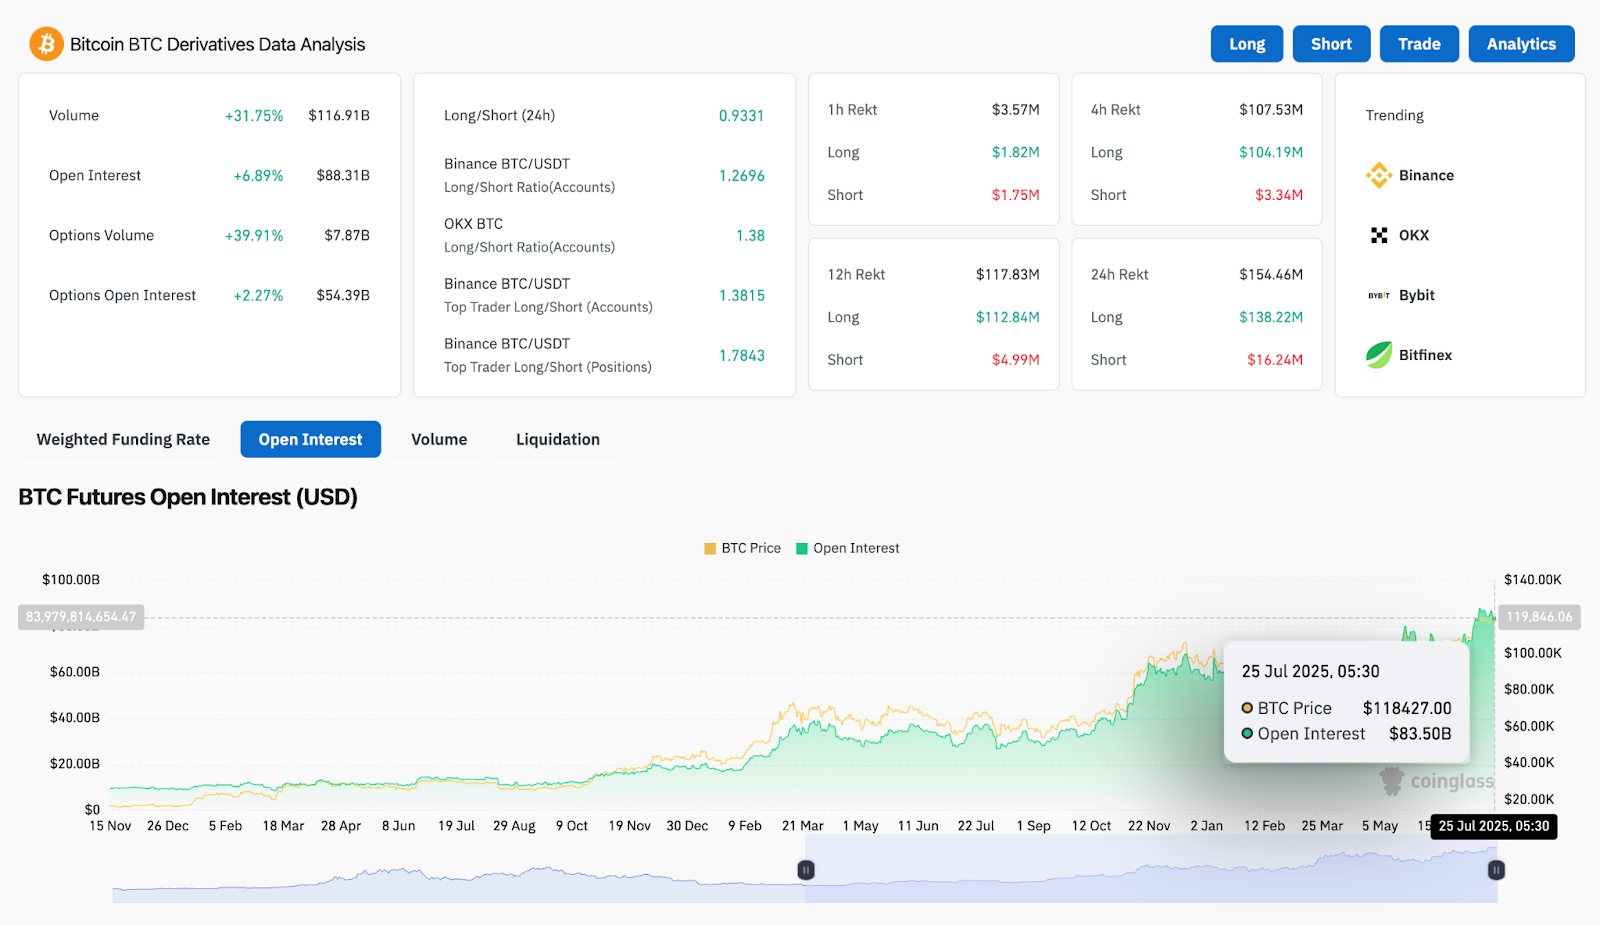
Derivatives data confirms the shift. While volume jumped 31.75 percent and open interest surged 6.89 percent to $88.3 billion, the long/short ratio fell to 0.933, a clear sign that shorts dominated the past 24 hours. Liquidations topped $154.4 million, with $138.2 million in long positions wiped out, indicating a large-scale flush of leveraged longs contributed to today’s move.
Bollinger Bands and EMA Structure Signal Volatility Spike
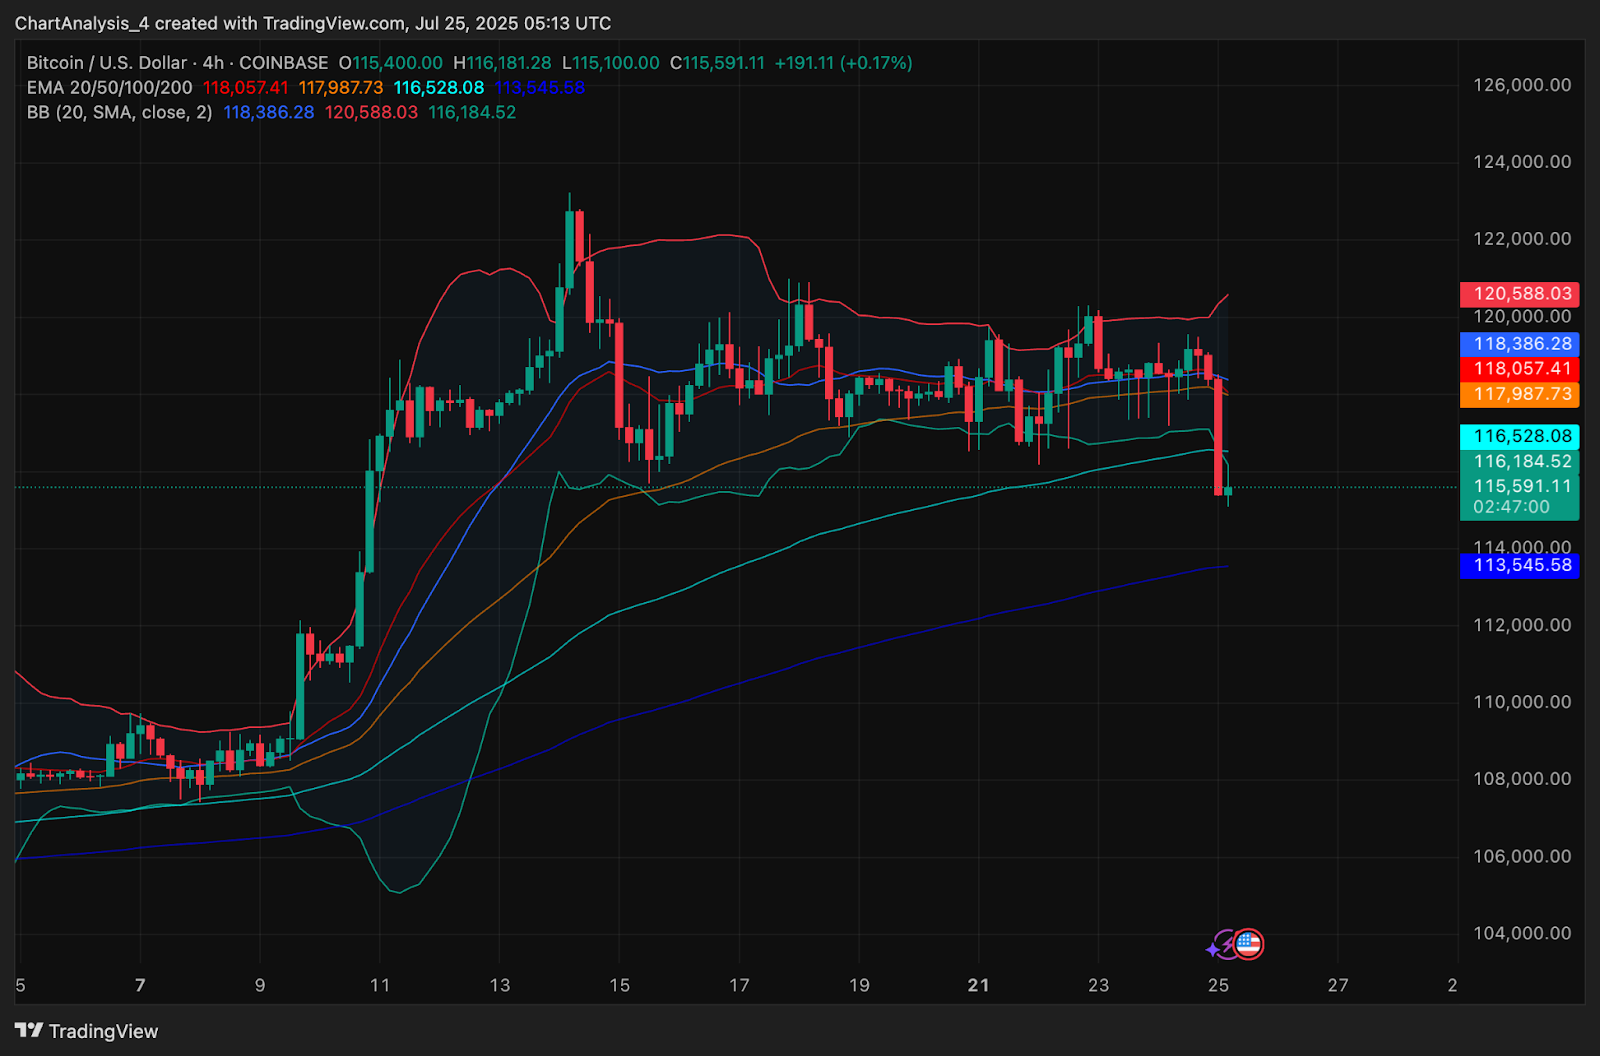
The 4-hour Bollinger Bands have rapidly expanded as Bitcoin price volatility increased sharply. After days of compression, price broke below the lower band at $116,100 and briefly touched $115,100 before attempting a mild rebound. Such volatility expansion usually follows a range-bound phase and confirms the onset of a new directional move.
Meanwhile, the 20, 50, and 100 EMAs are now starting to curve downward, with the 100 EMA at $116,528 and 200 EMA near $113,545 serving as critical levels. BTC is currently trading below all of them, signaling a short-term bearish shift. Unless bulls reclaim the EMA cluster above $117,000, upside moves will likely face strong resistance.
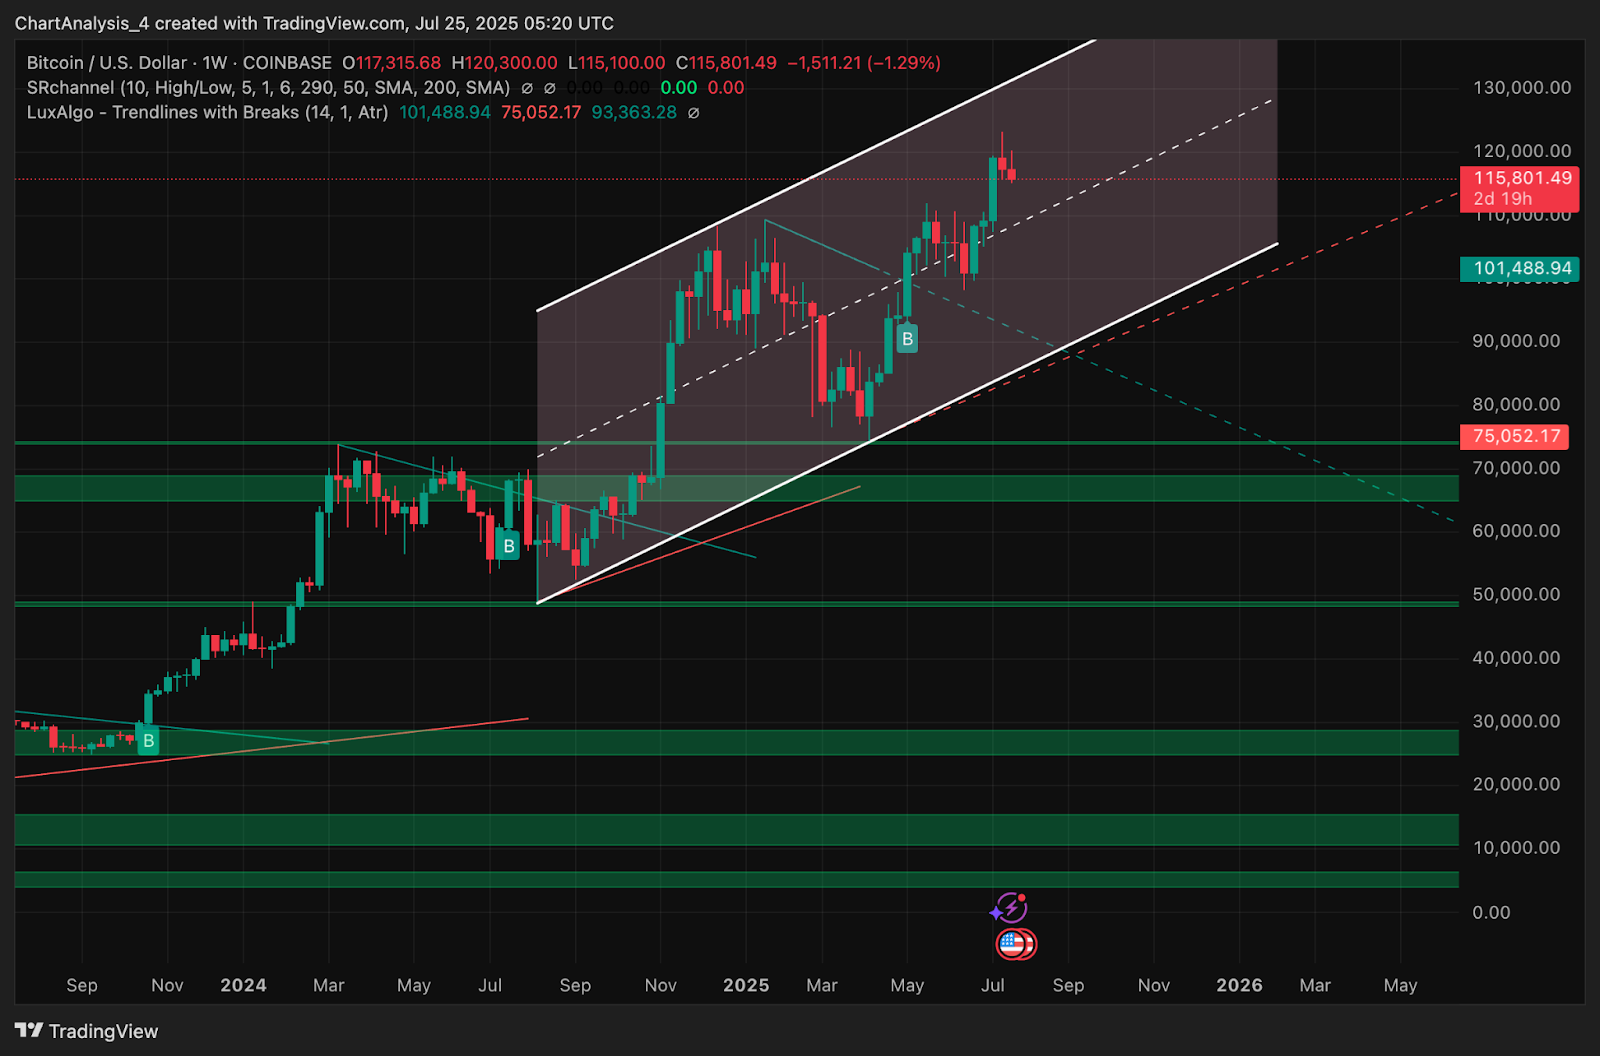
On the weekly timeframe, Bitcoin still holds inside a rising channel, but the rejection near $120,300 last week and this week’s red candle suggest the upper channel resistance may have held firm. A deeper pullback toward the median line near $110,000 remains possible if daily structure fails to recover soon.
BTC Price Prediction: Short-Term Outlook (24H)
If Bitcoin price today fails to bounce decisively above $116,200, the breakdown could extend toward $113,500, where the 200 EMA and prior demand zone overlap. Below this, the next target sits around $112,000 to $111,000, marked by the daily BOS liquidity cluster.
To regain bullish momentum, BTC must recover above the $116,800 to $117,200 EMA zone and re-enter the descending channel. A sustained move above $118,000 would open doors for a retest of $119,500 and the recent high at $120,300.
However, given the current bearish momentum in both volume and momentum indicators, traders should watch for confirmation of support near $113,500 before attempting long setups.
Bitcoin Price Forecast Table: July 26, 2025
| Indicator / Zone | Level / Signal |
| Bitcoin price today | $115,600 |
| Resistance 1 | $116,800 (lower EMA cluster) |
| Resistance 2 | $118,000 (prior mid-channel) |
| Resistance 3 | $120,300 (weekly high) |
| Support 1 | $113,545 (200 EMA 4H) |
| Support 2 | $112,000 (daily BOS zone) |
| RSI (30-min) | 26.9 (oversold) |
| MACD (30-min) | Deep bearish expansion |
| Bollinger Bands (4H) | Expanding, price below lower band |
| EMA Cluster (20/50/100, 4H) | All above price, bearish alignment |
| SMC Zone | CHoCH near $118,500 |
| Weekly Trend Channel | Still intact, but upper bound rejected |
| Derivatives Volume | 31.75 percent, $116.9B total |
| Long/Short Ratio (24h) | 0.9331 (short-biased) |
| Long Liquidations (24h) | $138.2M |
Disclaimer: The information presented in this article is for informational and educational purposes only. The article does not constitute financial advice or advice of any kind. Coin Edition is not responsible for any losses incurred as a result of the utilization of content, products, or services mentioned. Readers are advised to exercise caution before taking any action related to the company.
 Price Prediction 2025, 2026, 2027-2030")
 Price Prediction 2025–2030")
 Price Prediction 2025, 2026, 2027, 2028-2030")
 Price Prediction for July 26")

