
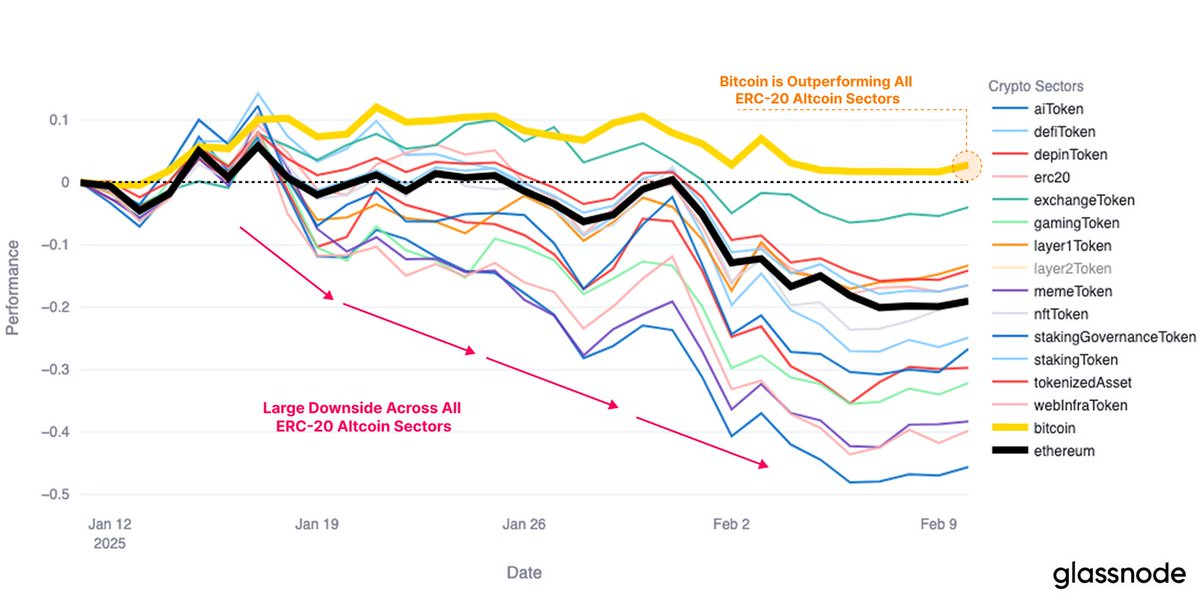
- Bitcoin has maintained resilience, outperforming altcoins, mainly ERC-20 tokens.
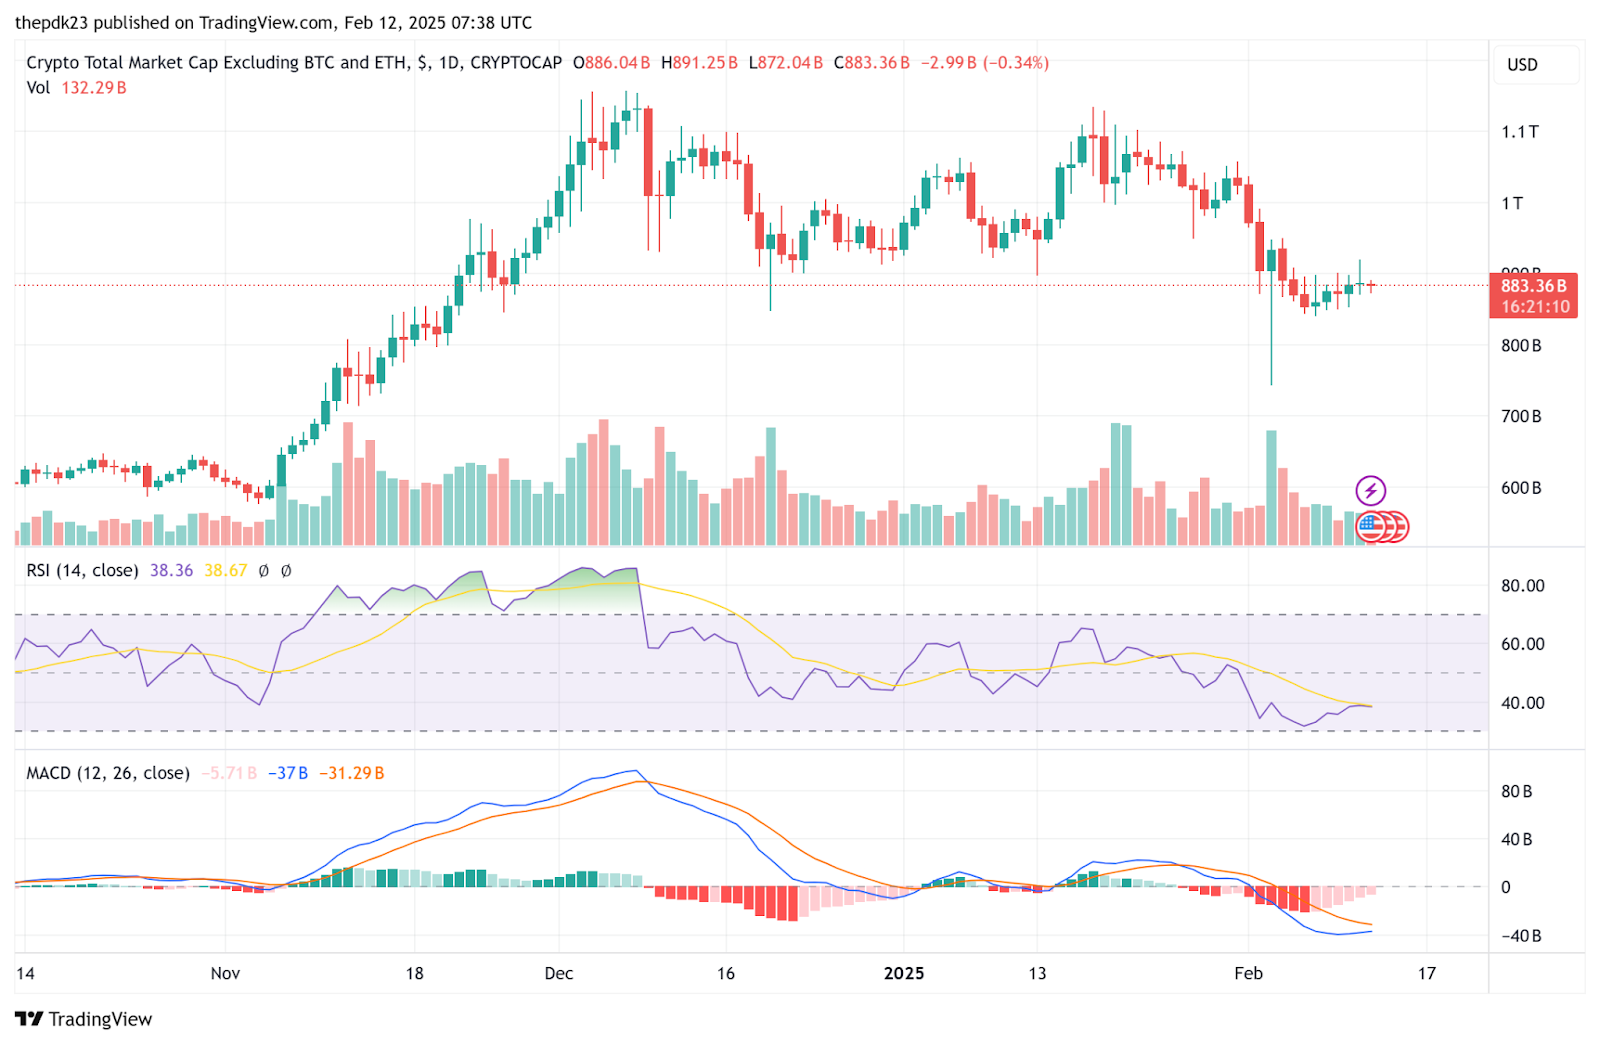
- The 20-day EMA for altcoin market cap stands at $928 billion which is a major resistance.
- Glassnode highlighted the stark difference between Bitcoin and altcoins this cycle, resulting in uncertainty.
Over the past two weeks, the altcoin market slumped, erasing roughly $234 billion in market capitalization. The steep drop raised concerns about the crypto market’s durability, especially as Bitcoin stayed ahead of ERC-20 altcoins.
Glassnode data revealed a clear split: Bitcoin maintained its stability while many ERC-20 altcoins plunged sharply. In addition, CoinMarketCap reports that the total crypto market cap (excluding BTC and ETH) rests at $883.36 billion, down from a peak of $1.16 trillion.
Market Data Signals Continued Altcoin Weakness
Meanwhile, a key observation from the market data is the rejection at the 20-day Exponential Moving Average (EMA) at $928 billion. This level acts as a strong barrier against a bullish surge, implying that altcoins lack upward momentum and may drop further unless a major reversal emerges.
Related: Ethereum Price Set for $4K Breakout as Upgrades Propel Rally
Capital Rotation Favors Bitcoin
Note that the crypto market tumbled in early February following US President Donald Trump’s announcement of tariffs on China, Canada, and Mexico. Although Bitcoin bounced back, altcoins like XRP, BNB, Solana (SOL), and meme coins suffered steep losses.
Investors seem to be shifting funds into Bitcoin, favoring it over riskier altcoins that face challenges in adoption and practical use. Moreover, regulatory pressure on many ERC-20 tokens has dampened market sentiment.
Altcoin Market Cap Outlook
Chart analysis indicates that if the altcoin market does not surpass the 20-day EMA at $928 billion, declines toward the $800 billion mark might follow. Meanwhile, the Relative Strength Index (RSI) hovers just above 38, hinting at a slight bounce soon. Still, any recovery will require solid volume support to prove a lasting change.
Related: 480k to 146k: Bitcoin’s OTC Exodus and the Bull Market Debate
The MACD indicator confirms seller control, with the blue line staying below the red signal line. The MACD histogram remains red, though its intensity is waning, hinting at a potential bullish crossover shortly.
Disclaimer: The information presented in this article is for informational and educational purposes only. The article does not constitute financial advice or advice of any kind. Coin Edition is not responsible for any losses incurred as a result of the utilization of content, products, or services mentioned. Readers are advised to exercise caution before taking any action related to the company.


