- XRP consolidates, targeting a $2.92 breakout; mixed indicators show seller influence.
- Solana holds its 50-week EMA (historically bullish) but faces a $180 resistance test.
- Shiba Inu is bearish: burn rate collapse, weekly bear flag, targets $0.0000050.
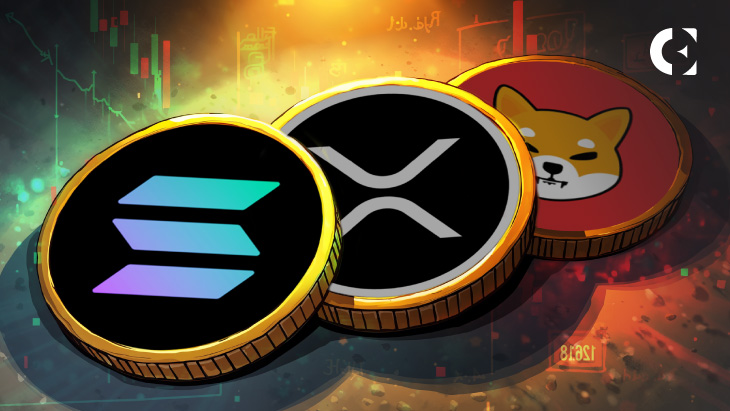
As the crypto market stagnates with Bitcoin (BTC) at $105K, top altcoins like XRP, Solana (SOL), and Shiba Inu (SHIB) are showing sharply divergent technical setups, ranging from potential breakout signals to issuing bearish warnings.
Here’s a closer look at their positioning and what technical indicators suggest might lie ahead.
XRP Eyes Breakout, But Bears Still Present
XRP is currently trading at $2.18, down nearly 3% in the last 24 hours, as it continues to consolidate within a defined ascending channel. The lower trendline is holding firm as support, but the upper resistance at $2.92 remains the key level to watch.
A breakout above this line could unlock a fresh bullish phase—possibly even setting the stage for new all-time highs (ATHs).
Despite this potential, momentum indicators are currently flashing mixed signals for XRP. The Relative Strength Index (RSI) sits at 40.50, hinting at mild bearish pressure, while the Balance of Power (BoP) stands at -0.45, suggesting sellers still have a grip on the market. For bulls to take control, XRP must push convincingly above the $2.92 mark.
Related: BTC, SOL, BNB, and ADA Funding Rate Flips Negative—Is the Crypto Market Bracing for a Drop?
Solana (SOL): Balancing Bullish History with Short-Term Questions
Solana has shown resilience, holding above its 50-week exponential moving average (EMA) for three straight weeks—a level that historically precedes significant rallies. As of now, SOL trades at $163.08, down about 6% in the last 24 hours, but it remains well-positioned from a long-term perspective.
The daily chart below suggests that the weekly RSI stands at 52.60, indicating growing bullish strength. Trend-based Fibonacci extensions point to a near-term upside target of $300, with a longer-term target around $418 based on the 1.618 FIB level.
However, caution lingers. Analyst Carl Moon flagged a possible double top on the 4-hour chart, warning of a retrace toward the $152–$157 zone. The crucial $180 resistance remains the battleground. A decisive break above it could confirm bullish continuation, while rejection might trigger a correction.
Shiba Inu (SHIB): Bearish Clouds Gather
In stark contrast to XRP and SOL, Shiba Inu (SHIB) appears to be slipping into bearish territory. The token’s burn rate has collapsed by 98.47%, with only 200,000 tokens destroyed in the past day.
More critically, SHIB is forming a bear flag pattern on the weekly chart—an ominous continuation signal that suggests further downside. On-chain data shows 2 trillion SHIB tokens flowing into exchanges over the past month, escalating selling pressure. Should the bear flag confirm, SHIB could slide toward $0.0000050, wiping out all gains from 2024.
The chart below shows that the RSI is at 40, signaling bearish dominance. On the other hand, the MACD shows a recent bullish crossover, but remains in negative territory—hinting at uncertain momentum.
Related: BTC Dominance Down, But These 4 Altcoins To Go Big Says Top Analyst
A move above $0.000021 would invalidate the bear flag and reignite upward momentum, but absent that, SHIB appears vulnerable to deeper losses.
Disclaimer: The information presented in this article is for informational and educational purposes only. The article does not constitute financial advice or advice of any kind. Coin Edition is not responsible for any losses incurred as a result of the utilization of content, products, or services mentioned. Readers are advised to exercise caution before taking any action related to the company.


