 Price Prediction 2025-2030: Future Outlook, Growth Potential, and Market Trends")
- In 2025, Aptos (APT) is forecasted to trade between $7.05 and $19.08, with an average price of $12.56, reflecting potential bullish momentum.
- A breakout above the $10-$12 resistance zone in 2025 could accelerate APT toward its maximum projected price target of $19.08.
- Technical indicators suggest that sustaining above the $7.05 support level in 2025 could set the stage for a prolonged uptrend.
Aptos (APT) is a Layer 1 blockchain platform designed to deliver high performance and scalability for decentralized applications (dApps). Founded in 2021 by former Meta employees Mo Shaikh and Avery Ching, Aptos leverages the Move programming language, originally developed for Meta’s Diem project, to enhance security and efficiency in smart contract development.
The platform employs a Proof-of-Stake (PoS) consensus mechanism, enabling rapid transaction processing and reduced energy consumption. As of February 21, 2025, APT is trading at $6.35, with a market capitalization of approximately $3.73 billion. The token serves multiple functions within the ecosystem, including transaction fees, staking rewards, and governance participation.
Aptos has established strategic partnerships with industry leaders such as Microsoft, Google Cloud, and NBCUniversal, aiming to integrate blockchain technology across various sectors and drive the adoption of Web3 solutions.
Table of contents
- Aptos (APT) Current Market Status
- Aptos (APT) Price Prediction 2025-2030 Overview
- Bollinger Band Analysis for Aptos (APT)
- MACD Analysis for Aptos (APT)
- Relative Strength Index (RSI) Analysis for Aptos (APT)
- Support and resistance levels for Aptos (APT)
- Aptos (APT) 2025 Price Prediction Analysis
- Aptos (APT) Price Prediction for 2026
- Aptos (APT) Price Prediction for 2027
- Aptos (APT) Price Prediction for 2028
- Aptos (APT) Price Prediction for 2029
- Aptos (APT) Price Prediction for 2030
- FAQs
Aptos (APT) Current Market Status
| Name | Aptos |
| Symbol | APT |
| Rank | 34 |
| Price | $6.36 |
| Price Change (24h) | -3.91% (1d) |
| Price Change (7d) | 3.01% (7d) |
| Market Cap | $3.74B |
| Circulating Supply | 587.74M APT |
| Total Supply | 1.14B APT |
Aptos (APT) Price Prediction 2025-2030 Overview
| Year | Minimum Price (USD) | Average Price (USD) | Maximum Price (USD) |
| 2025 | $7.05 | $12.56 | $19.08 |
| 2026 | $13.30 | $19.20 | $26.10 |
| 2027 | $19.50 | $23.80 | $32.60 |
| 2028 | $27.00 | $31.50 | $45.90 |
| 2029 | $37.50 | $42.80 | $57.10 |
| 2030 | $52.80 | $59.20 | $72.50 |
Bollinger Band Analysis for Aptos (APT)
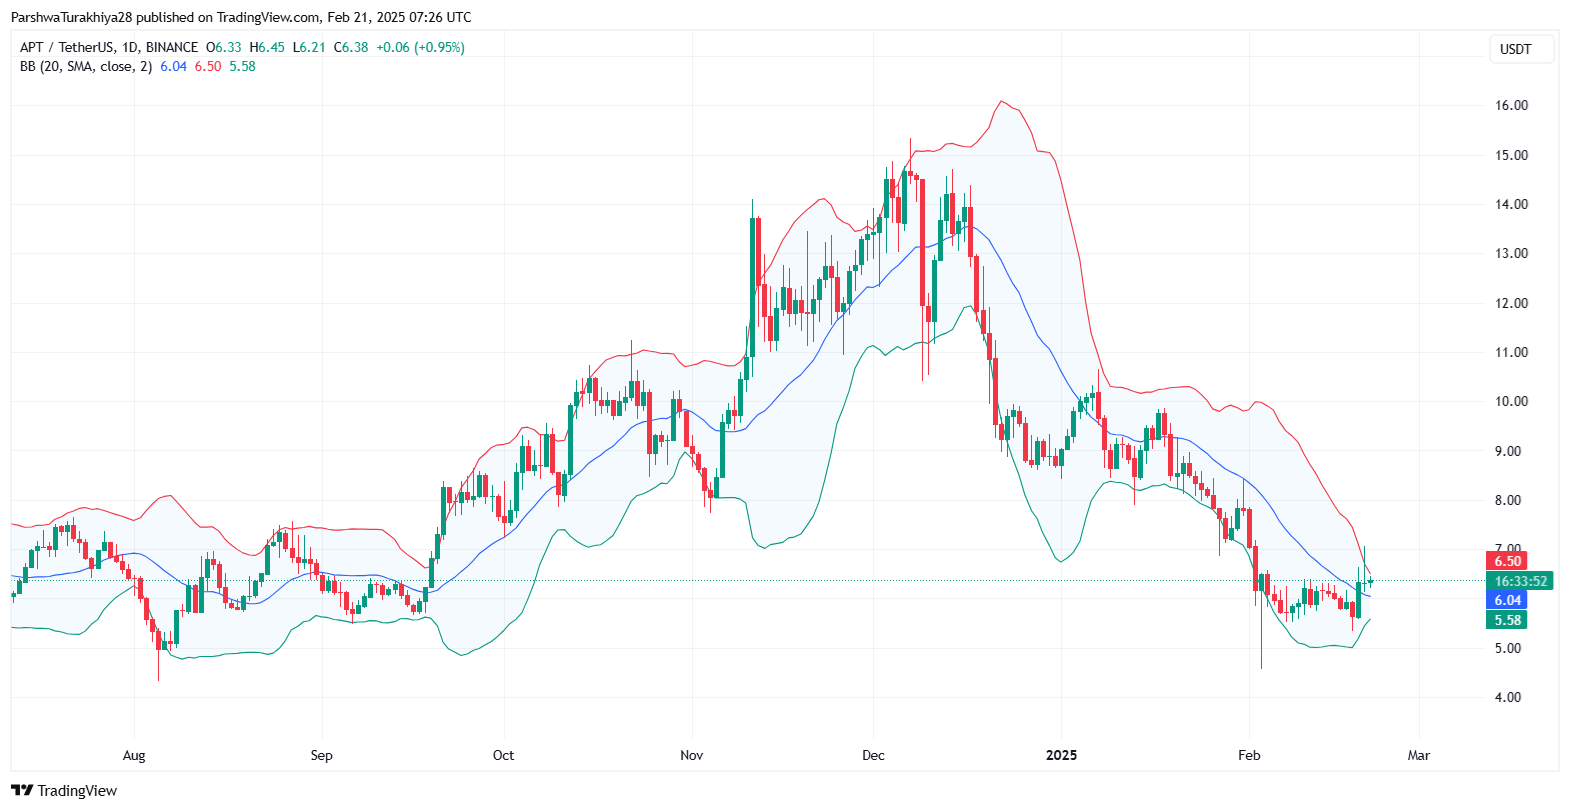
The Bollinger Bands indicate that APT/USDT has recently rebounded from the lower band (5.58 USDT) and is now trading near the middle band (6.04 USDT, 20-day SMA). This suggests a short-term recovery.
The bands have been narrowing, which typically signals a volatility squeeze—a precursor to a strong breakout. If the price continues upward and breaks above the upper band (6.50 USDT), it could trigger further upside momentum toward 7.00 USDT and beyond. On the other hand, rejection at the middle band could lead to a retracement back toward the lower band. A break below the 5.50–5.60 USDT zone would be a bearish signal, indicating a continuation of the downtrend.
MACD Analysis for Aptos (APT)
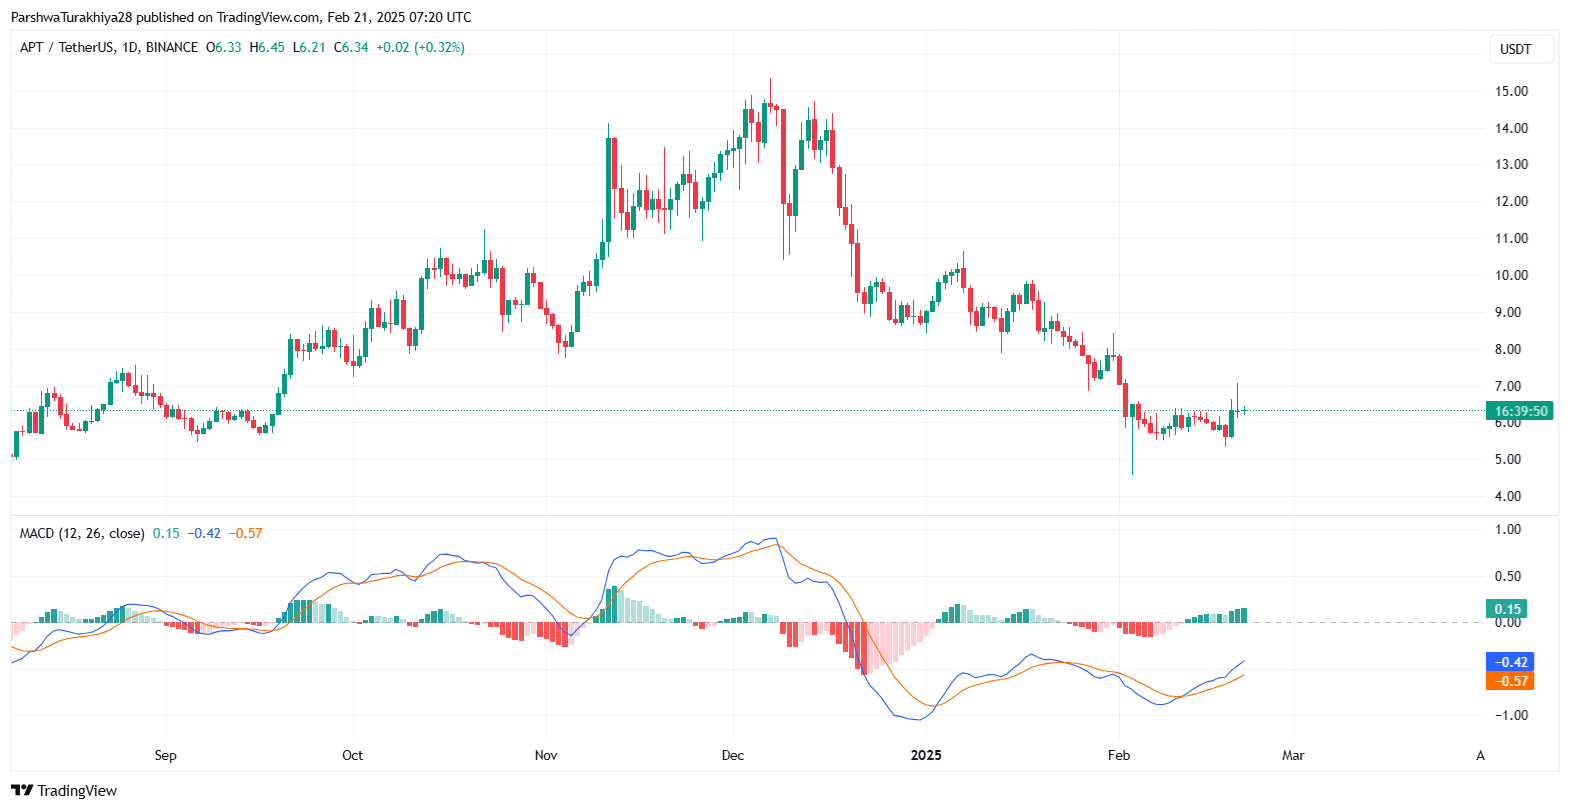
APT/USDT price is showing early signs of a bullish crossover, with the MACD line (-0.42) closing in on the signal line (-0.57). This convergence suggests that bearish momentum is weakening. The histogram has been printing less negative bars, which implies a possible shift in trend direction.
If the MACD line crosses above the signal line in the coming sessions, it will act as a strong buy confirmation for traders looking for entry points. However, for stronger confirmation, traders should look for MACD crossing into the positive zone (above 0), as it would indicate full trend reversal. On the downside, if the MACD fails to cross above the signal line and turns downward again, it would reinforce the ongoing bearish sentiment.
Relative Strength Index (RSI) Analysis for Aptos (APT)
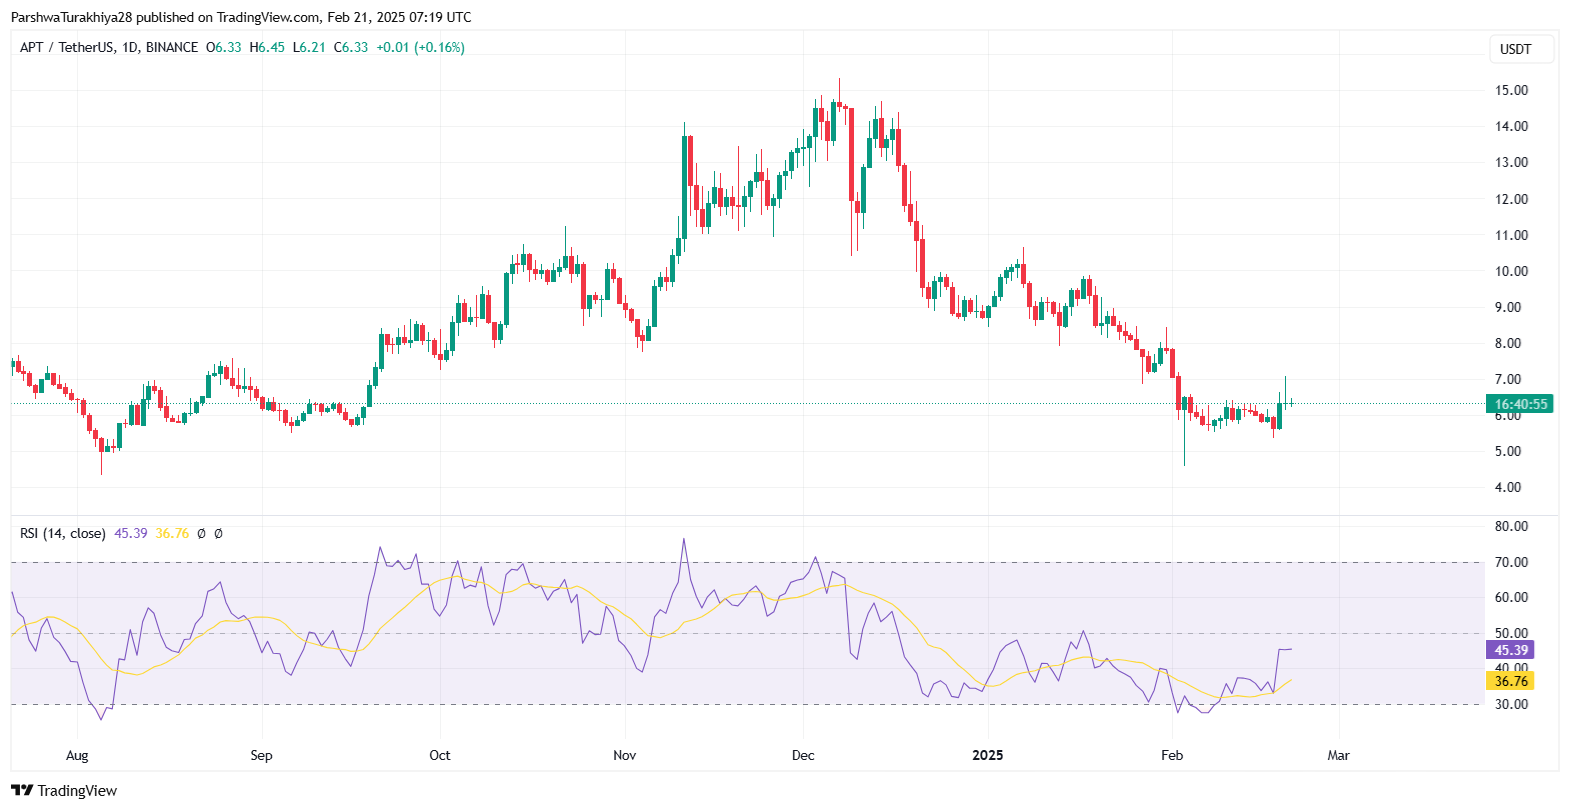
The Relative Strength Index (RSI) on the daily timeframe for APT/USDT is currently at 45.55, indicating a neutral to slightly bearish trend. However, we observe a significant upward movement from the recent oversold territory near 36.78, which suggests a shift in momentum toward recovery. Historically, when RSI moves upward after touching the 30 level (oversold zone), it often signals a potential trend reversal. Additionally, the RSI has recently crossed above its moving average line, which is another early sign of bullish momentum. Traders should watch for RSI breaking above 50, as that would confirm stronger buying pressure and a potential continuation of the uptrend. On the downside, if RSI fails to break 50 and reverses, it could indicate weakness in the recovery.
Support and resistance levels for Aptos (APT)

The trendlines and support/resistance zones highlight key levels that will determine the future direction of APT/USDT. The nearest support zone is at 4.74 USDT, which aligns with previous price action where strong buying pressure was observed. If price holds above this level, it will strengthen the case for a bullish reversal.
On the upside, the next major resistance is at 8.84 USDT, where sellers have previously stepped in. A break and close above this resistance could push APT toward psychological levels like 10.00 USDT. Currently, the price is trading within the 6.00–6.50 range, meaning a breakout on either side could set the direction for the coming weeks. Traders should monitor these key levels for confirmation of trend continuation or reversal.
Aptos (APT) 2025 Price Prediction Analysis
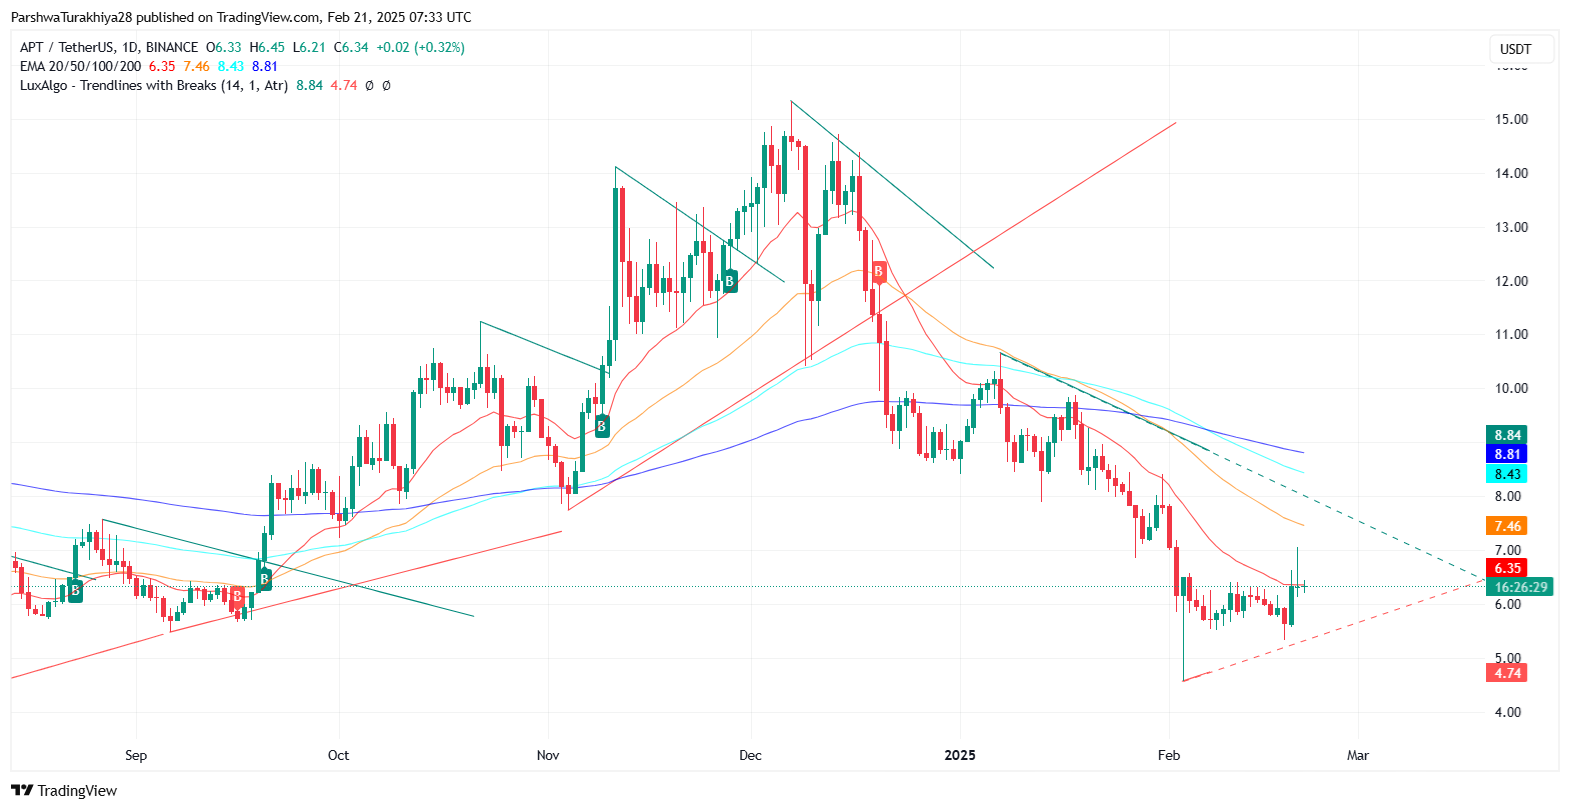
Aptos (APT) is projected to trade within a range of $7.05 (minimum) to $19.08 (maximum) in 2025, with an average price of $12.56. The technical indicators suggest that Aptos is currently attempting a trend reversal, as seen in the recent breakout from the descending trendline resistance on the daily chart. The Exponential Moving Averages (EMAs) indicate key support and resistance zones, with the 20 EMA at $6.36 acting as immediate support and the 100-200 EMAs between $8.44 and $8.81 posing potential resistance in the short term.
If APT manages to sustain above the $7.05 support level, a steady climb toward the $12.56 average target remains likely, with $8.44 to $8.81 acting as a critical consolidation zone before further upward movement. A successful breakout above the $10-$12 range could accelerate momentum toward the $19.08 peak projection, aligning with historical resistance levels. However, failure to maintain support could lead to temporary retracements before another bullish attempt.
Market conditions, investor sentiment, and overall crypto adoption will play a crucial role in Aptos’ trajectory throughout 2025. With increasing developer activity and DeFi adoption, APT has the potential to test new highs, provided the broader market supports its bullish structure.
Aptos (APT) Price Prediction for 2026
APT/USDT is expected to witness strong bullish momentum in 2026, with price levels potentially ranging between $13.30 and $26.10. The average forecast of $19.20 suggests a solid recovery phase, possibly driven by higher adoption, ecosystem expansion, and improved market sentiment. If market conditions remain favorable, a break above $26.10 could open doors for a long-term bullish structure.
Aptos (APT) Price Prediction for 2027
The year 2027 may bring increased volatility and price acceleration, with APT forecasted to trade between $19.50 and $32.60. The average price of $23.80 indicates a steady uptrend, likely fueled by institutional participation and increased utility within the blockchain space. If resistance near $32.60 is breached, we could see an extended rally into higher price zones.
Aptos (APT) Price Prediction for 2028
APT is projected to establish a strong uptrend in 2028, with a trading range of $27.00 to $45.90, positioning itself as a leading digital asset. The average price of $31.50 suggests steady growth, with possible catalysts including mainstream adoption and technological innovations. If the market sees continued demand, a breakout beyond $45.90 could drive an even stronger price rally.
Aptos (APT) Price Prediction for 2029
A significant price surge is anticipated in 2029, as APT could trade between $37.50 and $57.10, reflecting its growing adoption. The $42.80 average price implies a stable market with increasing investor confidence. If the asset successfully holds above $50, it could set the stage for a stronger bullish cycle leading into the next decade.
Aptos (APT) Price Prediction for 2030
By 2030, APT may reach new highs, with a projected range of $52.80 to $72.50. The average price of $59.20 indicates a fully matured ecosystem, possibly benefiting from wider integration and institutional adoption. A confirmed breakout above $72.50 could establish a new price discovery phase, marking APT’s position as a dominant long-term asset in the crypto space.
FAQs
Aptos is a Layer 1 blockchain designed for high-speed transactions, smart contracts, and scalability, utilizing the Move programming language for enhanced security and efficiency.
Market adoption, ecosystem expansion, DeFi growth, and overall investor sentiment will play major roles in shaping APT’s price movements in 2025.
Aptos is projected to trade between $7.05 (minimum) and $19.08 (maximum) in 2025, with an average expected price of $12.56.
APT is showing signs of a trend reversal with a breakout from descending resistance, bullish MACD convergence, and RSI moving toward 50.
While the projected high for 2025 is $19.08, a breakout beyond key resistance levels could push APT above $20, depending on market conditions.
Key support lies at $7.05, with resistance between $10-$12, and a potential breakout level at $19.08.
With increasing adoption and strategic partnerships, APT shows long-term potential, especially if it maintains its projected growth trajectory beyond 2025.
Aptos offers high-speed transactions, Move-based smart contracts, and a secure Proof-of-Stake consensus, setting it apart from other blockchain networks.
Aptos aims to support DeFi projects, NFT platforms, and enterprise solutions by providing a scalable and developer-friendly blockchain infrastructure.
APT is available on major exchanges like Binance, Coinbase, and Kraken, along with decentralized exchanges supporting the Aptos ecosystem.
Disclaimer: The information presented in this article is for informational and educational purposes only. The article does not constitute financial advice or advice of any kind. Coin Edition is not responsible for any losses incurred as a result of the utilization of content, products, or services mentioned. Readers are advised to exercise caution before taking any action related to the company.
 Price Prediction: Weak Momentum Signals Possible Drop to $62K")

 Price Prediction for April 2026: Will Chainlink Move Higher?")
 Price Prediction: Can Bulls Sustain the $0.045 Push?")
