
- ARB drops below $0.46 after brief breakout fails near $0.49 resistance level.
- Trading volume falls 11.67% as sellers regain control of short-term market trend.
- RSI and MACD remain bullish, signaling possible recovery if support levels hold.
Arbitrum (ARB) attempted a major breakout on Friday but was sharply rejected at a key resistance level, causing the price to fall back into consolidation. However, key momentum indicators remain bullish, suggesting the upward trend that has been building for weeks may not be over yet.
On July 18, ARB surged to an intraday high of $0.49, but the rally quickly faded. As noted by crypto analyst Ali, the price failed to hold above the critical $0.47 level. At press time, ARB was trading at $0.4557, down 2.19% over the past 24 hours.
A breakout attempt rejected at the key $0.47 level
At the time of writing, ARB was trading at $0.4557, reflecting a 2.19% decline over the past 24 hours, according to CoinMarketCap. The token’s attempt to reclaim the $0.4722 resistance zone was rejected, leading to a decline that has now pushed the price back into consolidation.
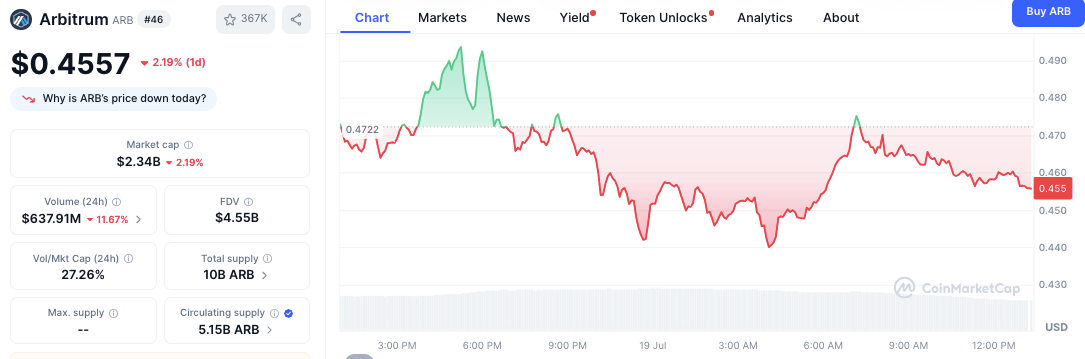
Trading volume has dropped by 11.67% to $637.91 million, while market capitalization stands at $2.34 billion. A volume-to-market cap ratio of 27.26% suggests active trading, but the direction has favored sellers.
Related: Altcoins to Watch as Ethereum Breaks Higher: UNI, ARB, LINK, RNDR
The fully diluted valuation of ARB is currently $4.55 billion. Additionally, the circulating supply stands at 5.15 billion tokens out of a total of 10 billion. With no fixed maximum supply, investor sentiment remains closely tied to token unlock schedules and broader Layer 2 market dynamics.
Indicators Signal Ongoing Bullish Momentum
Despite the pullback, technical indicators show a possible continuation of the previous upward trend. The Relative Strength Index (RSI) remains high at 72.09, above the moving average of 63.27. This shows ongoing buying pressure, although the overbought level signals caution.
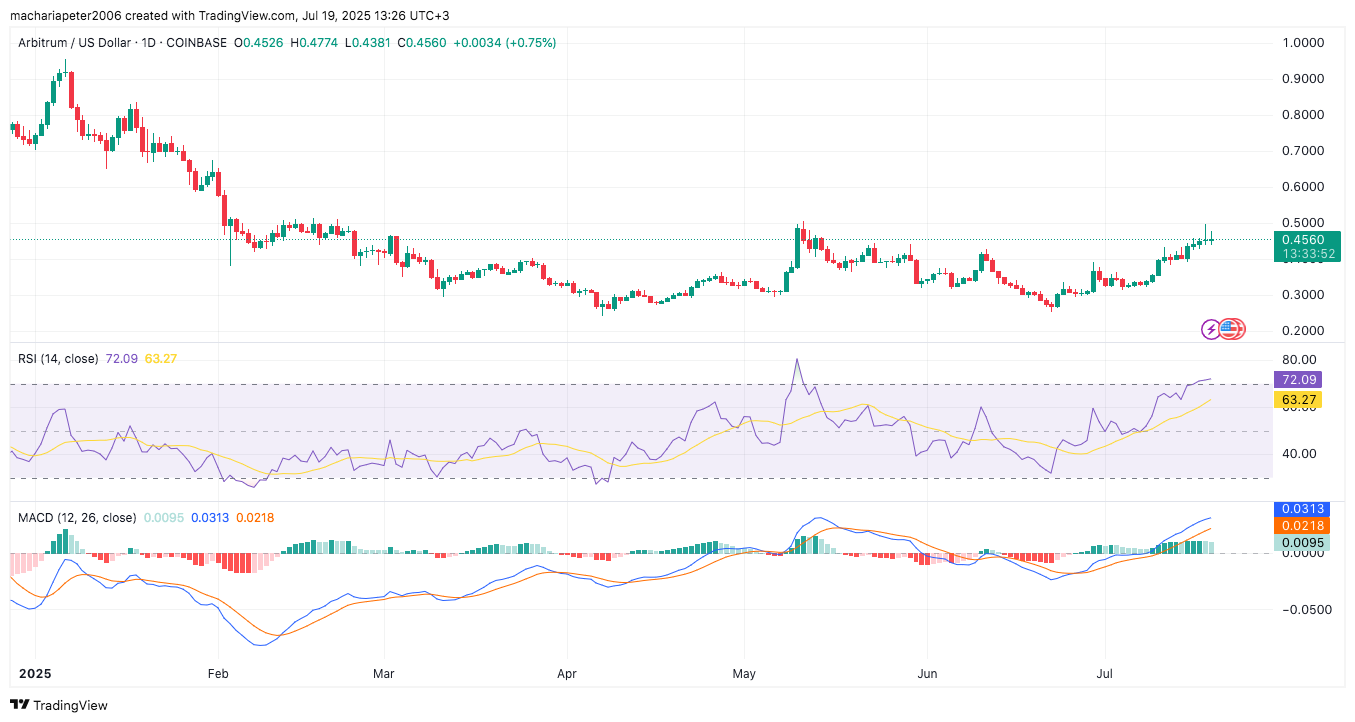
Moreover, the Moving Average Convergence Divergence (MACD) continues to show a positive trend. The MACD line is at 0.0313, above the signal line at 0.0218, with a green histogram strengthening bullish momentum. The indicator has held onto this pattern since early July, supporting the possibility of a renewed upward move if price stability returns.
What to watch for in the days ahead
Arbitrum is currently in a tug-of-war. The price action shows a clear rejection from resistance, but the underlying momentum indicators suggest the bulls haven’t given up.
Related: Arbitrum (ARB) Price Prediction 2025, 2026, 2027-2030
The next major move for ARB will likely be decided by whether this bullish momentum can translate into another, more successful attempt at breaking the $0.47 resistance.
Disclaimer: The information presented in this article is for informational and educational purposes only. The article does not constitute financial advice or advice of any kind. Coin Edition is not responsible for any losses incurred as a result of the utilization of content, products, or services mentioned. Readers are advised to exercise caution before taking any action related to the company.


