
- ARB fell below $1 — a testament that an increase in network participation does not mean a hike in price.
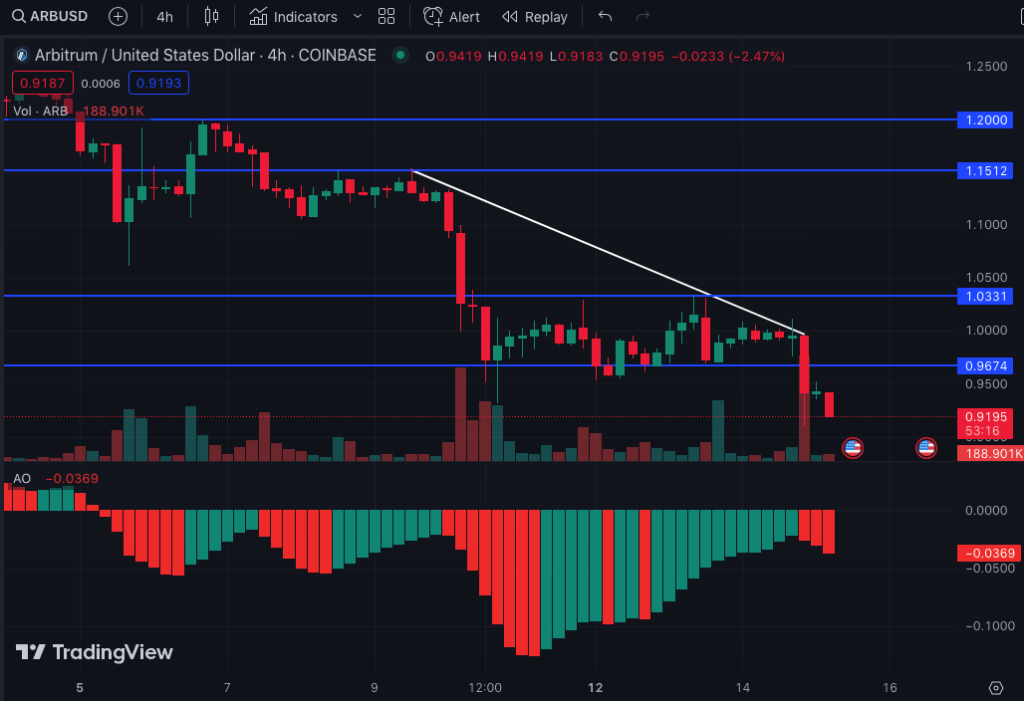
- Demand shrunk, pushing the price back to $0.96 as bearish momentum continues to thrive.
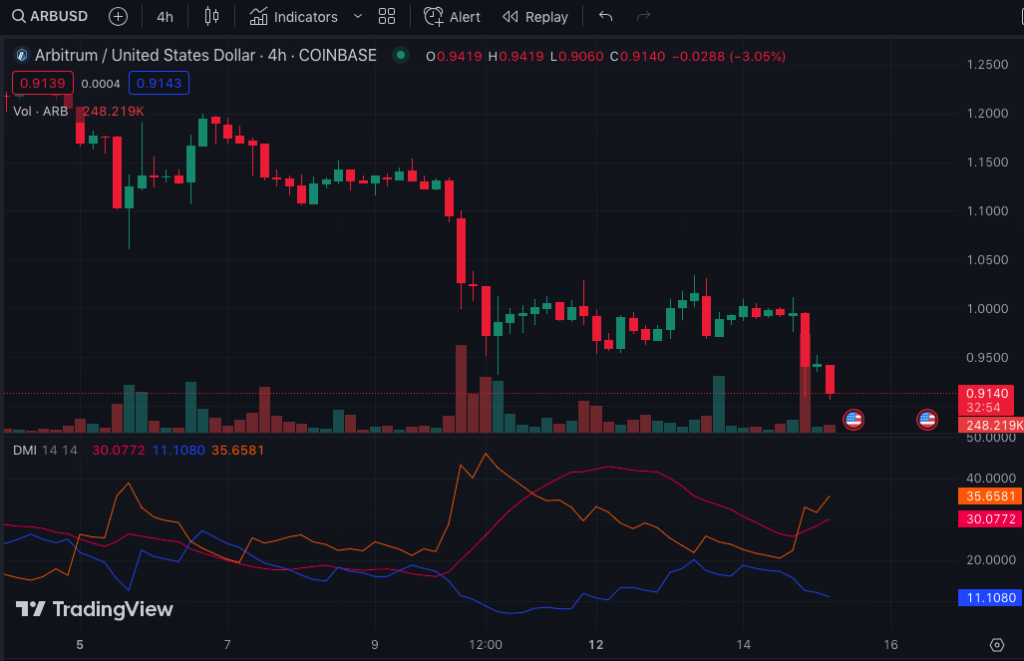
- The ADX backed the dominance of sellers while bulls struggled to keep up.
The native governance token of the Arbitrum (ARB) network had dropped below the $1 threshold. In a move that saw the price decrease by 6.78% in the last 24 hours, ARB exchanged hands at $0.92 at press time.
Launched into the market on March 16, 2023, the Ethereum (ETH) L2 scaling solution distributed rewards in ARB tokens to its early adopters. This decision resulted in massive selling pressure.
Sellers Have Kept Demand In Check
In addition to this several other attempts to climb up the charts have not yielded significant results. The above has left the token all-time performance at a 21.62% decrease.
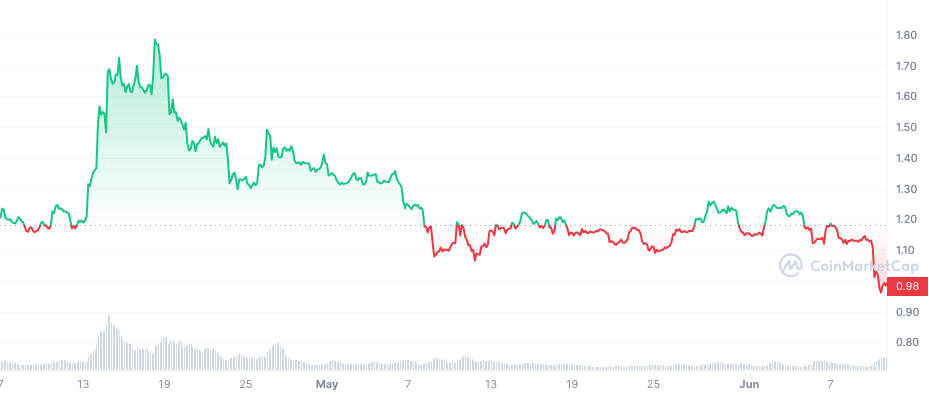
But on a number of occasions, Arbitrum has proven to be useful to market participation, surpassing Ethereum transactions. However, this has not helped its price which continued to slip.
As of June 6, ARBs’ price increased to $1.20. However, the demand around that zone dwindled, such that the uptrend could not beat the resistance at the same price.
Yet, bulls tried to push up the price after intense bearish pressure sent the token on a downward slope. As per the 4-hour timeframe, demand soared from $0.96. But like the initial mentions, selling pressure overrode bulls, pushing back the price to $0.96.
However, indications from the Awesome Oscillator (AO) showed that ARB has shifted toward being bearish.
Usually, if the AO is above zero, then it means the 5-day momentum is greater than the 34-day momentum. But with ARB, it was the opposite. Hence, the theory that the price could keep moving in the downward direction.
ARB’s Direction Is Gloomy
Moreso, the Directional Movement Index (DMI) was able to confirm the AO bias. By comparing ARB’s highs and lows, the + DMI (blue) was 11.10. On the other hand, the -DMI (red) was 35.65.
An instance like this reflects how dominant bears have been in the current market. However, it is also important to consider the Average Directional Index (ADX) before making an inference with the DMI.
At press time, the ADX (orange) was 30.07. Typically, when the indicator is above 25, it signals a solid directional strength for the cohort in control.
On the other hand, when it’s below the value, it means that the directional strength is weak. Therefore, bears might continue to thrive considering the current market condition.
Meanwhile, if ARB was to exit the current red zone, then it might need a significant Bitcoin (BTC) uptrend since the two assets share some sort of correlation.
Disclaimer: The views, opinions, and information shared in this price prediction are published in good faith. Readers must do their research and due diligence. Any action taken by the reader is strictly at their own risk. Coin Edition and its affiliates will not be liable for direct or indirect damage or loss.
Disclaimer: The information presented in this article is for informational and educational purposes only. The article does not constitute financial advice or advice of any kind. Coin Edition is not responsible for any losses incurred as a result of the utilization of content, products, or services mentioned. Readers are advised to exercise caution before taking any action related to the company.


