
- Astar’s Tokenomics 3.0 aims to reshape supply with emission decay and fee burning.
- $ASTR hovers near key support at $0.02225, with volume down 68% signaling caution.
- Neutral RSI and flat MACD highlight consolidation as traders await tokenomics update
Astar ($ASTR) is preparing for a structural overhaul through its Tokenomics 3.0 proposal. The plan introduces emission decay, fee burning, and Protocol-Owned Liquidity, marking a shift toward a fixed supply model that could redefine how investors value the token.
The move comes as Astar broadens its ecosystem. A SafePal native integration, scheduled for September 28, is expected to bolster utility and drive adoption across wallets and users. Market participants now watch closely, as the tokenomics upgrade could reset supply dynamics and long-term sentiment.
Price Action and Key Levels
At present, $ASTR’s price movement exhibits moderate fluctuations. Over the last 24 hours, the price dipped from a high of $0.02299 to a low of $0.02275, reflecting a minor decrease of about 0.29%.
This subtle drop signifies the downward pressure on the token, despite occasional recoveries. A brief uptick in the price gives hope, but it’s followed by a resumption of the decline, indicating that the market is yet to show strong bullish momentum.
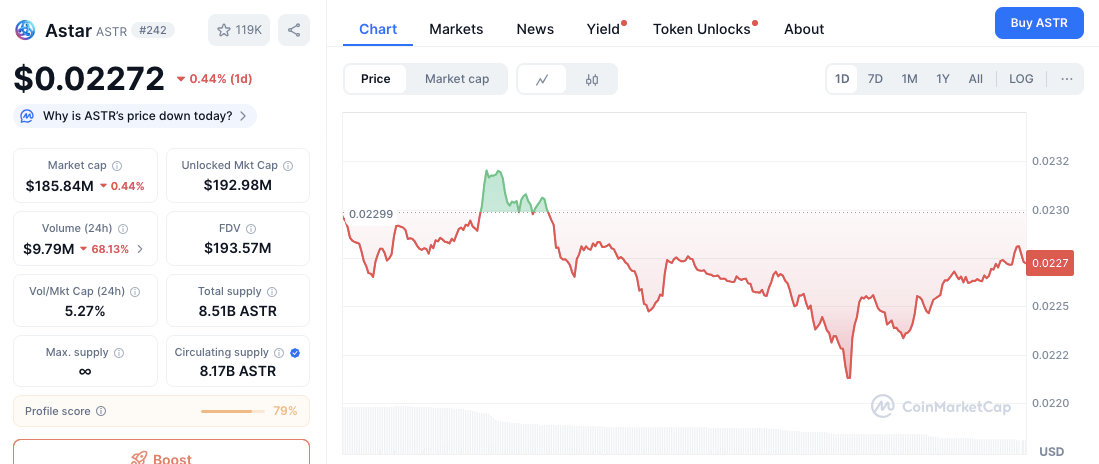
On the upside, clearing $0.02299 resistance could open a path toward stronger recoveries. For now, the token’s trade is defined by narrow ranges and muted conviction from buyers.
Market Metrics Show Consolidation
The current market conditions show a notable decrease in trading volume, dropping by 68.13% to $9.81 million over the last 24 hours. This drop in volume suggests a lack of immediate market interest, possibly due to uncertainty or anticipation ahead of the tokenomics shift.
With the market capitalization standing at $186.14 million, showing only a slight decrease of 0.3%, the overall market value of $ASTR has not experienced significant erosion. This suggests that while the token may be facing some challenges, it is holding its ground for the moment.
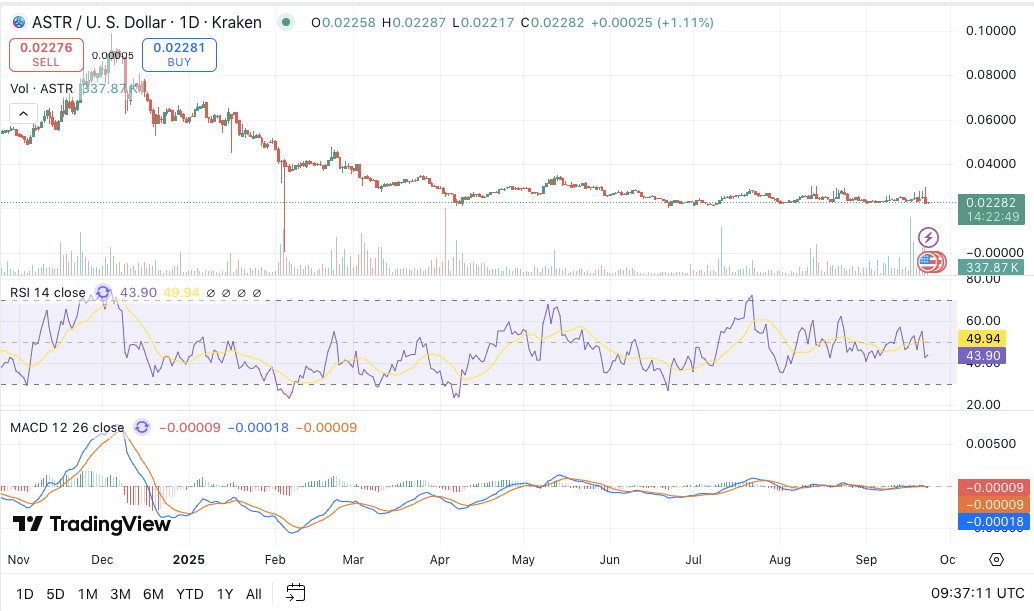
Furthermore, the Moving Average Convergence Divergence (MACD) indicator reveals weak buying pressure. Although the histogram is slightly positive, the overall momentum remains flat.
The convergence of the MACD and signal lines implies that the market is in a consolidation phase, with no clear direction. Similarly, the Relative Strength Index (RSI) is sitting at 46.92, near the neutral zone of 50. This indicates neither overbought nor oversold conditions, further supporting the view of a market in limbo.
Disclaimer: The information presented in this article is for informational and educational purposes only. The article does not constitute financial advice or advice of any kind. Coin Edition is not responsible for any losses incurred as a result of the utilization of content, products, or services mentioned. Readers are advised to exercise caution before taking any action related to the company.


 Price Prediction: Canton Eyes Key Break After Market Activity Spike")

